Ecommerce

Introduction
In this chapter, we review the state of ecommerce on the web. An ecommerce website is an “online store” that sells physical or digital products. When building your online store, there are several types to choose from:
- Software-as-a-Service (SaaS) platforms such as Shopify minimize the technical knowledge required to open and manage an online store. They do this by restricting access to the codebase as well as removing the need to worry about hosting.
- Platform-as-a-service (PaaS) platforms such as Adobe Commerce (Magento) provide an optimized technology stack & hosting environment while still providing full codebase access.
- Self-hosted platforms such as WooCommerce
- There are also headless platforms like CommerceTools that are “API-as-a-service”. They provide the ecommerce backend as a SaaS and the retailer is responsible for building and hosting the frontend experience.
Note that platforms may fall into more than one of these categories. For example, Shopware has SaaS, PaaS, and self-hosted options.
Platform detection
We used an open-source tool called Wappalyzer to detect technologies used by websites. It can detect content management systems, ecommerce platforms, JavaScript frameworks and libraries, and more.
For this analysis, we considered any of the following to indicate that a website is an ecommerce website:
- Use of a known ecommerce platform (see limitations)
- Use of a technology that implies an online store, e.g., Google Analytics Enhanced Ecommerce
You can learn more about the Methodology.
Limitations
Our methodology has some limitations which affect its accuracy.
Firstly, there are limitations to our ability to recognize an ecommerce site:
- Wappalyzer must have detected an ecommerce platform.
- The detection of a payment processor such as PayPal was insufficient for a website to be considered to be ecommerce. This is because there are sites that accept online payments which are not online stores, e.g., B2B SaaS.
- If the ecommerce platform is hosted within a sub-directory of the website, it cannot be detected as only home pages are analyzed.
- A headless implementation reduces our ability to detect the platform in use. One of the primary methods to detect an ecommerce platform is to recognize common HTML or JavaScript components. So, a headless website that does not use the ecommerce platform frontend makes it hard to detect as ecommerce.
Next, the accuracy of metrics or commentary may also be affected by the following limitations:
- Any trends seen may be influenced by changes in detection accuracy and not entirely a reflection of industry trends. For example, an ecommerce platform may appear to become more popular because the detection method has improved.
- All website requests were made from the United States. If a website redirects to a more appropriate website based on geographic location, the final location will be analyzed.
- The sites crawled are from the Chrome UX Report which has a bias towards websites visited by users of the Chrome browser.
Ecommerce platforms
Our analysis considered mobile and desktop websites. These sites are those that are actively visited by Chrome users, see the Methodology for more information. Most of the websites visited are in both result sets but some are only in one. We will often share statistics for mobile and desktop. When there is little variation, we may choose to only show one. In this case, unless otherwise noted, only the mobile metrics will be shown.
The mobile analysis received responses from 7.5 million sites and found that 1.5 million (19.5%) of them had some form of ecommerce functionality. Similarly, the desktop analysis received responses from 6.3 million sites and found that 1.3 million (20.2%) were ecommerce.
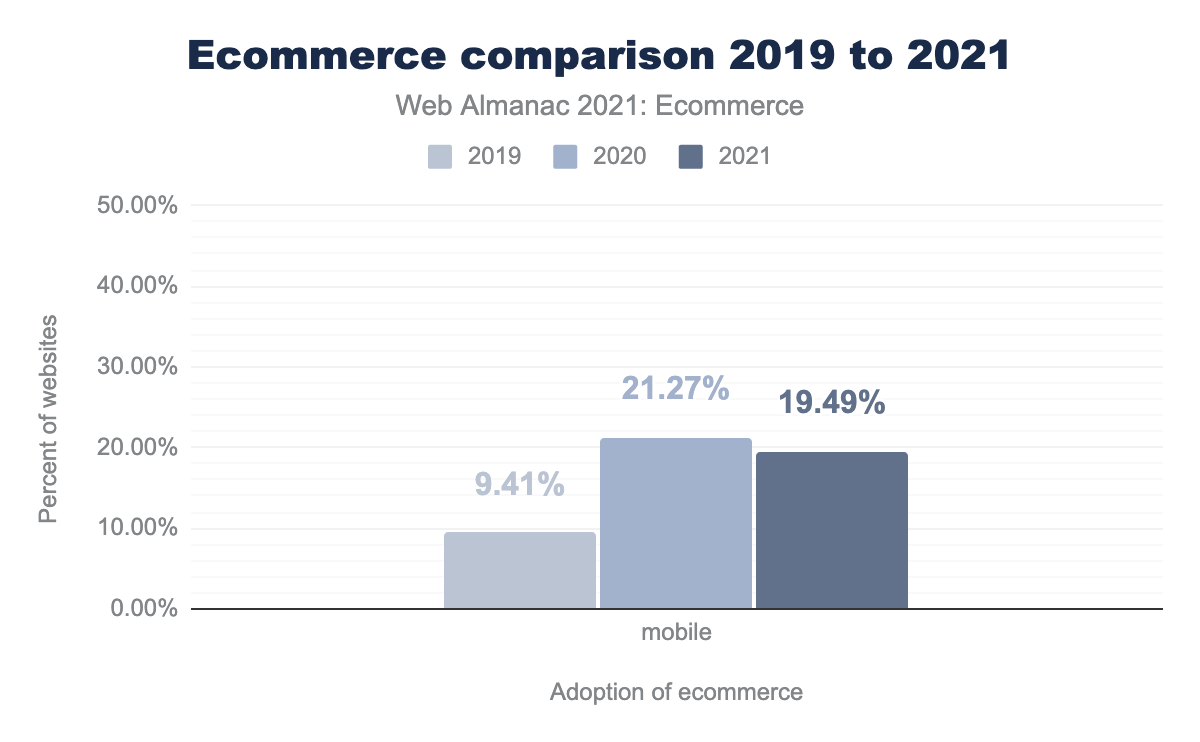
The overall share of ecommerce sites shrunk by 1.8% on mobile (1.6% on desktop) compared to last year’s report which found 21.3% of sites were ecommerce (21.7% on desktop). The number of ecommerce sites still increased, with 4.5% more found this year on desktop (8.3% on mobile) compared to last year. However, this growth didn’t keep pace with the growth in the overall list of sites visited by Chrome users.
Comparing this with the 2019 results where 9.45% of mobile sites were ecommerce, we can see that while the change in the last year has been insignificant, over the last 2 years the increase is dramatic and sustained.
However, this should not be considered as evidence of ecommerce growth in response to COVID-19. As was reported last year, this increase comes from our improved ability to detect ecommerce platforms: from increased platform coverage, to also using secondary signals such as the presence of Google Analytics Enhanced Ecommerce to indicate that a site is ecommerce.
Top ecommerce platforms
Our analysis detected 215 ecommerce platforms, a 48% increase in platforms compared to the 145 that were found last year. Despite this, only 10 platforms have greater than 0.1% usage on either desktop or mobile.
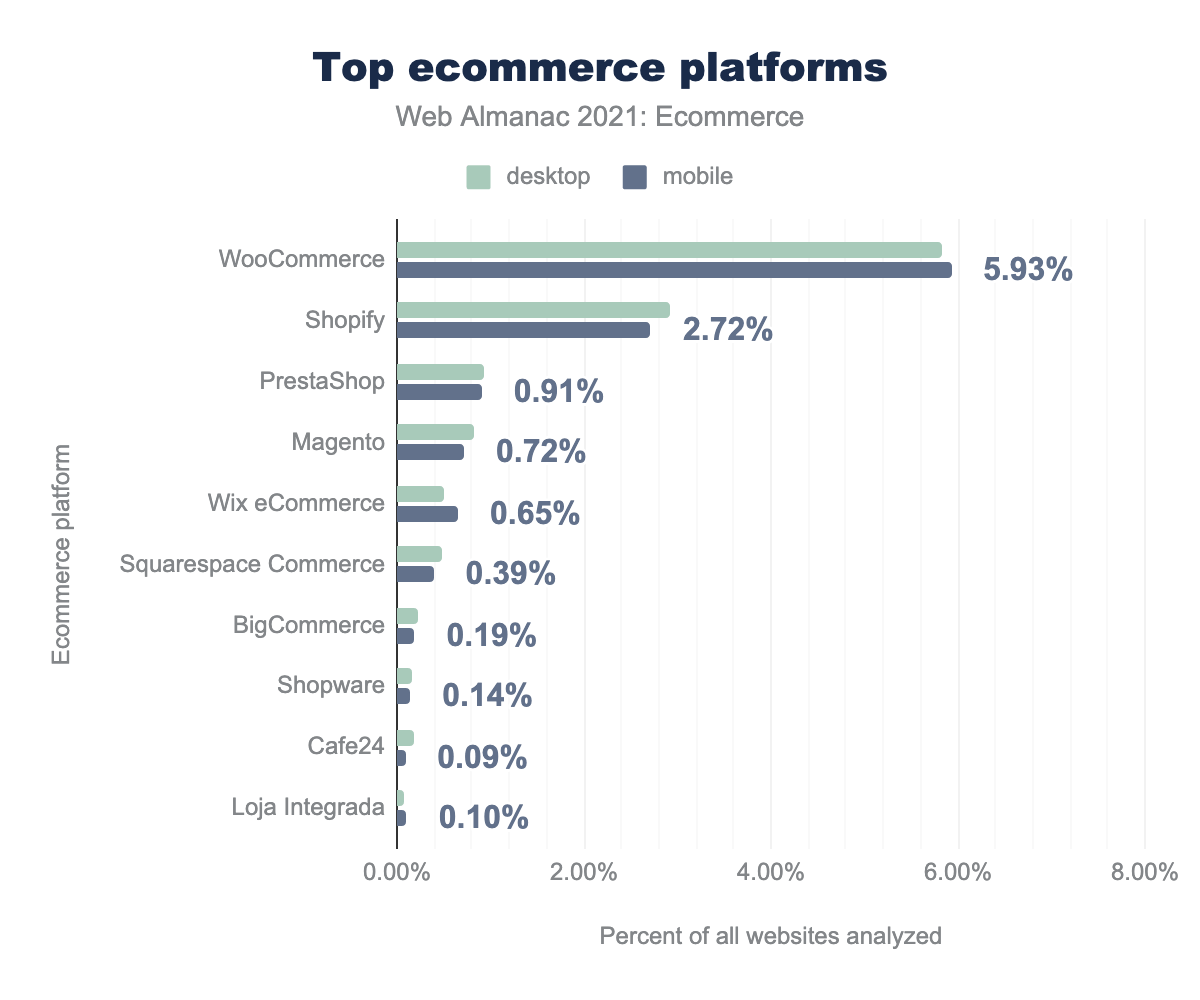
WooCommerce, a plugin for WordPress, is the most prevalent ecommerce platform with almost 6% of all websites using it. This represents 30% of the ecommerce market on mobile.
Shopify, a SaaS solution, is the second most popular solution with approximately half as many websites as WooCommerce. It has a 14% share of the ecommerce market on mobile. PrestaShop is an open-source platform and is the third most used platform at around one-sixth the prevalence of WooCommerce.
4 of the top 10 platforms have open-source and self-hosted editions: WooCommerce, PrestaShop, Magento, and Shopware. We do not detect different versions of platforms, and so cannot distinguish between the open-source and commercial versions of Magento and Shopware.
6 of the 10 platforms are SaaS (or have SaaS versions): Shopify, Wix eCommerce, Squarespace Commerce, BigCommerce, Shopware, and Loja Integrada.
Note: There was an issue with the July 2021 HTTP Archive data which resulted in the number of OpenCart sites being under-reported. It is worth acknowledging that in the September results 10,801 OpenCart sites were detected. If a similar number of OpenCart sites were to have been detected in July, it would put it in between BigCommerce and Shopware in terms of popularity.
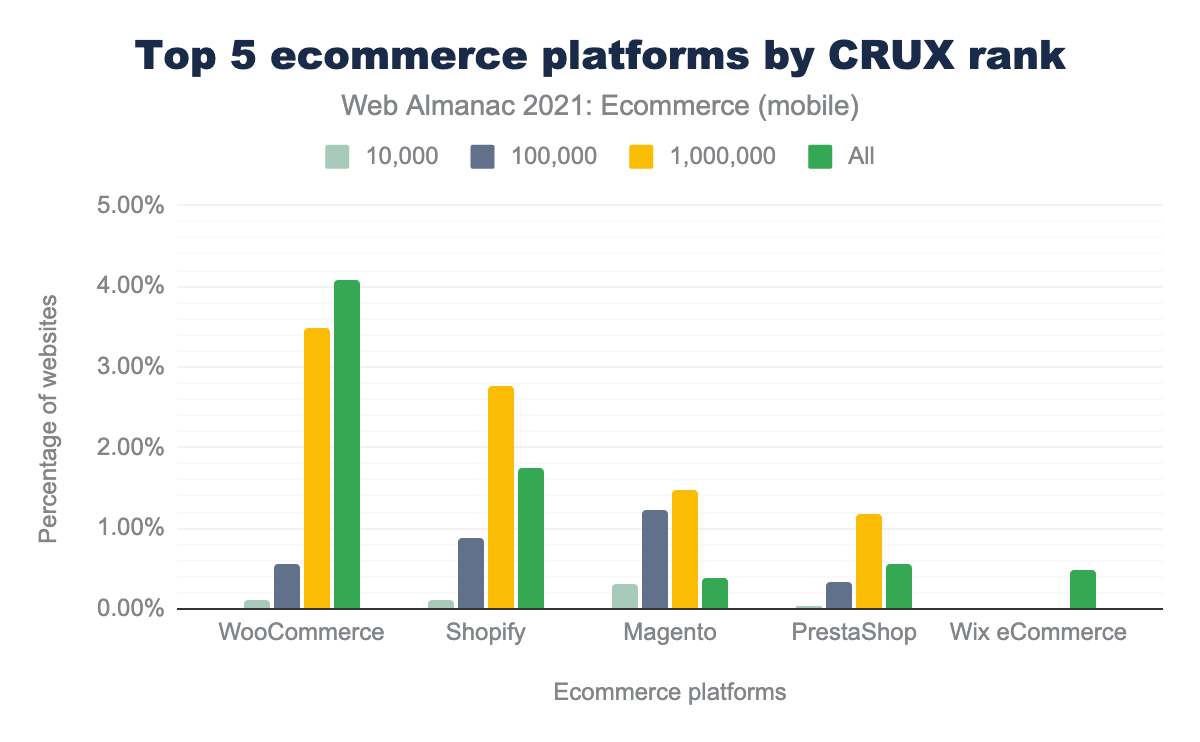
Top ecommerce platforms by website popularity
This year, the Chrome User Experience Report provided a popularity rank for each website. This allowed us to break down top ecommerce platforms by their popularity in different segments of the market. “All” refers to all 7.5 million sites that were profiled on mobile and 6.3 million sites for desktop.
With websites ranked, we can make observations on how platform popularity changes in different segments of the market:
- WooCommerce is the most popular ecommerce platform overall and in the top 1 million.
- Shopify is more popular among websites that are in the top 1 million (as a percentage) compared to all sites analyzed.
- Magento is the most popular of the five shown amongst the top 10,000 sites.
- No Wix eCommerce sites were identified in the top 100,000. Only 164 on mobile were identified in the top 1 million. Almost the entirety of the Wix eCommerce footprint was on sites ranked lower than 1 million.
Top 1 million sites
Another way to look at the results is to consider the most popular platforms within each tier of rankings. We expected to see different trends among the top tier e.g., top 10,000 sites compared to those within the top 1 million sites.
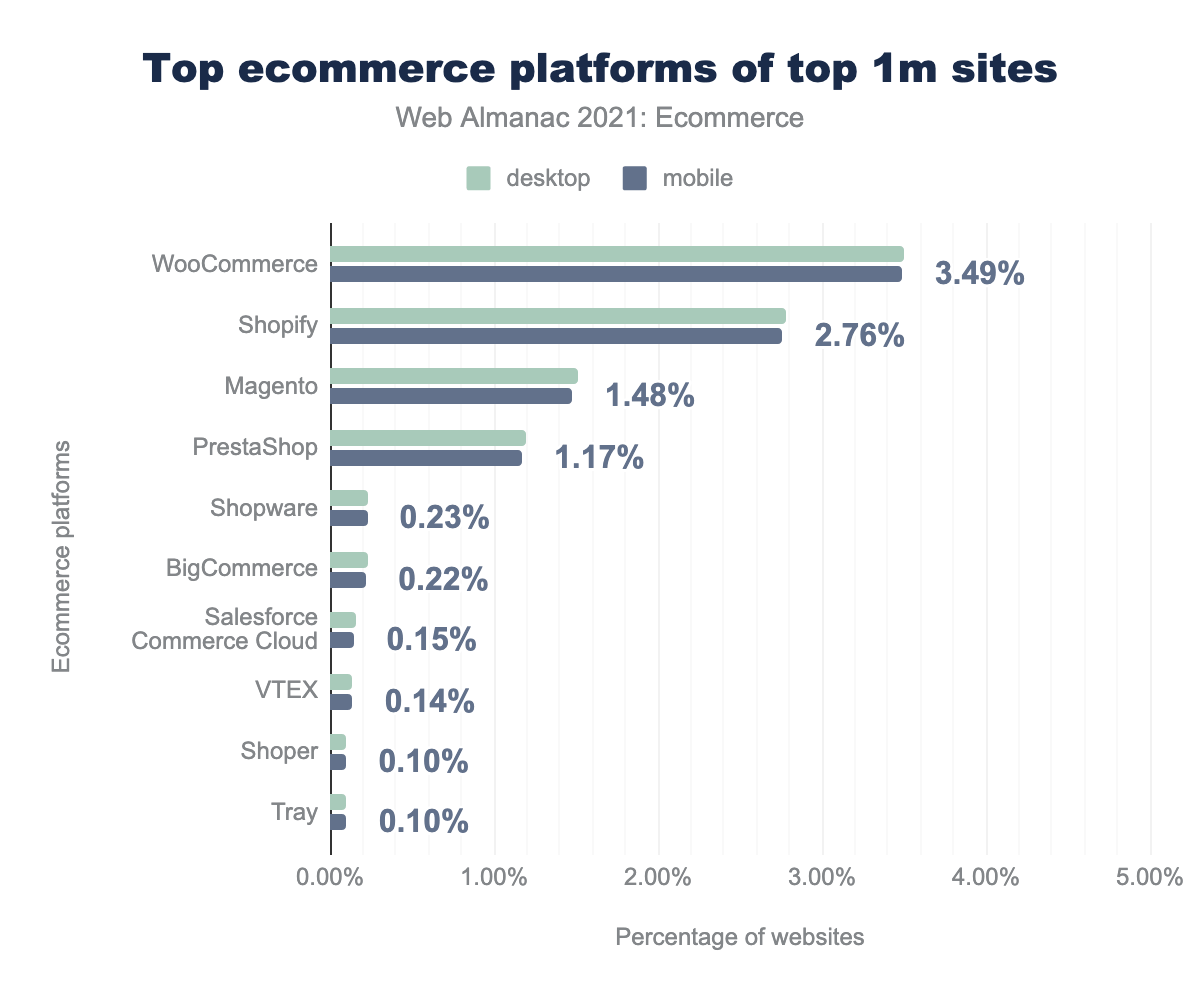
In the top 1 million sites, WooCommerce and Shopify are still the leading platforms with 3.49% and 2.76% of requests on mobile respectively. However, there’s a much smaller gap between them when compared to all sites analyzed. Among all site requests on mobile, WooCommerce was over twice as common as Shopify whereas in the top 1 million it’s only 25% more prevalent.
We also see Magento take the third spot over PrestaShop. Wix eCommerce and Squarespace ecommerce are no longer in the top 7 platforms. Instead, we see Shopware, BigCommerce, and Salesforce Commerce ahead of them.
Top 100,000 sites
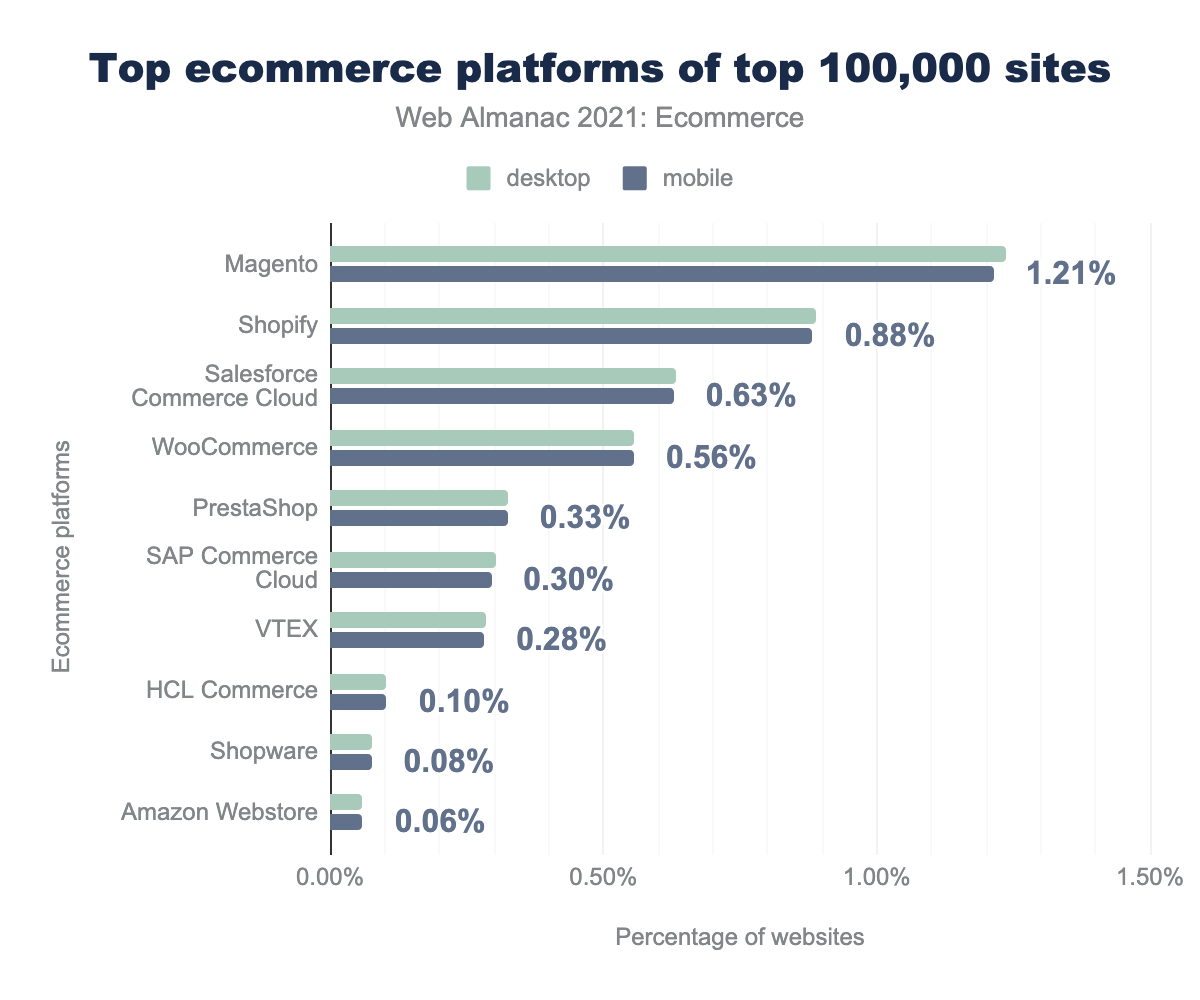
When we consider the top 100,000 sites by CrUX rank the picture changes quite drastically. Magento is now the most popular ecommerce platform vendor with 1.21% of mobile sites. Shopify maintains second place (with 0.88%) while Salesforce Commerce Cloud is third (0.63%). SAP Commerce Cloud rises up the leaderboard to sixth place to show that the enterprise platforms are more competitive in this space.
Top 10,000 sites
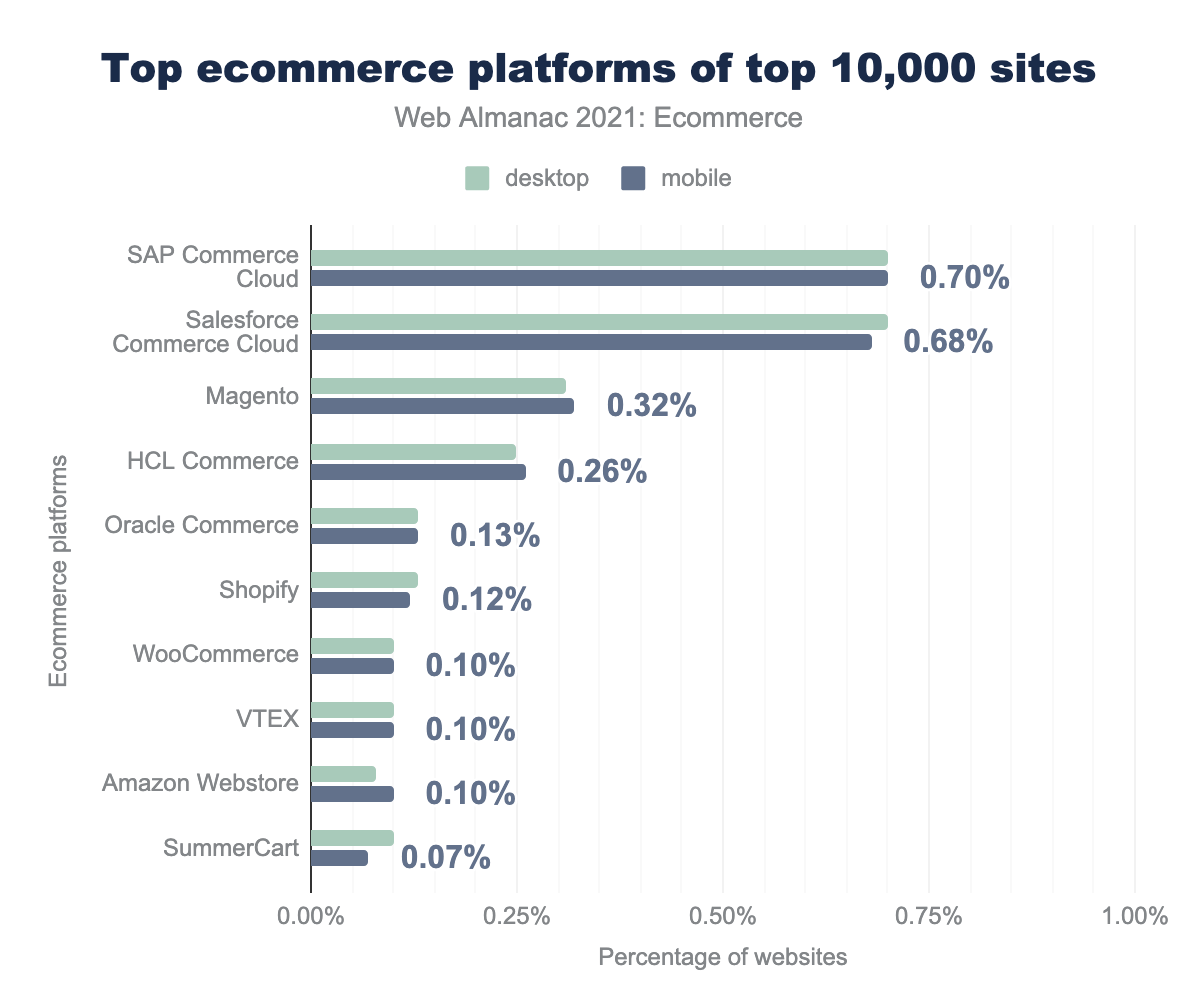
The share of sites that are powered by an ecommerce platform in the top 10,000 sites is noticeably smaller.
Salesforce Commerce Cloud and SAP Commerce lead and power a similar number of ecommerce sites (0.70 and 0.68% respectively on mobile).
As we continue down the leaderboard, there are few surprises in this space. Quite a way off the top two spots is Magento (an Adobe product) with 0.32% share of the top 10,000 sites. Following that is HCL Commerce (previously known as IBM WebSphere Commerce) and Oracle Commerce. All of these platforms are commonly considered to be well suited to larger enterprises.
The impact of COVID-19
It is hard to compare the total number of ecommerce sites found across years. As described earlier, this is because the ability to detect whether a site is ecommerce has been improved substantially. In part through the use of secondary signals such as Google Analytics Enhanced Ecommerce integration.
So instead, last year’s report focused on a small number of platforms to see how their use had changed. The early signs in the first half of 2020 were that there were measurable and notable increases in Shopify and WooCommerce use. The growth was in the region of 20% between January 2020 and July 2020 while other platforms like Magento did not see the same growth. These platforms are known for their low entry costs and ease of use, while Magento is not.
Fast-forward to 2021, people and businesses around the world have continued to adapt. Ecommerce in the US in 2020 saw revenue growth of 32.4% according to a report by the Commerce Department. In the UK, the Office of National Statistics reported a 46% growth.
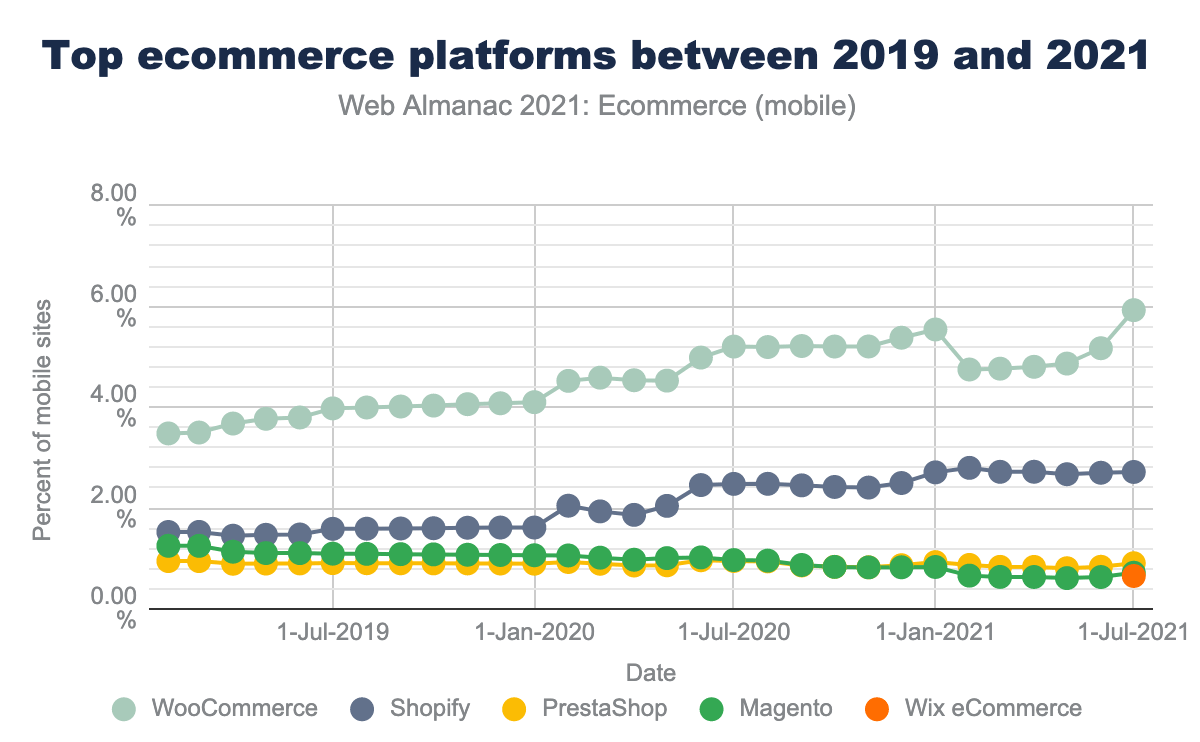
We can also look at results on a month-by-month basis between February 2019 and July 2021. However, before conclusions are drawn, it must be noted that sometimes platform detection issues are responsible for changes in market share. One specific issue was the drop in WooCommerce market share between February and June 2021 which was identified as a bug).
With that in consideration, we may still note that on mobile:
- WooCommerce has grown from 3.48% to 5.93%. The majority of this growth occurred immediately following the COVID-19 restrictions that Western countries put in place.
- The rate of growth for Shopify increased significantly during 2020, growing from 1.61% to 2.50% during that year. However, this growth rate has not been sustained.
- Also, during this time, we see Magento, who previously was competing with Shopify, drop below PrestaShop. Moving from 1.25% share of all sites to 0.72%.
In the author’s point of view, there was a rapid initial response by small businesses to add an ecommerce channel to their business. This was achieved mostly in the first half of 2020 through the use of cost-effective and easy-to-use platforms such WooCommerce and Shopify.
However, the vast majority of the increased online revenues reported is expected to have benefited those businesses that were already ecommerce-enabled.
Ecommerce user experience
The objective of an ecommerce site is to generate revenue. A company will adopt multiple strategies to fulfill this objective. At a high level, this might be to offer a feature-rich experience that considers a breadth of buying journeys. They will also want the website to be as fast as possible. It’s clear how both of these strategies work towards the objective but they can also work against each other at the same time.
Later, we will look at some of the tools & tactics that are used for creating a feature-rich experience.
First, we will evaluate site technical quality and performance. There is no single metric or tool that can be used to definitively gauge either one, so we drew on multiple:
- Google Lighthouse
- Core Web Vitals from Chrome UX Report
- WebPageTest
Lighthouse
One way of measuring the technical quality of a web page is with Google Lighthouse. A lighthouse test provides a score out of 100 for each of five categories. The figure below shows the median score for each category across all ecommerce websites requested.
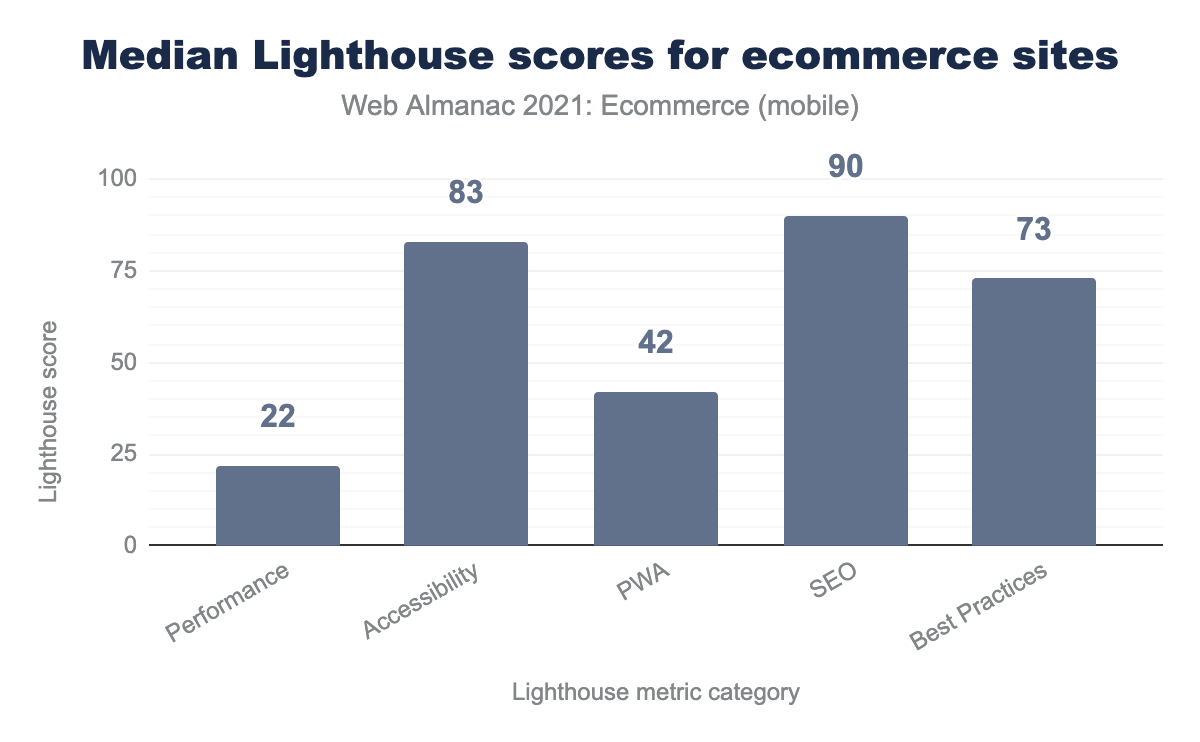
The most important point to note here is that ecommerce sites are struggling to achieve a good lighthouse score for performance. This may be because it takes a greater level of effort to achieve a good score in this category.
Lighthouse scores by platform
When we broke the Lighthouse scores down by ecommerce platform vendors, there was relatively little variation. This suggests that each ecommerce platform provides similar out-of-the-box capabilities in each of these areas.
Performance
Performance is an emergent system property; it is not something that you can implement as you would a new feature. It is something that has to be factored into everything you do. One simplistic view is that the more features that you add to your site, the slower it will be.
At the same time, it is now common knowledge that a faster site leads to a higher conversion rate. So why do we see such poor performance scores for ecommerce sites? One reason for this may be that the site speed and conversation rate statistics are always offered without any consideration for the decisions that ecommerce businesses face. When revenue growth is required every year, even the law of diminishing returns says that conversion rate improvements cannot only be met through speed gains. This, together with the high consumer demands on the ecommerce experience leads to a situation where more features become the priority.
What’s more, there is often more nuance to the decision to include a feature. For example, do the benefits of a live chat widget outweigh the performance impact? Does the answer change depending on the context? Should you wait for a developer to install it to ensure that it’s lazy-loaded or just use Google Tag Manager? What’s the opportunity cost of not using that development time for something else?
Another way of viewing performance is that it is a shared resource that suffers from the tragedy of the commons paradigm. It’s at its highest level at the start of a project and is depleted over time with requests from different stakeholders that all have a right to consume it.
The best results are likely to be found by those businesses that can find a balance between site speed and user experience. They will minimize the impact of features on the initial page load, while still being able to offer a great user experience.
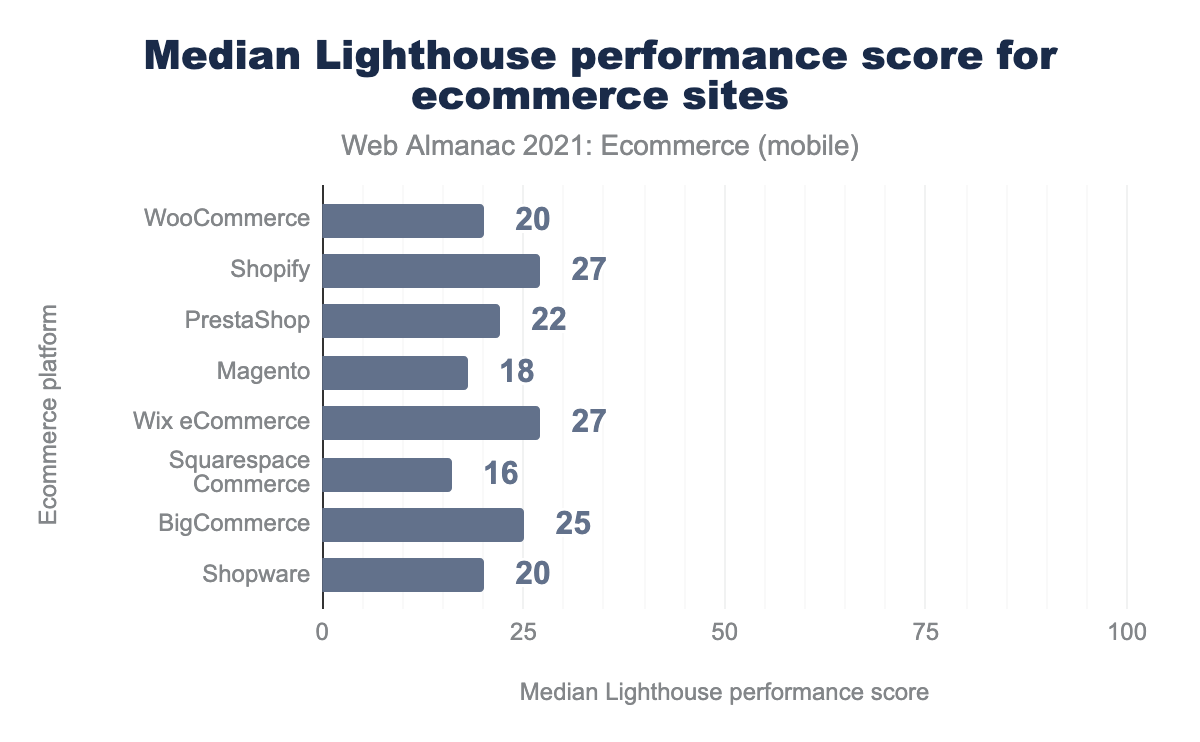
The most variation between platforms was found for the performance scores. Shopify and Wix eCommerce were the most performant with a median lighthouse performance score of 27/100 on mobile. The lowest scorers were Loja Integrada with 6/100, Squarespace Commerce with 16/100, and Magento with 18/100. To reiterate, these are all poor scores.
Shopify, to its credit, has recently added a requirement on all new marketplace themes to achieve an average Lighthouse performance score of 60/100. It will be interesting to see how this affects their results in future analyses.
Accessibility
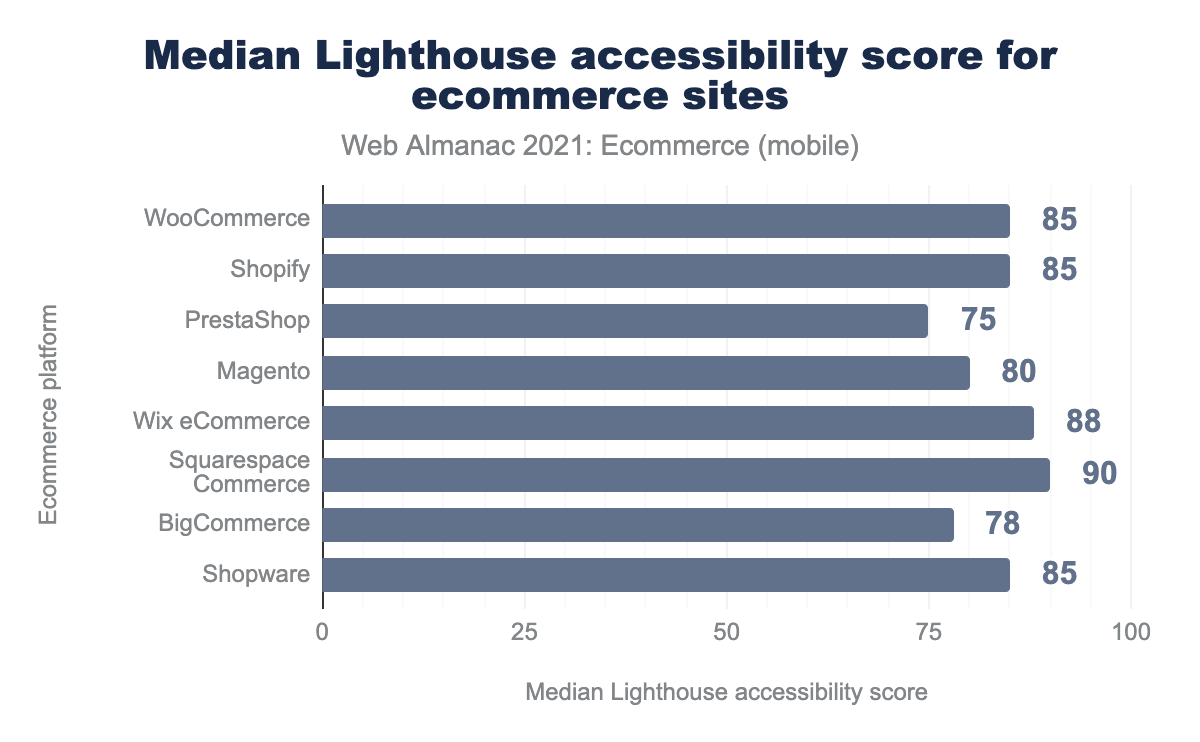
The top 8 platforms score very similarly on the median accessibility metric. We also expect them to improve further as accessibility legislation and awareness increases.
Improvements may come from platforms increasing the accessibility of their standard themes. BigCommerce, for example, has updated the default theme to meet Website Content Accessibility Guidelines (or WCAG) 2.1 Level AA standards.
Platforms can also encourage the wider app and theme communities to provide a high standard of technical quality. Shopify announced a minimum Lighthouse accessibility score requirement for any new marketplace themes.
For more detailed research on accessibility scores across the web, read the Accessibility chapter.
PWA
It appears that PWA support is not a priority for all ecommerce businesses. We might consider two reasons why this may be the case:
- There’s little research into the consumer adoption of PWA features such as adding to their home screen.
- Safari on iOS does not support the Push Notification API or the ability to add a PWA to the home screen. The significant size of the iOS market share reduces the payoff of investing in PWA.
Best Practices
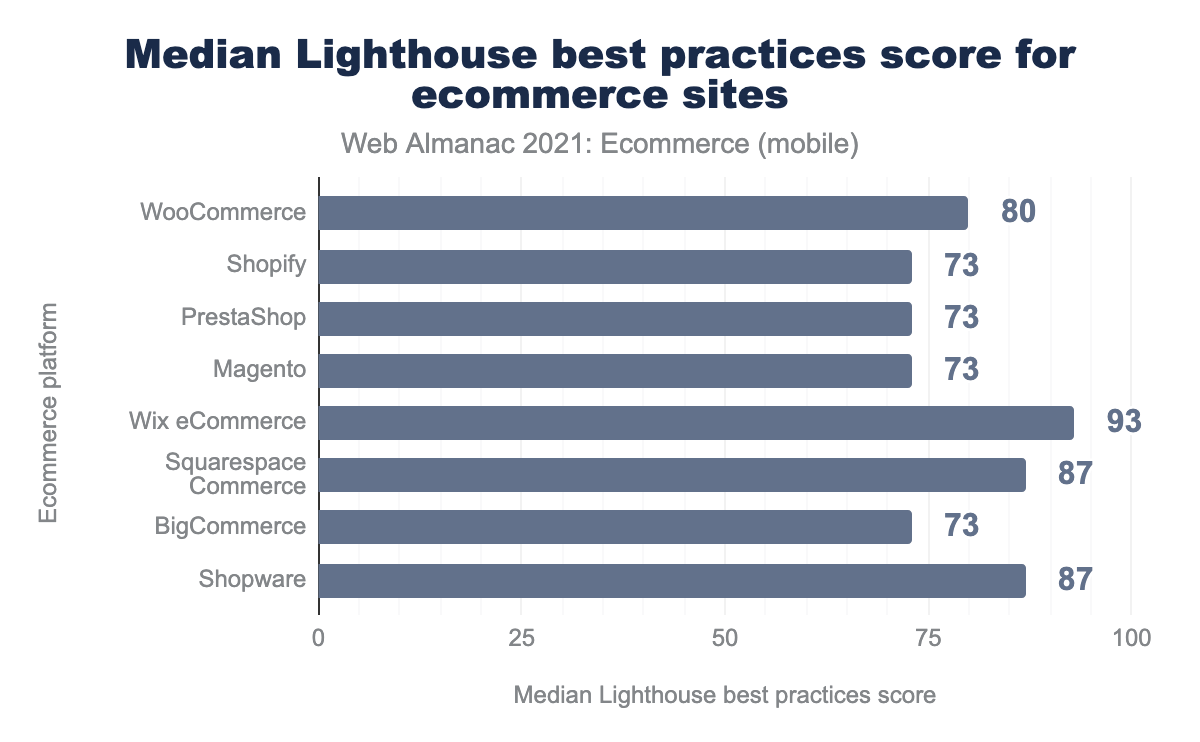
Wix Ecommerce achieves the highest median Lighthouse best practice score with 93/100. While it is focused on small businesses and therefore may, on average, provide a simpler user experience it is impressive that it scores so highly.
Core Web Vitals
In 2020 Google started an initiative under the term Core Web Vitals (CWV) which looked to help website owners and developers focus on three performance metrics that are critical for a good user experience. These metrics are:
Large Contentful Paint (LCP)
- Measures loading performance. To provide a good user experience, LCP should occur within 2.5 seconds of when the page first starts loading.
First Input Delay (FID)
- Measures interactivity. To provide a good user experience, pages should have an FID of 100 milliseconds or less.
Cumulative Layout Shift (CLS)
- Measures visual stability. To provide a good user experience, pages should maintain a CLS of 0.1. or less.
As Core Web Vitals are now ranking factors in Google’s search algorithm they have gained increased attention from ecommerce businesses.
The Chrome User Experience report enables the collection of these metrics from real users. We can therefore consider the results to be more accurate compared to traditional “lab” tests which simulate a page load in a controlled environment.
In this section, we will review sites that have reached a “good” threshold on all three metrics: LCP, FIP, and CLS.
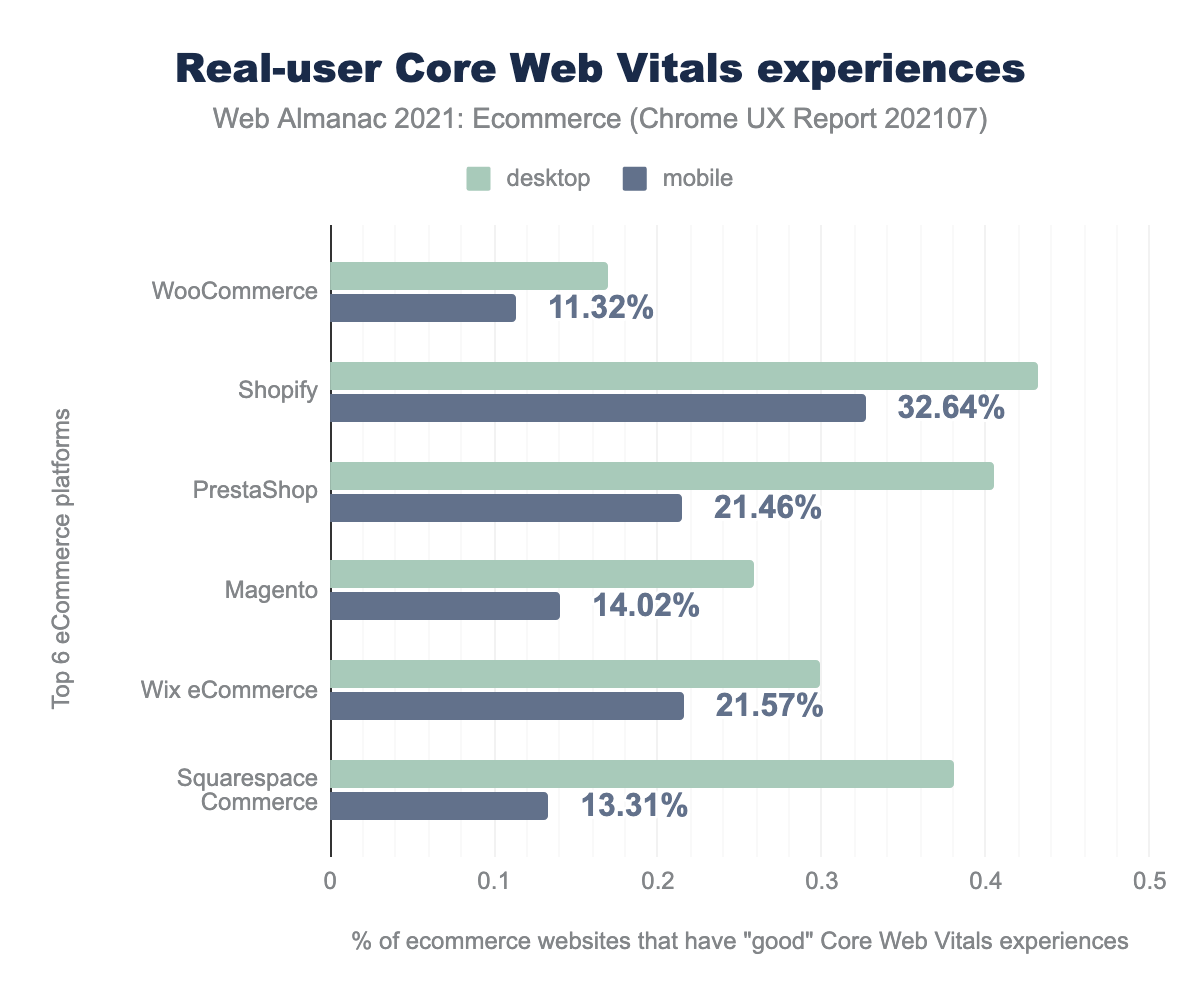
Looking at the percentage of sites that have a “good” experience according to CWV by platform, we find that Shopify performs the best with 32.64% on mobile. Whereas only 11.32% of mobile sites on WooCommerce achieve a good experience.
We can compare this to the wider web by looking at the results from the Performance chapter. It found 41% of sites on desktop and 29% of sites on mobile achieved a “good” CWV experience. With this lens, we can say that on average a Shopify store performed better than the average site based on mobile sites, and a WooCommerce site worse. However, it is important to point out that this is correlation rather than causation.
Compared to last year we see an improvement in median CWV scores across all platforms. We find the largest performance improvement was for sites on Shopify. Increasing from 21.24% of sites on mobile having a good CWV experience to 32.64%.
One final point to make is that the percentage of sites achieving a good CWV experience is not correlated with whether a platform is SaaS or self-hosted.
In the next section, we will consider each CWV metric independently to see whether what is the largest contributor to poor site performance on each platform.
Largest Contentful Paint (LCP)
Firstly, there is the Largest Contentful Paint which uses the time it takes for the main page content to be loaded as a proxy for how long it takes for the page to be useful.
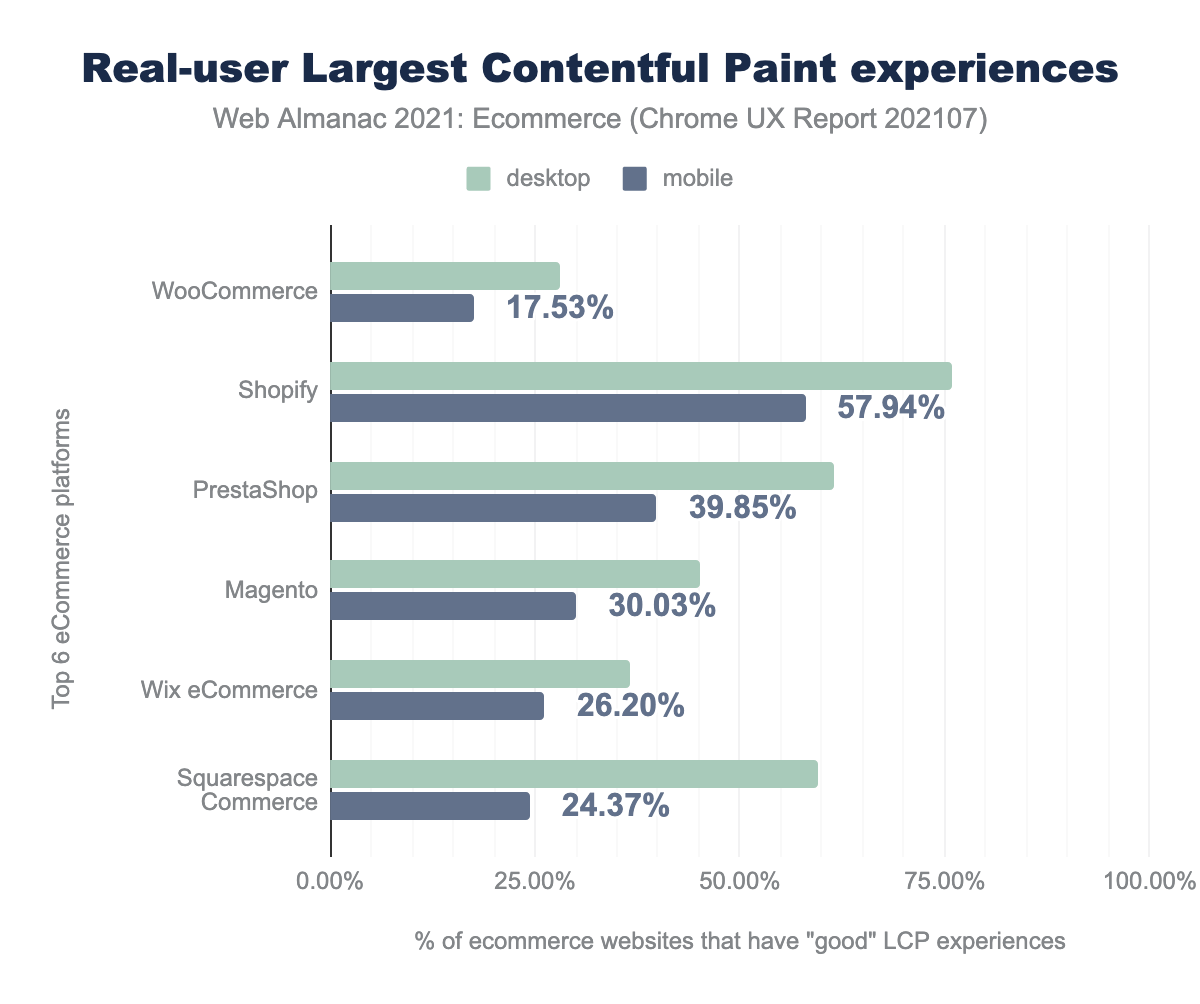
Shopify again leads the pack of top ecommerce platforms with 57.94% of Shopify sites on mobile achieving a good LCP experience. Sites that use WooCommerce performed the worst with only 17.53% achieving a good experience. This metric in particular appears to be the largest contributor to WooCommerce poor overall CWV score.
Across the wider web, the Performance chapter found 45% of mobile sites had a good LCP experience. Only Shopify of the top 6 most popular ecommerce platforms achieved better than the average of all sites requested on mobile.
Out of the three CWV metrics, the hosting setup primarily only affects the LCP score. So, at this point, it is worth comparing platforms that are commonly self-hosted against SaaS platforms where infrastructure is managed and optimized by the vendor. We can see that Shopify as a SaaS leads the other platforms. However, the other two SaaS platforms listed, Wix eCommerce and Squarespace Commerce, perform worse on mobile compared to popular self-hosted platforms Magento & PrestaShop.
First Input Delay (FID)
The second metric, First Input Delay, measures how much work the browser has to do once a website visitor interacts with the site, e.g., clicks on a link or button. It can be seen as a proxy for how responsive the site feels or whether it feels laggy and slow to react to user input.
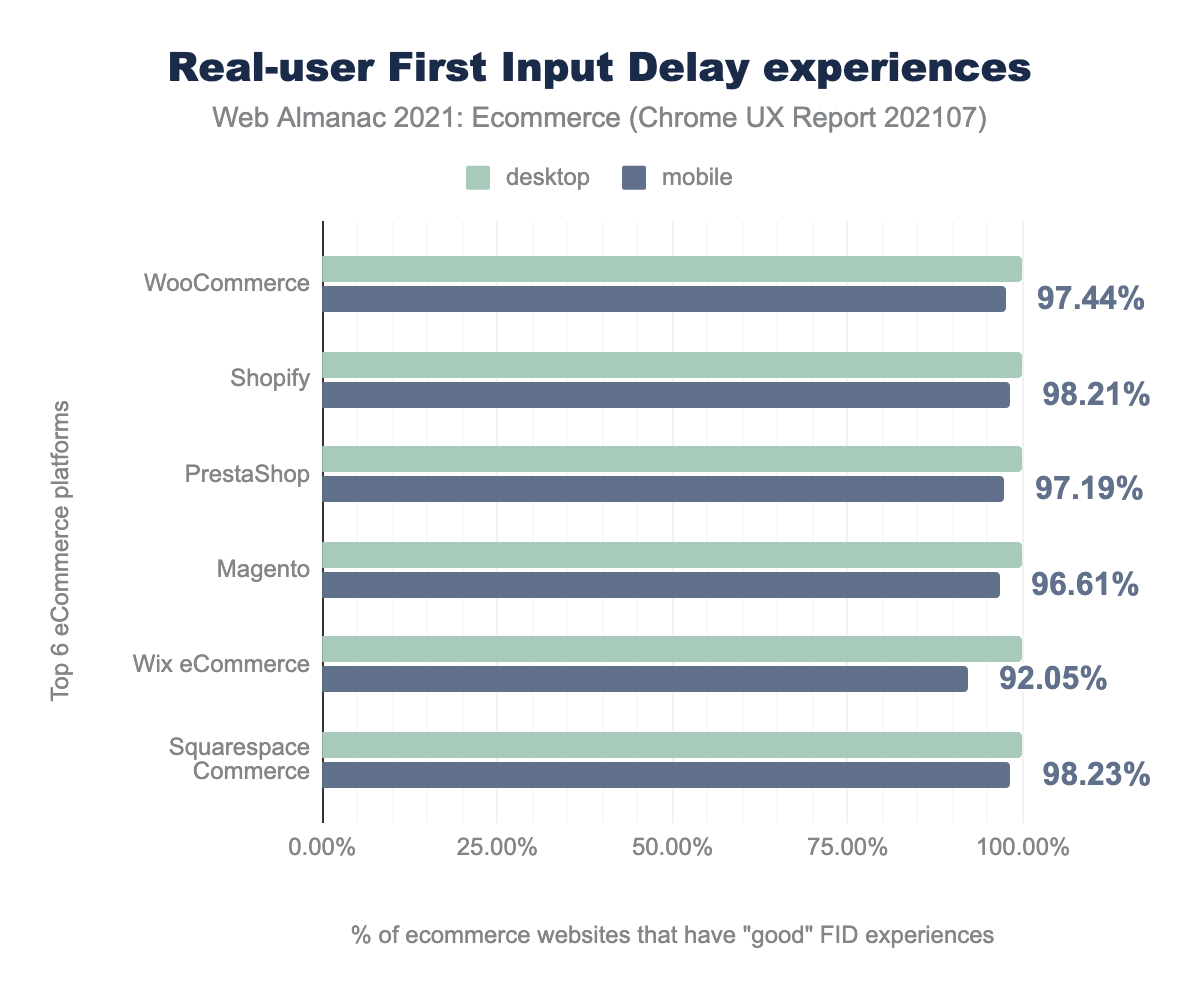
Sites on all of the top ecommerce platforms performed well on this metric. On desktop, most of the ecommerce platforms surveyed achieved 100% good FID experience. On mobile, we start to see some poor experiences, but the vast majority achieve a good FID experience. Shopify (98.21%) and Squarespace Commerce (98%) perform the best of the top ecommerce platforms with WooCommerce, PrestaShop, and Magento only slightly behind with 98%.
Wix eCommerce is a platform that we’ve typically seen perform well but FID is one area it falls down on with only 92.05% of its websites having a good FID experience.
That being said, all six perform better than non-ecommerce sites. The Performance chapter found that 90% of all sites on mobile achieved a good First Input Delay experience.
Cumulative Layout Shift (CLS))
The final of the three CWV metrics is Cumulative Layout Shift. It is a measure of the amount that items on the page “move around”, e.g., a new image appears and pushes the text you were reading or the button you were about to click to a different place.
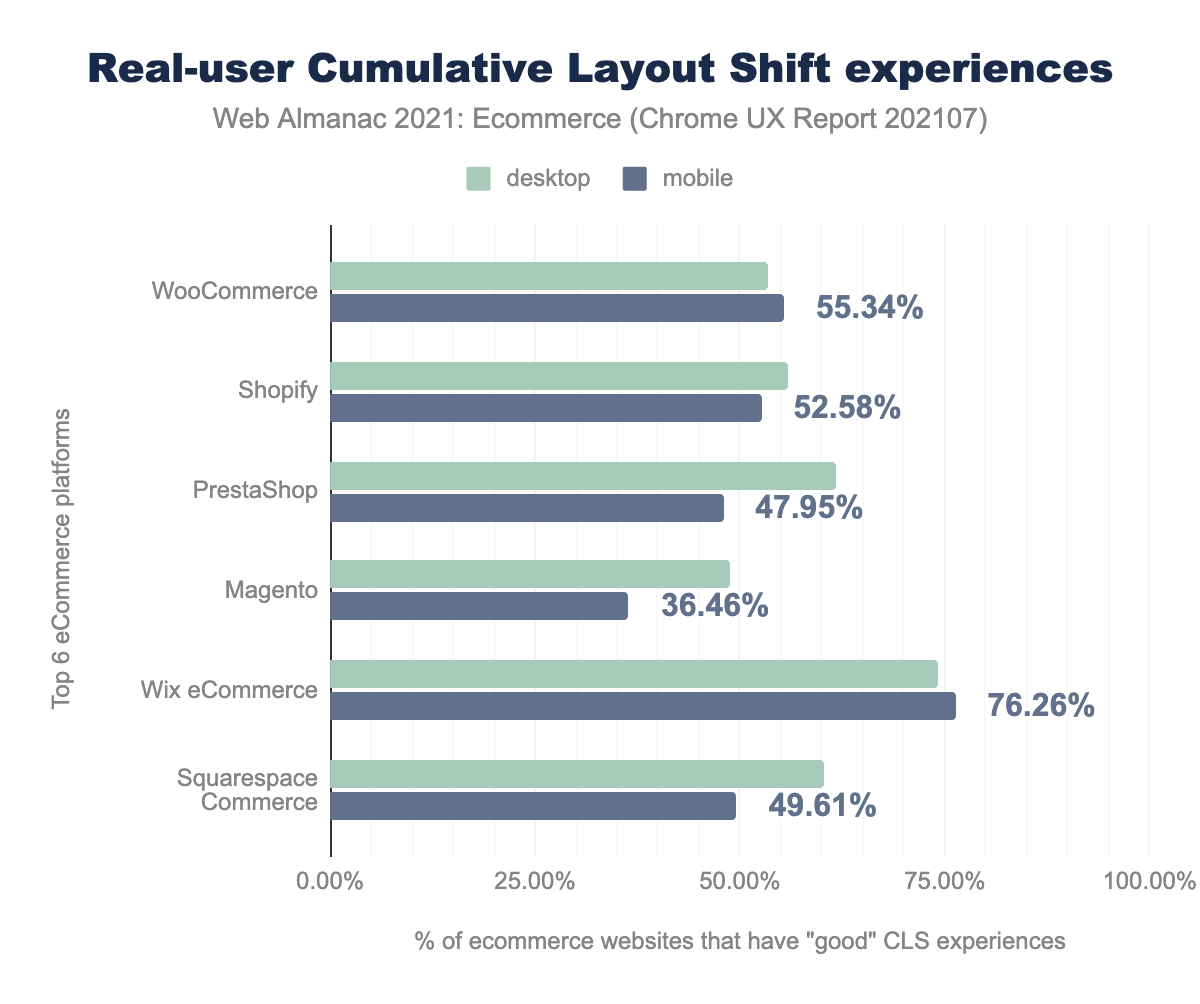
Of the top platforms, Wix eCommerce outperforms all with 76.26% of mobile sites on the platform achieving a good Cumulative Layout Shift Experience. Whereas less than half as many visitors have a good experience on Magento sites (36.46%).
Comparing these ecommerce sites metrics to the wider web, we see that the top ecommerce platforms perform slightly worse. The Performance chapter found 62% of sites (on mobile and desktop) had a good CLS experience.
Page anatomy
When it comes to understanding the reasons behind a site’s performance, some of the first things that you will look into are the page weight (the number of kilobytes that need to be downloaded), and the number of requests required to load the page.
Page requests
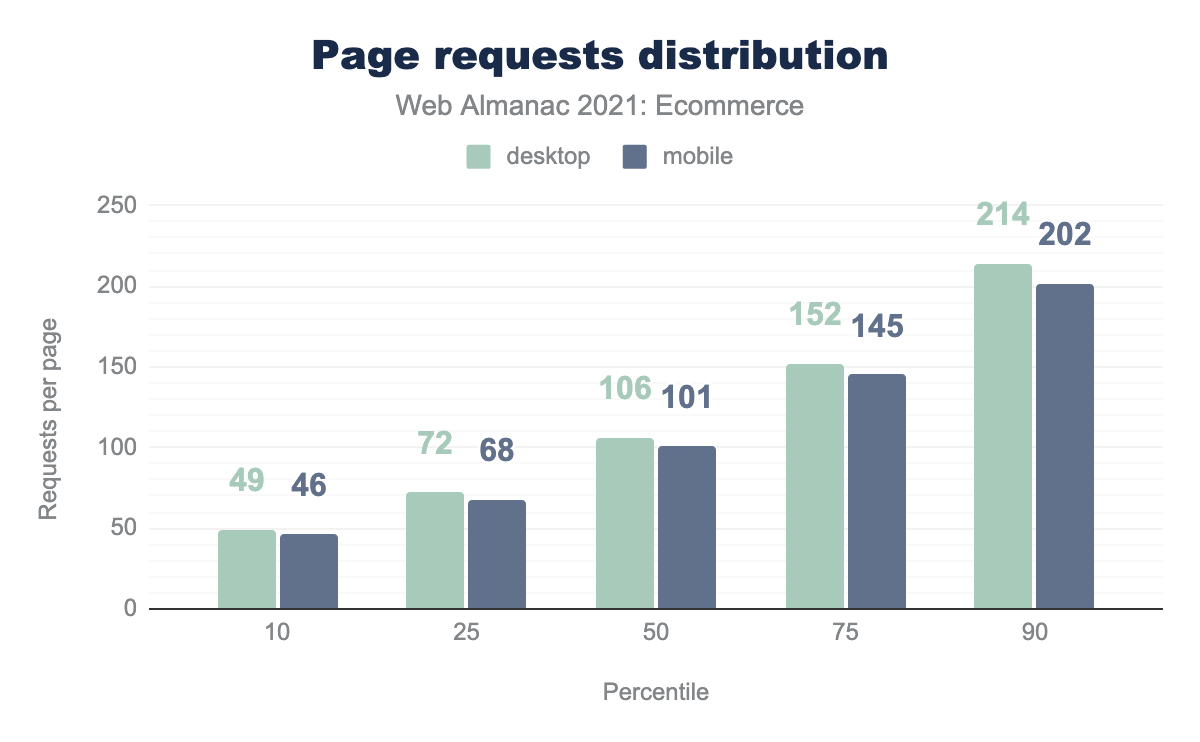
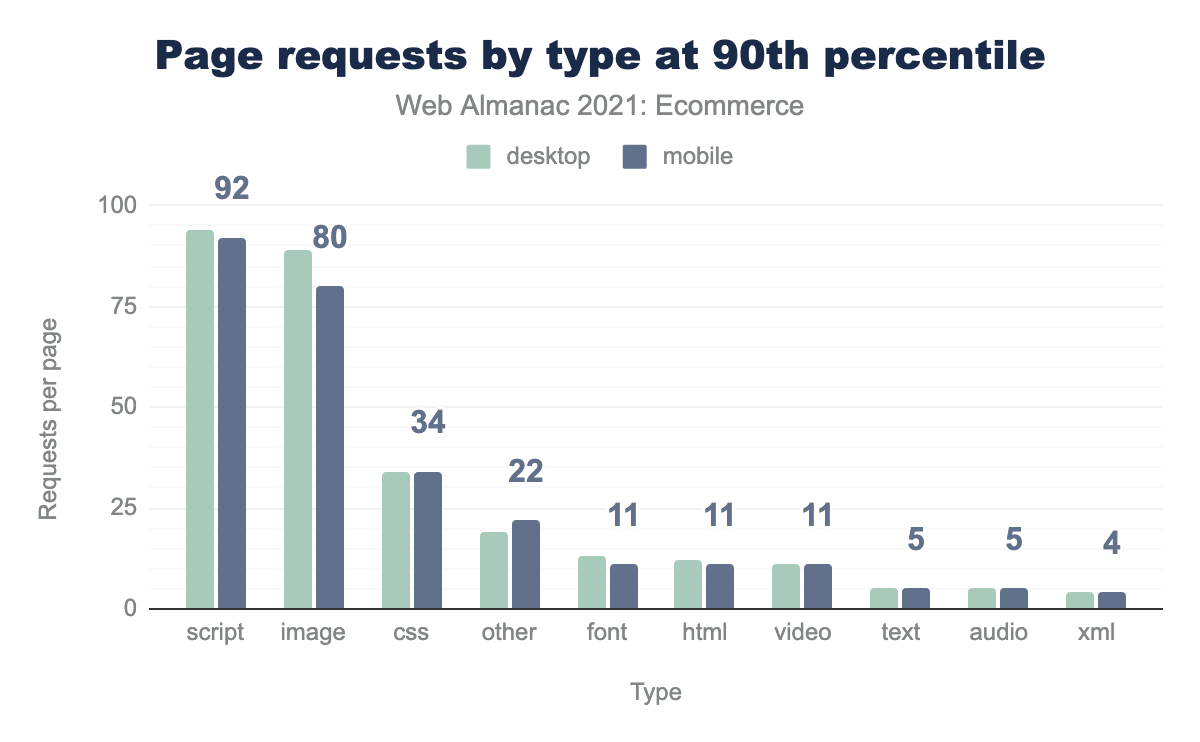
The 50th percentile of all ecommerce sites had 101 requests on the homepage on mobile. This is a very similar number to the 98 requests that were found last year. The number of requests per page is very similar across all percentiles when compared to last year.
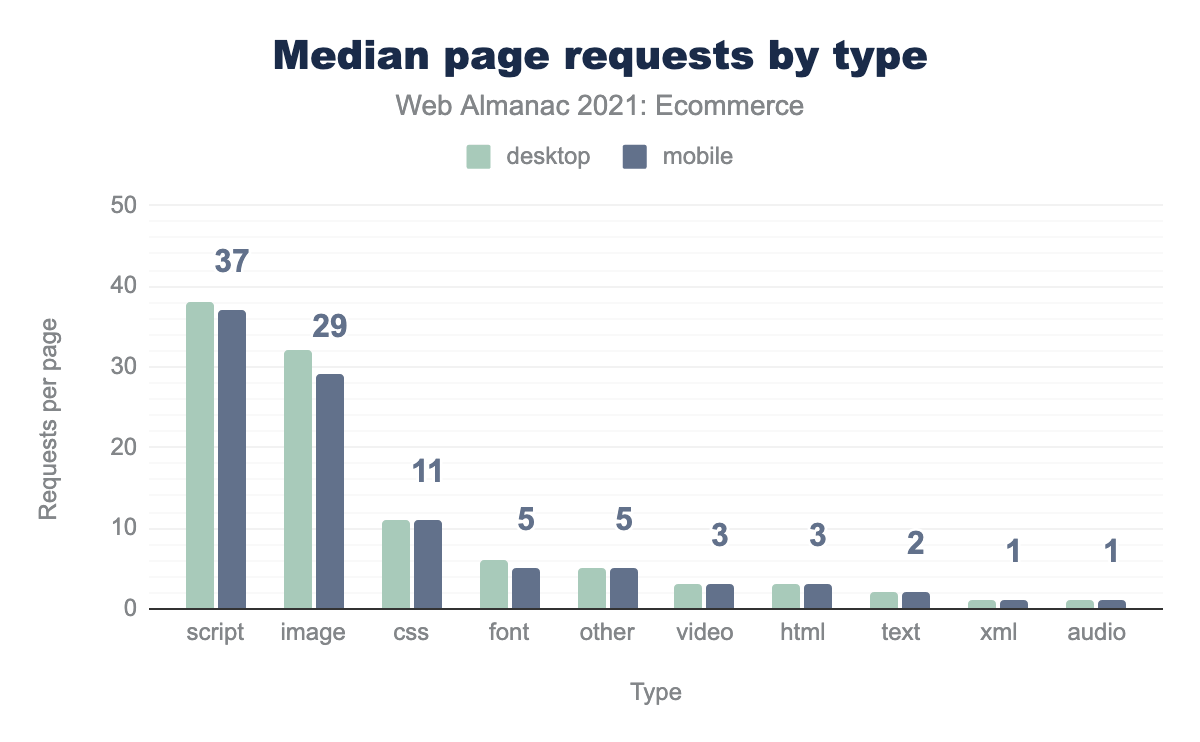
Breaking these requests down by type and we can see that JavaScript is the most popular resource to be requested with 37 requests on an average ecommerce mobile homepage. This is a 23% increase from last year where there were 30 JavaScript requests per page. Previously images were the most requested resource with 34 requests per page on mobile, but this is down slightly to 29 requests.
Page weight
The page weight of a site includes all HTML, CSS, JavaScript, JSON, XML, images, audio, and video.
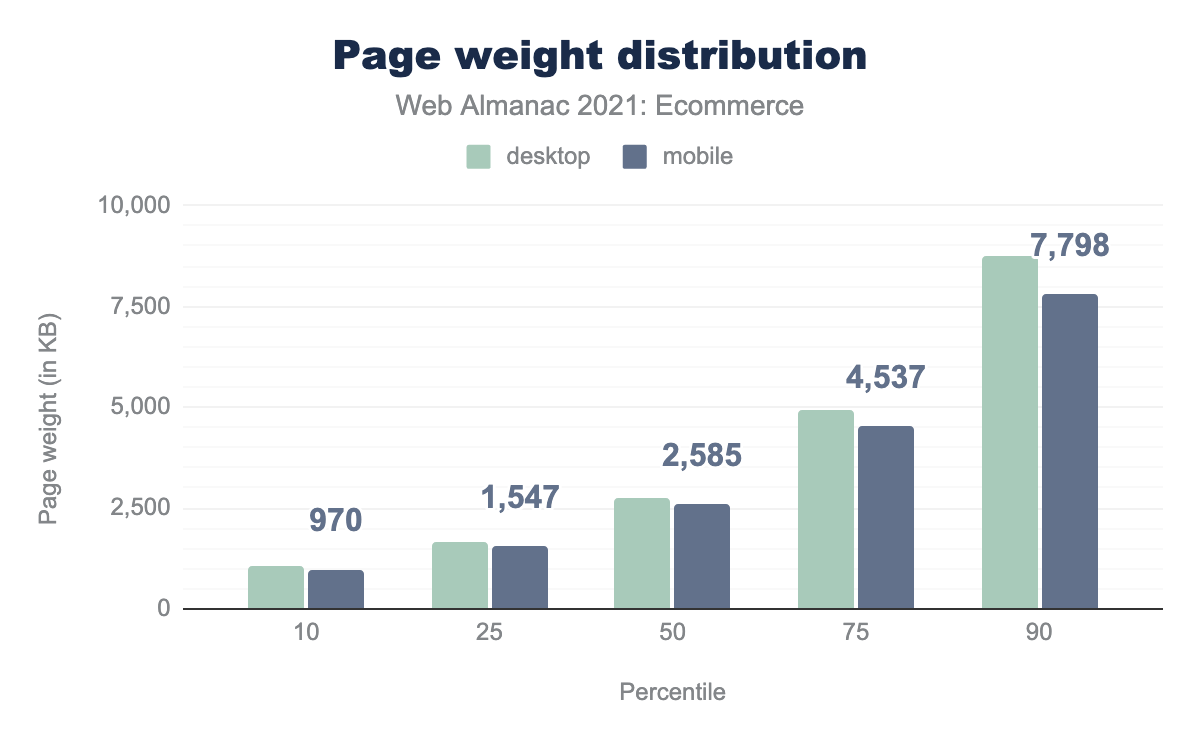
The median page weight of ecommerce homepages was 2.5 MB on mobile. This figure is the same as last year’s results, so on average homepages are not getting heavier (or lighter).
The heaviest sites (90th percentile) are 4% heavier than 2020’s results so the worst offenders have gotten slightly worse.
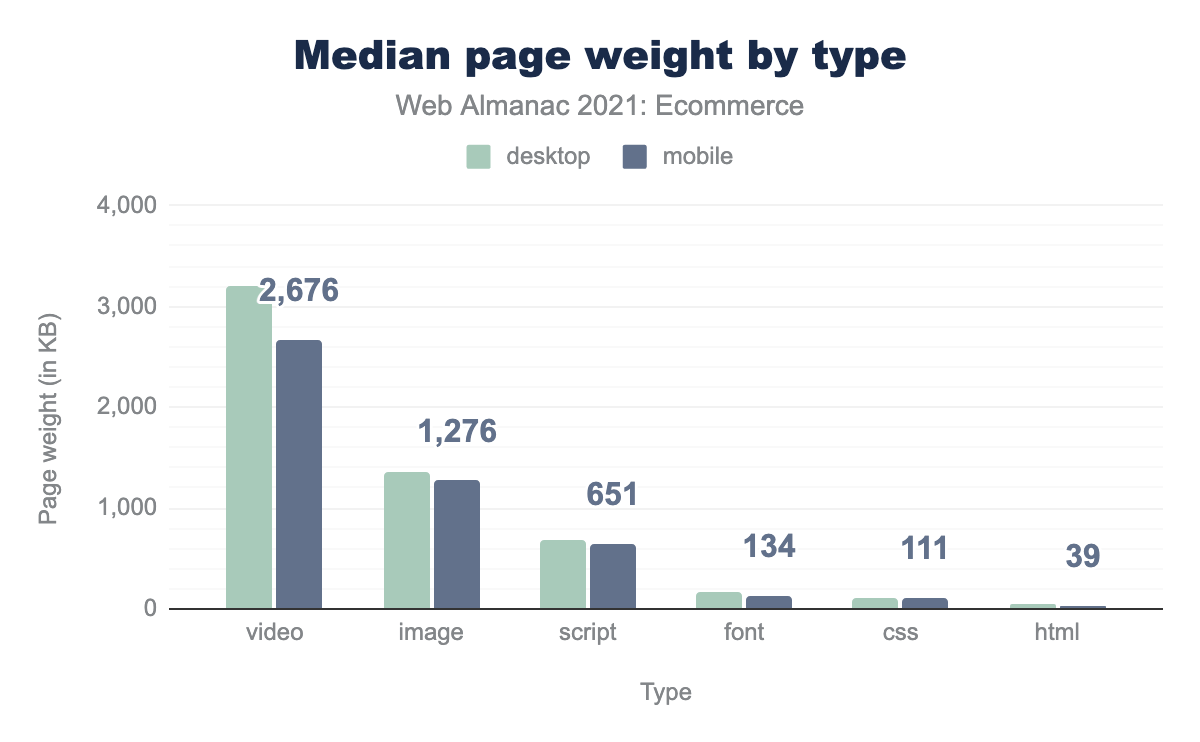
To better understand why this might be, we can look at the page weight by resource type. Video is the heaviest resource with 2.6 MB on mobile sites, followed by images (1.2 MB) and JavaScript (0.6 MB). Compared to last year we see a 24% increase in the number of MB of video loaded. Meanwhile, the MBs for all other resource types are steady.
This suggests that the heaviest sites may be those that use video which can quickly increase the overall page weight quite substantially. Given that the median page weight has not changed between 2020 and 2021, this would suggest that the number of sites using video has not changed, but of those that are, they are using it more. An opportunity for further research in this area would be to look at what has caused the video weight increase: are there more videos, are they longer, or higher quality?
We saw that the sites with the heaviest pages (17 MB on mobile) were much heavier than the median (4.8 MB). If we look at the page weight by type specifically at the 90th percentile and compare it with the 50th percentile we can see that the weight of all resource types has increased.
The largest contributors to page weight at the 90th percentile continue to be video with 9 MB and images (5.6 MB). It isn’t altogether surprising that the heaviest ecommerce homepages are those that use a large amount of video and images. This page is often content-heavy, and these resource types are the most effective way of communicating the brand. While video and images continue to be an important part of the buying experience, in the author’s point of view, other page types are unlikely to see these extremes quite as much.
HTML payload size
The HTML payload is the size of the document response. In addition to HTML, this may include inline JavaScript and CSS.
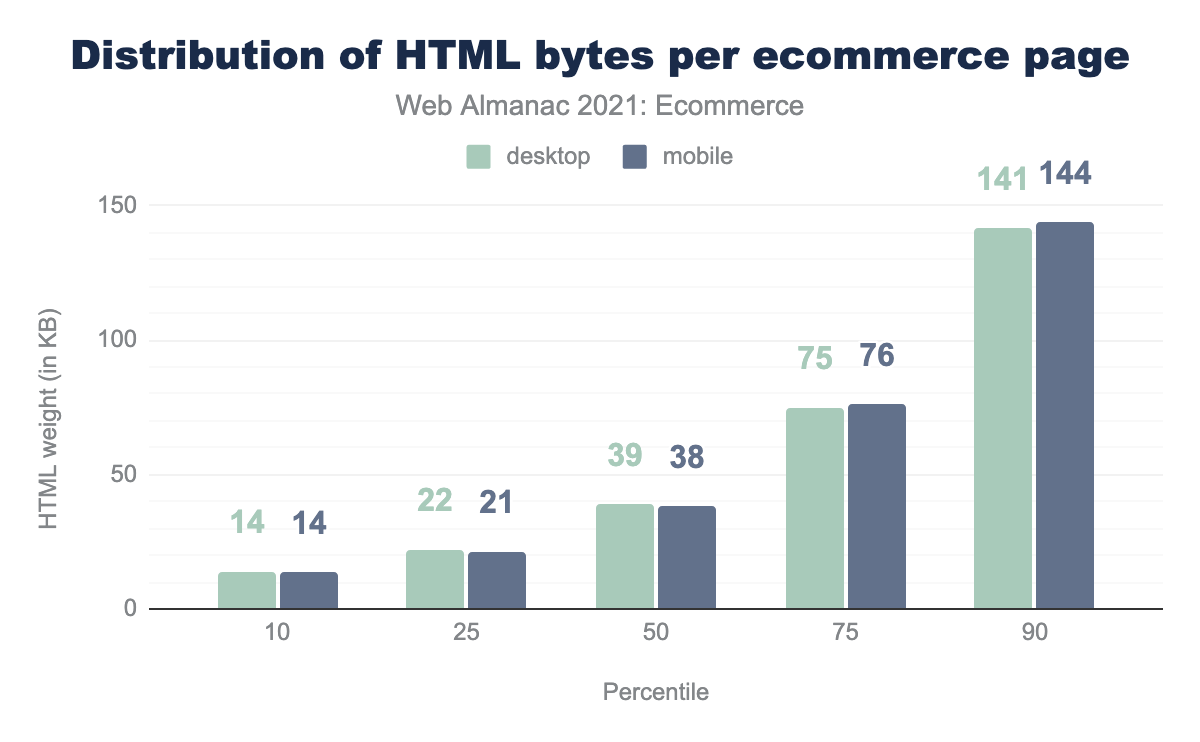
The median HTML payload was 38 KB on mobile and 39 KB on desktop. While at the 90th percentile, payloads were almost four times larger at 144 KB on mobile and 141 KB on desktop.
Payload size was broadly consistent across both mobile and desktop suggesting that sites are broadly delivering the same HTML to both device types.
Images
Images are the second most requested resource type as well as the second-largest contributor to page weight.
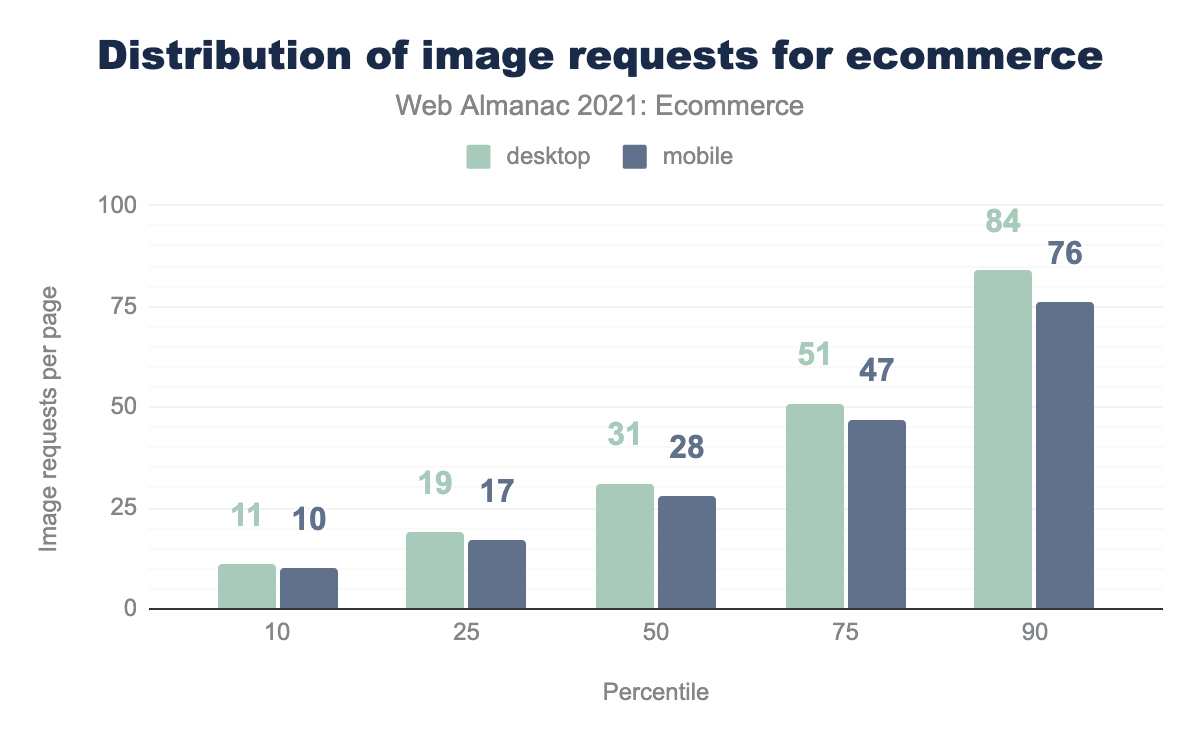
We see the median number of images requested on a mobile homepage is 28, while it is 31 on desktop. 10% of sites load 76 images on mobile, however, this is down from a high of 91 images last year.
Overall, there is a 10-20% reduction in the number of images requested. It is hard to provide a definitive answer, but it may be due to the increased adoption of the lazy loading attribute. As no scrolling or interaction with the site is performed during testing, any assets that are lazy-loaded will not be factored into measurements. Analysis by the JavaScript chapter did find that 17% of sites are using this attribute which gives some weight to this theory.
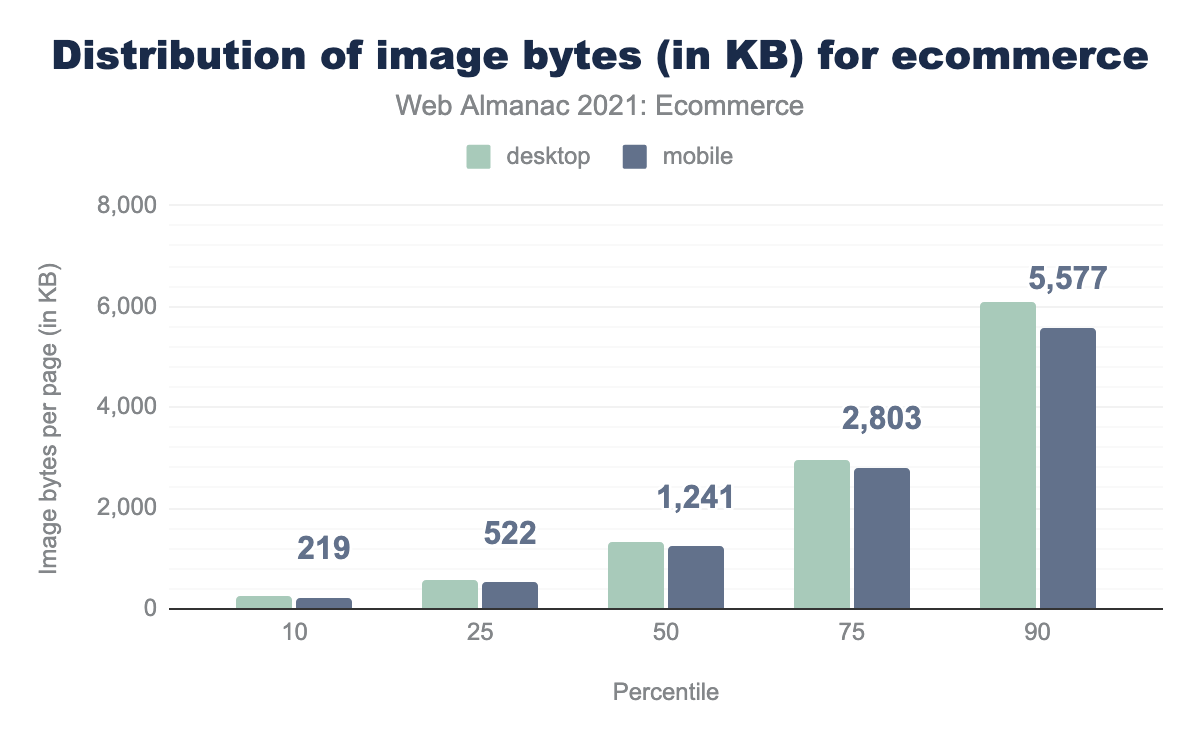
If we consider images by weight rather than count, we see a median page weight contribution of 1.2 MB (mobile). At the 90th percentile, this rises to 5.4 MB.
Overall, the weight of images on ecommerce homepages is very similar when compared to 2020’s analysis.
Given we have seen that the number of image requests is slightly down, the average weight of each image must have slightly increased.
Note that some image services or CDNs will automatically deliver WebP (rather than JPEG or PNG) to platforms that support WebP, even for a URL with a .jpg or .png suffix. For example, IMG_20190113_113201.jpg returns a WebP image in Chrome. However, the way HTTP Archive detects image formats is to check for keywords in the MIME type first, then fall back to the file extension. This means that the format for images with URLs such as the above will be given as WebP since WebP is supported by HTTP Archive as a user agent.
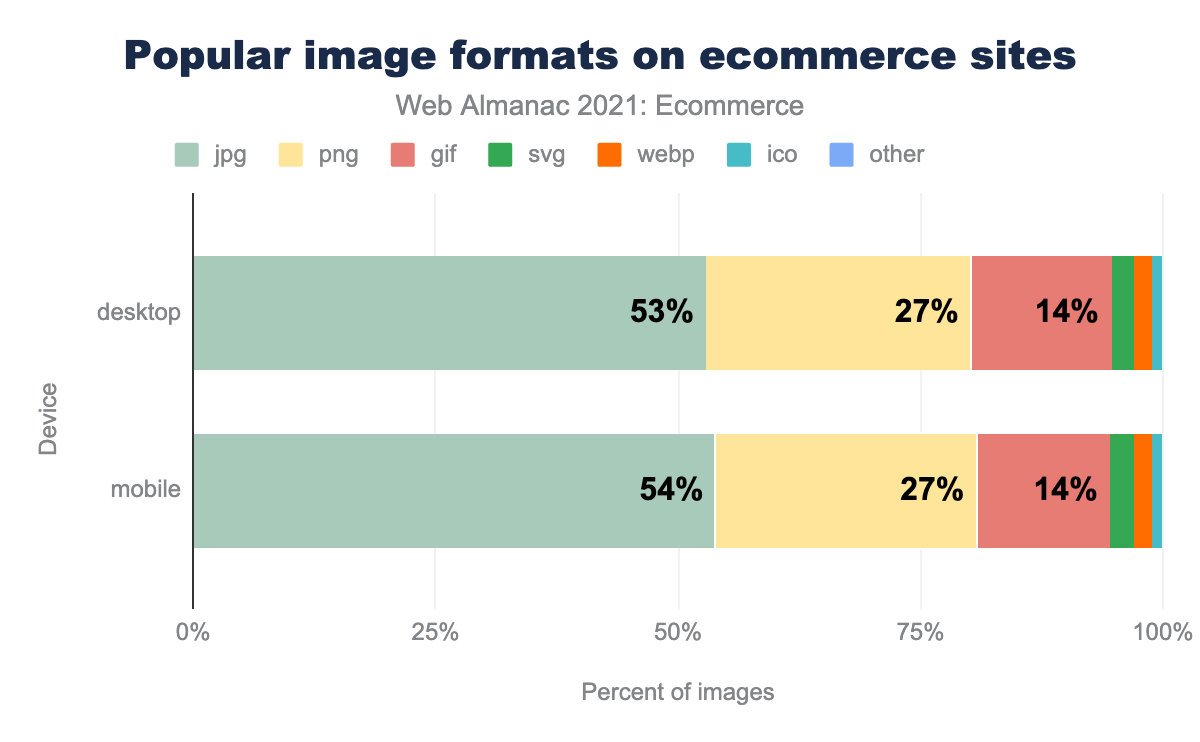
The most popular image format was JPG with 54% of images being in this format on mobile. This is an 8% increase on last year when 50% of images were JPGs.
27% of images were PNGs which is a similar proportion to last year. The use of other image types is broadly the same however GIFs have decreased from 17% to 14% on mobile.
Unfortunately, there is still a disappointingly low uptake on WebP support. This is despite it being a more file size efficient format, and is supported in all modern browsers.
Third-party requests
Ecommerce platforms and sites often make use of third-party content. We use the Third Party Web project to detect third-party usage.
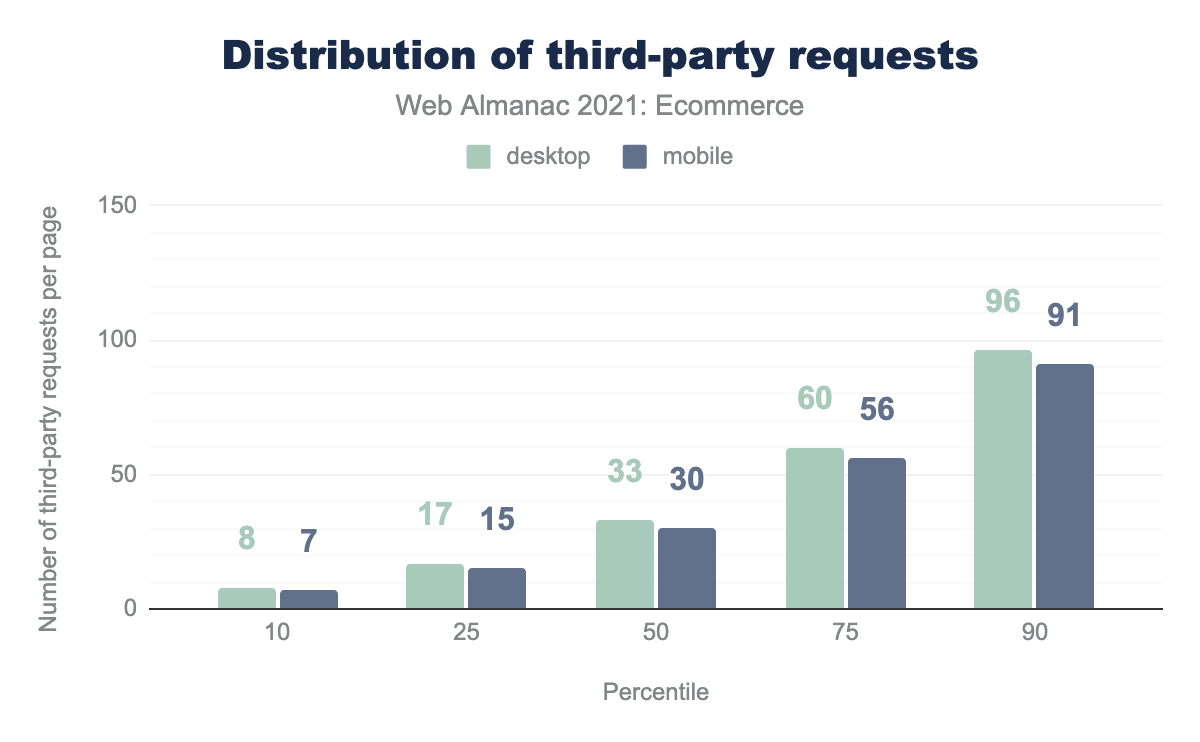
The median ecommerce site on mobile made 30 requests to third parties. While last year’s analysis saw an increase in third-party requests, this year the number is static with little change almost across the board. There is a slight change where the top 10% of pages have reduced the number of third-party requests from 98 to 91 on mobile and 103 to 96 on desktop.
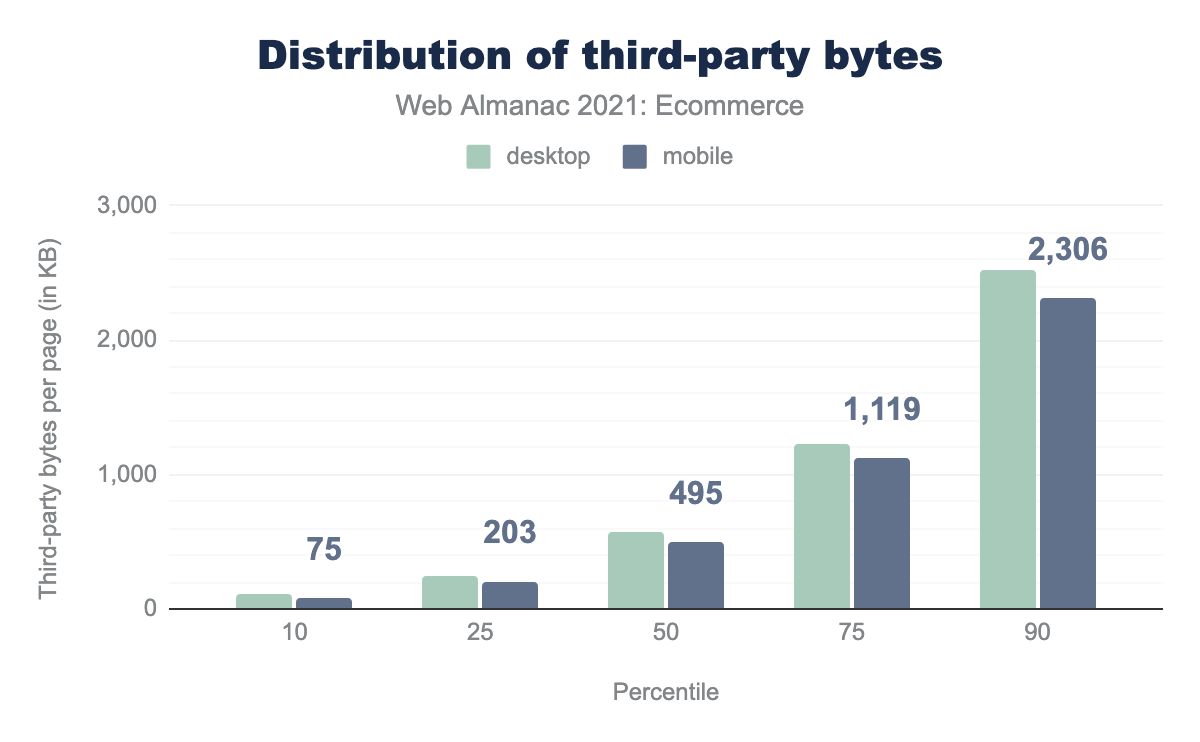
The weight of third-party content is also very similar to last year’s analysis. With sites in the 50th percentile requesting 495 KB of third-party content. The bottom 10% requested 75 KB while the top 10% requested 2306 KB.
Tools
In addition to site performance and quality analysis, our Methodology enables us to review other technologies used on ecommerce sites. This provides us with insight into the ecommerce strategies adopted (e.g., internationalization), as well as typical development techniques (e.g., JavaScript libraries used).
JavaScript frameworks & libraries
Using JavaScript is a popular method of customizing the commerce experience, particularly on SaaS platforms where the core product is a black box.
While we haven’t seen a marked increase in the amount of JavaScript used on the ecommerce sites this year, we did want to look into which frameworks and libraries are most commonly used. This may give insight into what JavaScript is being used to achieve.
Unfortunately, we are unable to make statements about the proliferation of headless frontend implementations within ecommerce. One limitation of the methodology is that it is more difficult to detect that a site is ecommerce when it is headless because the typical markers of an ecommerce platform no longer exist. At this point, the analysis falls back on weaker secondary signals.
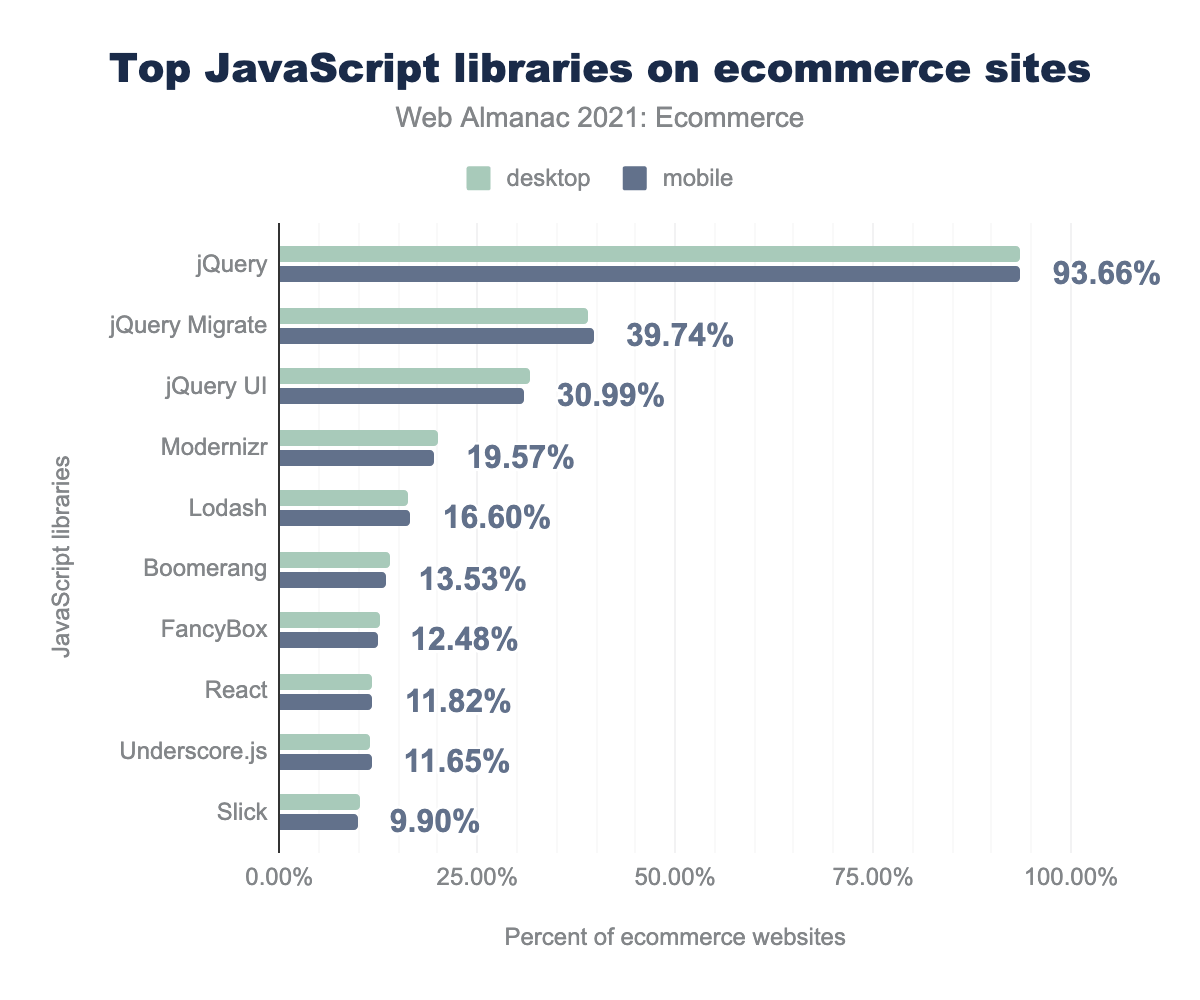
We see that jQuery is still the most popular library. Reports of its demise are greatly exaggerated. 93.66% of ecommerce websites profiled were still using it. Many of the popular ecommerce vendors provide jQuery as part of the default frontend. On top of that platforms also live and die by the app and plugin ecosystems where additional functionality can be bought off of the shelf. These solutions also regularly use jQuery to provide functionality cost-effectively.
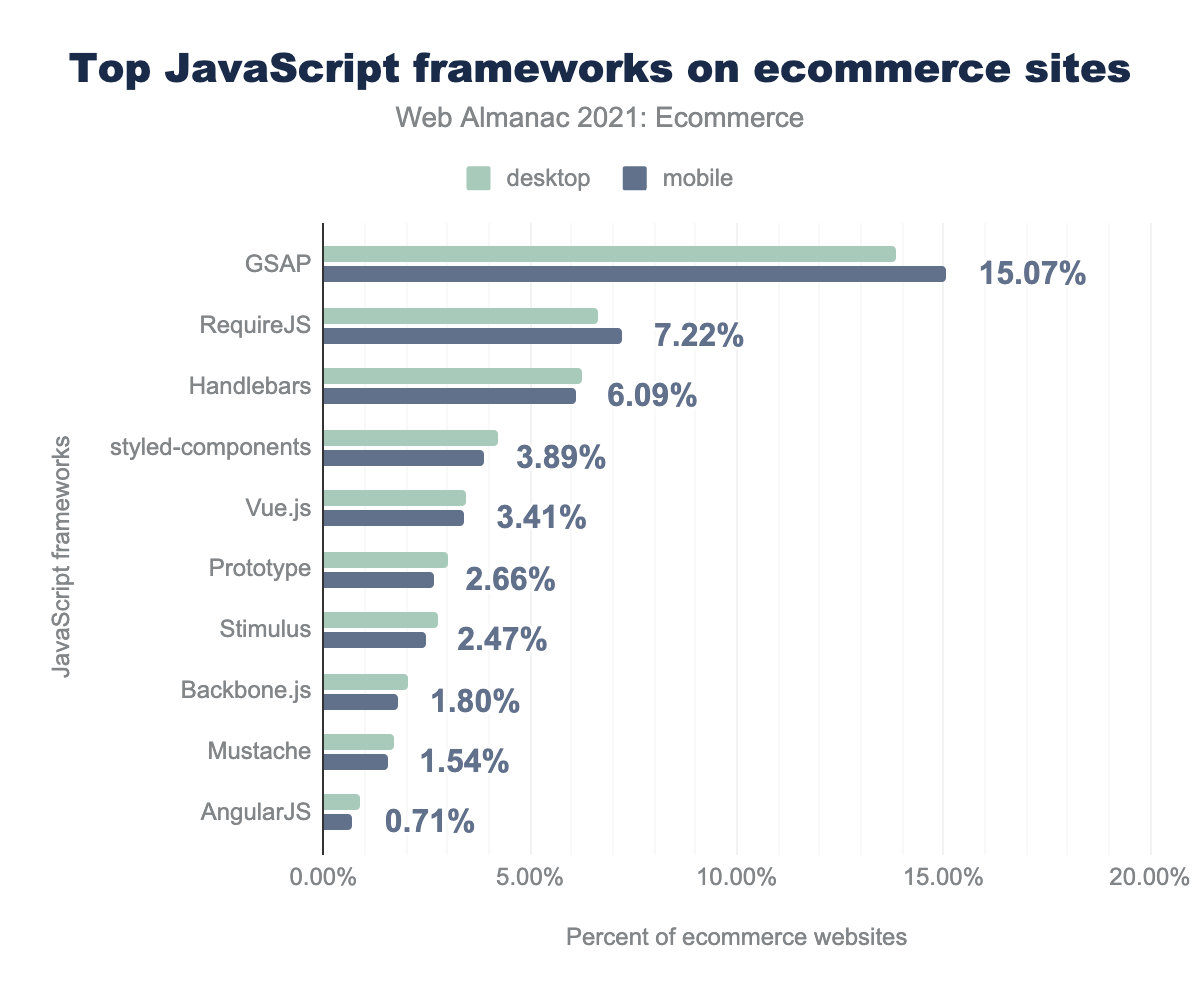
Noticeably GSAP (GreenSock Animation Platform) is included on 15% of ecommerce websites requested on mobile. That’s more common than Fancybox (12.48%), a popular Lightbox library, and Slick (9.90%) a library used for creating carousels.
We recognized in the limitation section that the results are going to be skewed because all requests are made to the homepage. This means that the analysis won’t find any libraries used for the product detail page media gallery where Slick may have proven even more popular.
Analytics
One of the beauties of ecommerce is that you can measure how well you’re doing by how many people you convert after they visit the site. In theory, every change you make, every new pricing offer, every new feature can be assessed objectively with analytics.
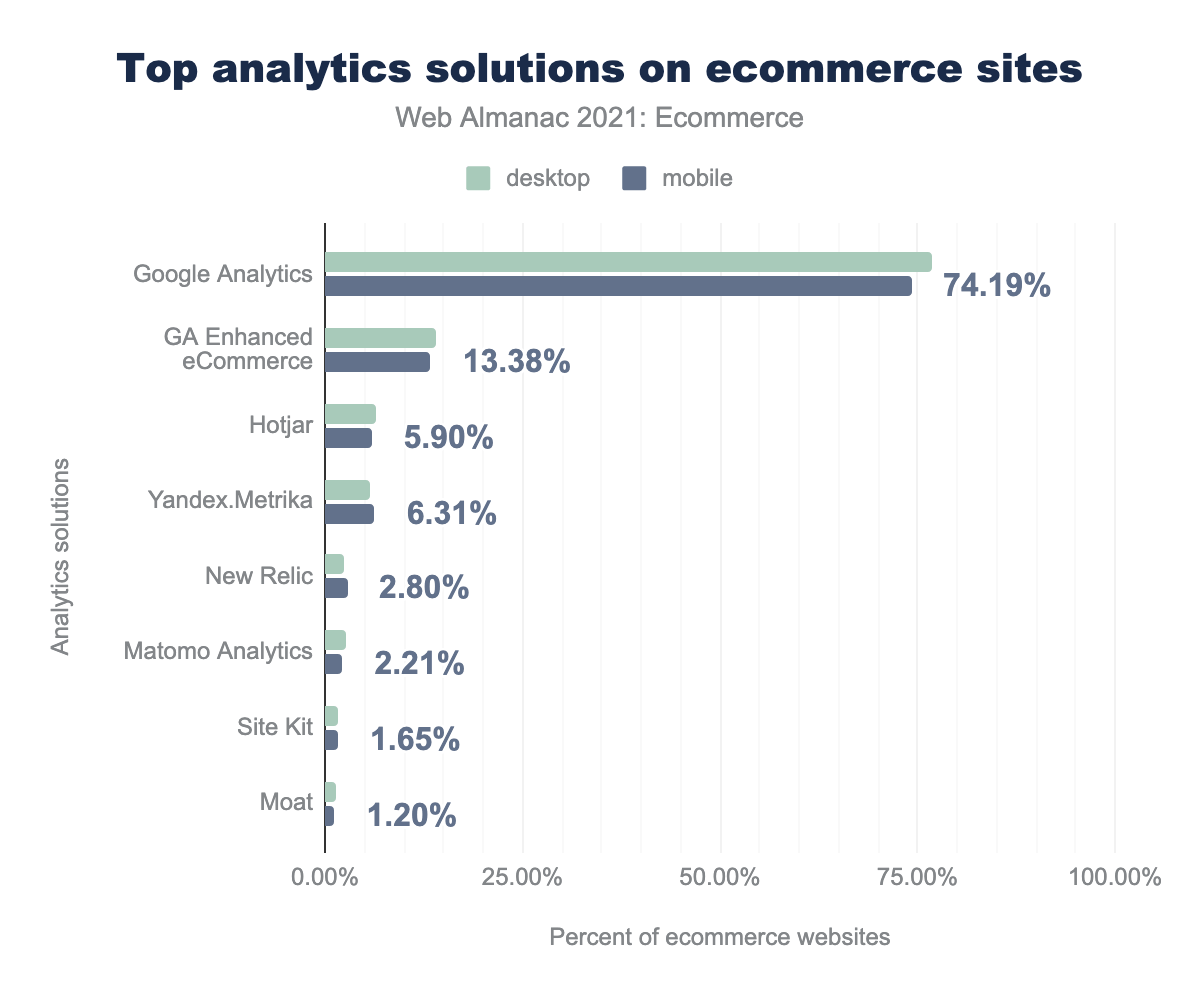
Google Analytics is the most popular analytics tool, found on 74.19% of websites (mobile). Bemusedly, only 13.38% of mobile requests and 13.99% of desktop requests noted the use of enhanced ecommerce. However, as the main enhanced ecommerce features are for tracking the ecommerce journey through product listing page, product detail page, cart, and checkout, perhaps the reason that we do not see a greater percentage is due to a limitation of the survey being restricted to home pages.
Tag managers
These tools provide ecommerce and marketing teams with reduced cycle time for launching new features as they allow JavaScript changes to be made to the site without a core website platform deployment (or indeed developer involvement).
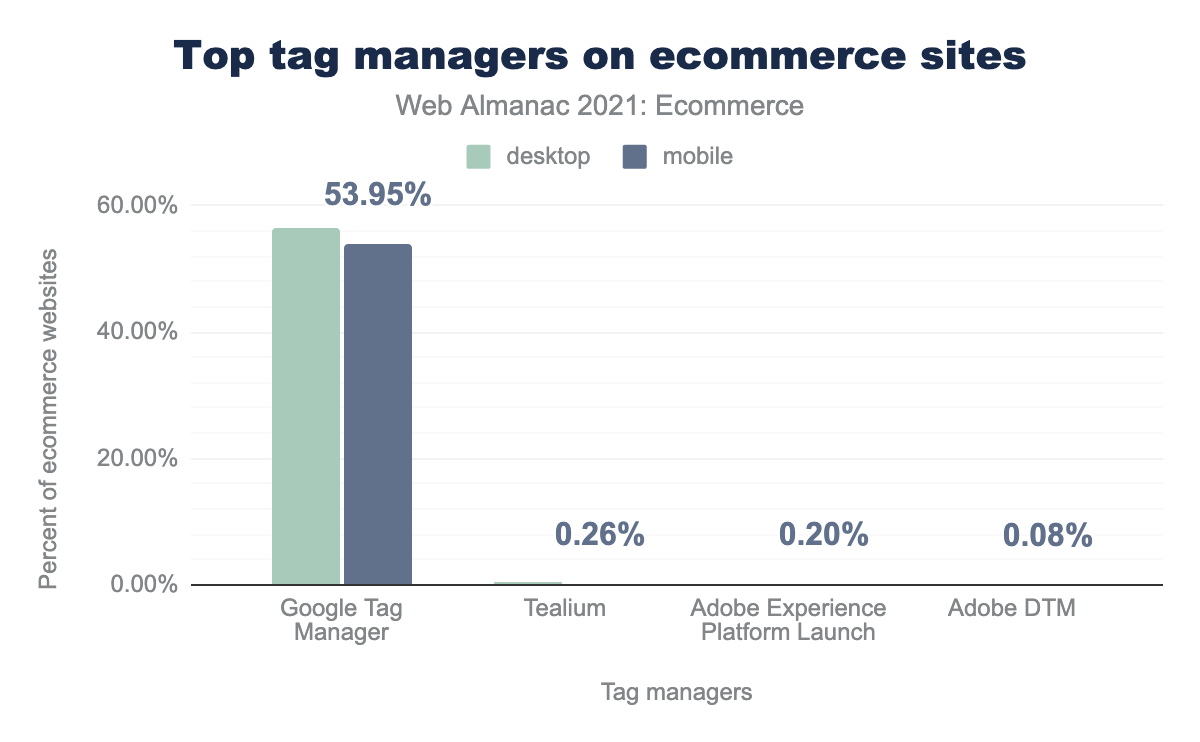
Google Tag Manager is by far the market leader with 56.39% usage on desktop and 53.95% on mobile. In second and third places were Tealium (0.26% mobile) and Adobe Experience Platform Launch (0.20% mobile).
A/B Testing
In a similar vein to analytics, implementing an A/B testing solution enables hypotheses to be tested. Providing a feedback mechanism for new features is the only way to understand which strategies are working and which should no longer be invested in.
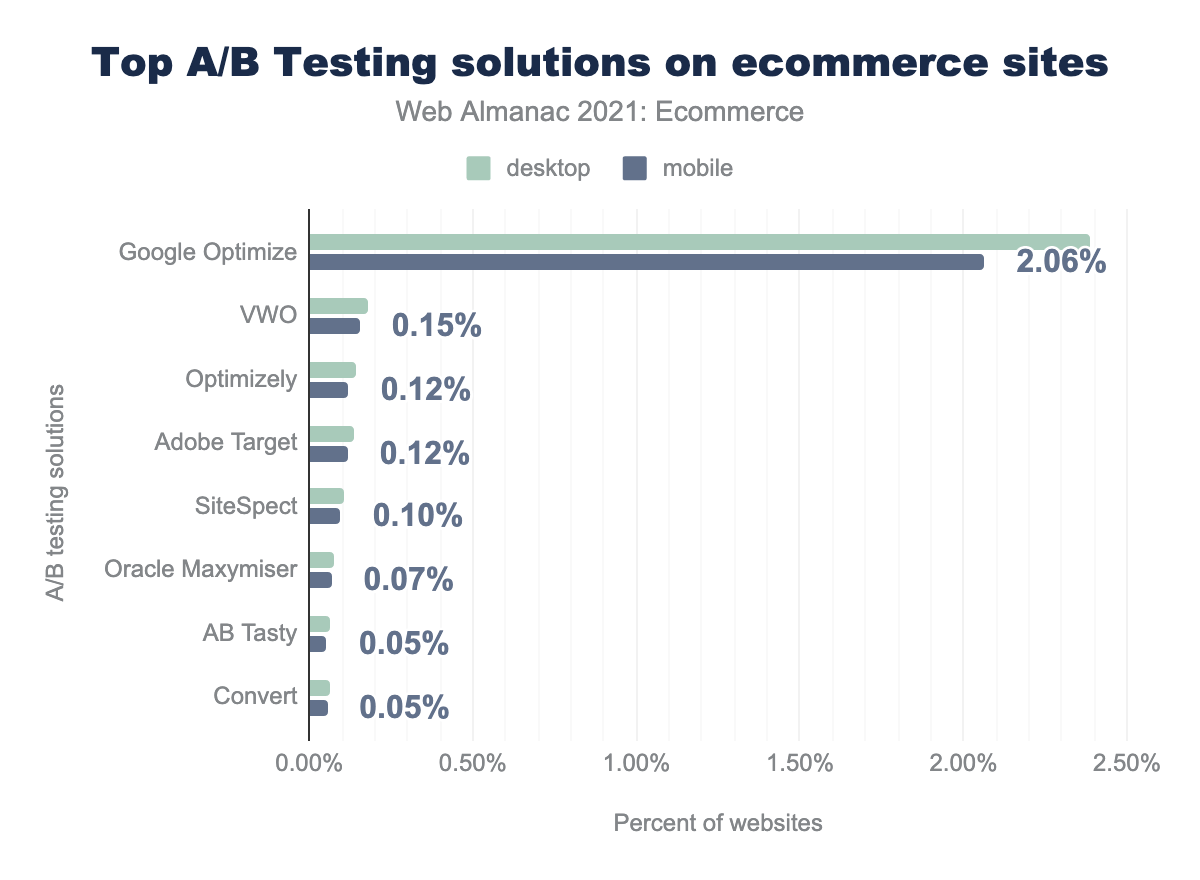
Google Optimize is the most popular A/B testing tool in use on 2.06% of mobile ecommerce sites. VWO was the second most common solution but was found on less than one-tenth the number of sites compared to Google Optimize (0.15% on mobile).
The obvious yet disappointing conclusion is the majority of ecommerce sites were not running A/B tests at the time of the survey.
Web push notifications
Once a visitor gives their permission, the Push API enables ecommerce sites to send push notifications even when the website is not open.
We tried to look at the adoption of web push notifications by ecommerce sites using the Chrome User Experience report. As this is generated from real user data, we can also see the approval rates for push permission requests. Please refer to this Google article for more details on how this data is captured and what metrics are available.
Only 0.43% of home pages on mobile (0.48% on desktop) requested the use of the Web Push API. While, notably, Safari on iOS does not support the Push Notifications API, there is still wide adoption in other browsers. Suggesting there is still a good opportunity to progressively enhance experiences with push notifications at appropriate points in the ecommerce journey, e.g., order updates.
What’s more, usage has measurably decreased since last year when 0.69% of mobile sites requested permission to send Push notifications (0.68% on desktop).
We may explain away the low usage statistics by saying that it is from a lack of awareness. However, the reduction in usage suggests a different trend; over a third of sites no longer use push notifications. This may be due to their poor push notification acceptance rates.
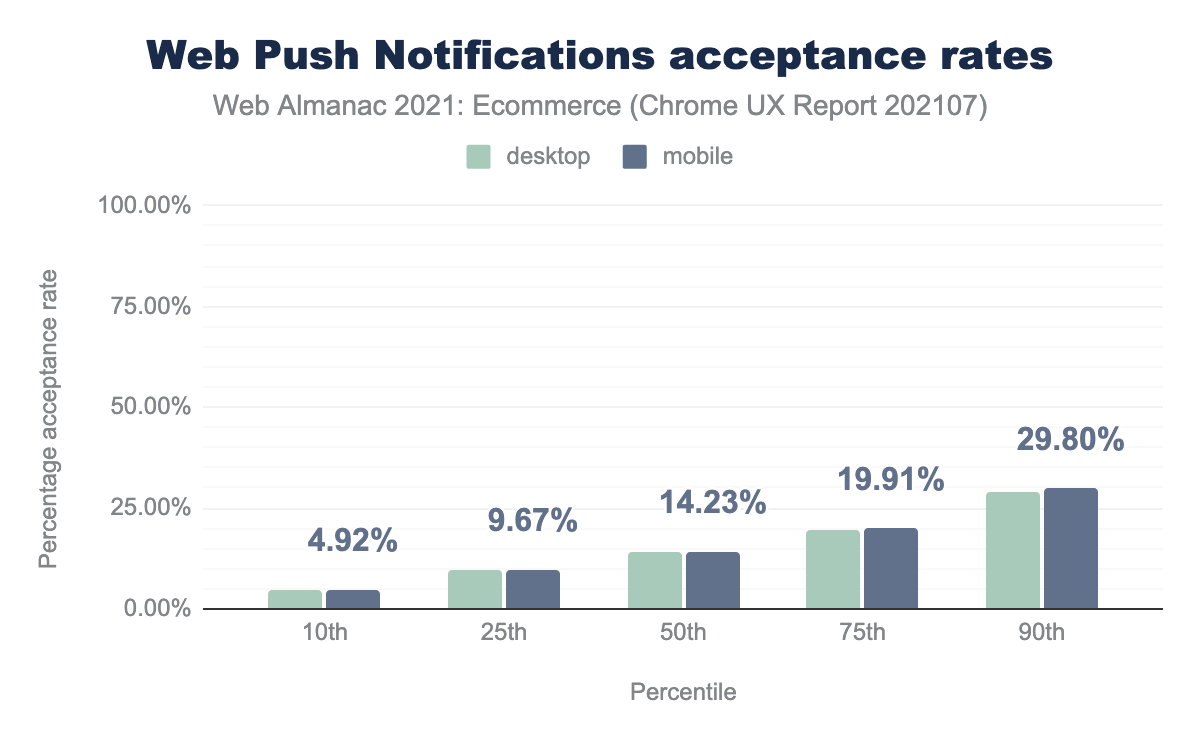
The Push notification acceptance rates are very similar to last year’s results. The median acceptance rate of push notification requests was 14.23% on mobile. Unfortunately, if there is any trend across year’s, it’s downwards. At the 90th percentile last year 36.9% of push requests were accepted compared to 29.80% this year on mobile.
The author can offer multiple suggestions as to why the uptake is so low:
- The request is being made at the wrong time, e.g., initial page load, or
- It is made before sufficient motivation has been offered, e.g., without any prompt as to the benefits of accepting notifications, or
- Perhaps more simply that visitors are simply still unaccustomed to web-based push notifications.
Accessibility overlays
Making your website accessible should not be an afterthought. However, there is an increasing number of technologies that claim to make your website more accessible. An accessibility overlay is JavaScript that tries to apply automated accessibility fixes to the site. They are typically not recommended by accessibility experts.
In our research, we found that less than 1% of websites had third-party accessibility tools on their homepage.
Further information on such tools can be found in the Accessibility chapter.
AMP
AMP from Google is commonly used within the media industry for providing the latest information fast, but it has struggled to take off in ecommerce. This year we reported less than 0.7% of websites declared AMP compatibility or linked to AMP resources.
Consent management
The EU Cookie policies and GDPR have increased the complexity of requested marketing permission. This year, we saw 6.85% of ecommerce websites on mobile deploying a third-party consent management app to facilitate collecting consent according to legislation (6.52% on desktop).
Content Security Policies
On a site where a customer is expected to share sensitive information, it is even more important to have confidence that there is no nefarious code that has made its way into the system. Content Security Policies (CSPs) are a technique to monitor or block requests to third party websites that aren’t on a whitelist.
As with many security policies, this form of control can be seen as the antagonist of ecommerce businesses that wish to move quickly with tools such as tag managers whose primary purpose is to add third-party code to sites quickly. In the author’s experience, the overhead in managing CPSs has resulted in little usage.
On initial reading, we were surprised to find that 25.02% of requests on desktop and 23.28% of mobile pages made use of a Content Security Policy. However, some ecommerce platform vendors provide a lax content security policy out of the box. For example, Shopify sites have a policy that blocks a site from being loaded within an iframe, as well as ensuring all requests are over HTTPS. Without further research, we have not been able to identify how many ecommerce sites are using CSPs as a form of control of third-party assets. Given that only 0.70% of sites are using the “Report Only” mode of CSP which is aimed at testing policy changes before they are enforced, it is likely that very few are.
Internationalization
A key growth strategy of successful ecommerce businesses is moving into new countries. To do this well, you would want to provide localized language versions of your site.
In this year’s analysis, we looked for hreflang headers and link tags to see how many sites were using them. These tags are not available out of the box on the most popular platforms (e.g., WooCommerce, Shopify, Magento), the existence of any suggests there would be more than one.
A hreflang attribute is used to communicate the language that the page is targeting. Optionally it can also narrow this recommendation to a particular country, e.g., en-gb for English targeting Great Britain, as opposed to en-us for English targeting the United States.
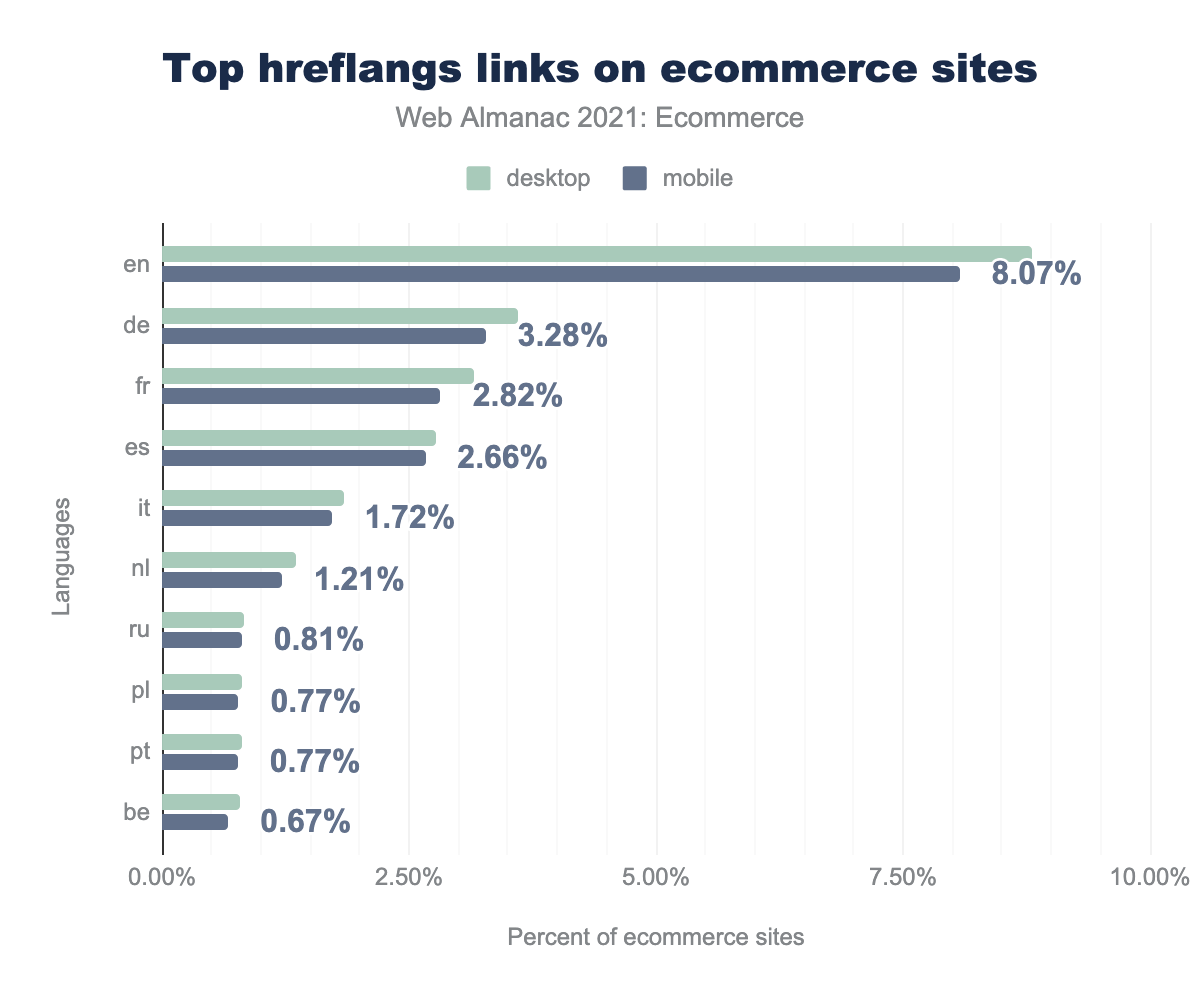
hreflang links. In descending order of popularity on mobile, an en hreflang is on 8.07% of ecommerce sites, de on 3.28%, fr on 2.82%, es on 2.66%, it on 1.72%, nl on 1.21%, ru on 0.81%, pl and pt on 0.81%, and be on 0.67%.hreflang links used on ecommerce sites
The results identified 8.81% of requests on desktop to specify an English hreflang and 8.07% on mobile ecommerce sites. The next most popular languages were German (3.28% on mobile), French (2.82%), and Spanish (2.66%).
It is hard to draw too many conclusions from this data without further research. However, we can say that it is still uncommon for ecommerce businesses to provide language-specific site variations. Of those that do, they are most likely to declare support for one or more languages used by Western European countries. In the author’s experience, the geographic proximity of each of the UK, France, Germany, Spain, and Italy makes internationalization an attractive growth strategy.
Further research could be performed here to better understand the internationalization capabilities of ecommerce websites. For example, looking into the average number of hreflang attributes declared may help determine the breadth of multi-region support.
Cross-referencing hreflang use with ranking data available from the CRUX metrics could uncover trends of when businesses invest in multi-region support.
Conclusion
There was a measurable increase in the proportion of sites with ecommerce functionality during Q2 and Q3 of 2020. This growth rate has not been maintained through to 2021. In fact, the percentage of ecommerce sites decreased from 21.27% to 19.49% on mobile suggesting that ecommerce has not grown at the same pace as the wider web.
WooCommerce and Shopify are the most popular ecommerce platforms. They also saw the largest proportion of the growth in response to the pandemic.
For the first time, our analysis benefited from website popularity ranking data. This enabled the review ecommerce platform popularity at different business sizes. In particular, within the 100,000 sites Magento is the most popular platform. It is followed by Shopify and Salesforce Commerce Cloud.
Finally, in terms of site performance, Core Web Vitals has been a prominent industry discussion over the last year because it is now a Google search engine ranking factor. We have seen 10-20% more sites achieve a good CWV on mobile across most of the top 5 platforms. Shopify sites had the highest percentage of good CWV experiences at 33% on average. Despite this improvement since last year, ecommerce sites still perform very poorly across all platforms for Core Web Vitals.
Future analysis opportunities
One of the methodology limitations is that only the homepage is tested. On an ecommerce site, there will likely be some technologies that are not detectable site-wide, e.g., payments and shipping providers will likely only be visible during the checkout process. This is likely to be impractical to achieve given the necessary steps to get to this stage of the checkout process.
Evaluating only the homepage also affects our ability to analyze site performance. Arguably the product listing and product detail pages are more important to optimize for speed. Fetching more than one page per site is being investigated and may be available for future editions of the Web Almanac.
Wappalyzer tracks over 2,700 popular web technologies which already provides us with incredible analysis opportunities. However, there is a very long tail of technologies, particularly in ecommerce. At the current time, it’s not practical to review categories of technologies within ecommerce, e.g., top personalization tools, top review apps, or top abandoned cart as there isn’t enough coverage. This is partly due to the number of technologies that can be detected and partly due to only requesting a single page per site.
As further technologies get supported by Wappalyzer, we may reach a point where further analysis can be done that looks to see if there’s any correlation between technology usage, performance, and the CrUX rank of a website.
