Page Weight
Introduction
The median web page is around 1900 KB in size and contains 74 requests. That doesn’t sound too bad, right?
Here’s the issue with medians: they mask problems. By definition, they focus only on the middle of the distribution. We need to consider percentiles at both extremes to get an understanding of the bigger picture.
Looking at the 90th percentile exposes the unpleasant stuff. Roughly 10% of the pages we’re pushing at the unsuspecting public are in excess of 6 MB and contain 179 requests. This is, frankly, terrible. If this doesn’t seem terrible to you, then you definitely need to read this chapter.
Myth: Page size doesn’t matter
The common argument as to why page size doesn’t matter anymore is that, thanks to high-speed internet and our souped-up devices, we can serve massive, complex (and massively complex) pages to the general population. This assumption works fine, as long as you’re okay with ignoring the vast swathe of internet users who don’t have access to said high-speed internet and souped-up devices.
Yes, you can build large robust pages that feel fast… to some users. But you should care about page bloat in terms of how it affects all your users, especially mobile-only users who deal with bandwidth constraints or data limits.
More bandwidth isn’t a magic bullet for web performance
Even if more people had access to better devices and cheaper connections, that wouldn’t be a complete solution. Double the bandwidth doesn’t mean twice as fast. In fact, it has been demonstrated that increasing bandwidth by up to 1,233% only made pages 55% faster.
The problem is latency. Most of our networking protocols require a lot of round-trips, and each of those round trips imposes a latency penalty. For as long as latency continues to be a performance problem (which is to say, for the foreseeable future), the major performance culprit will continue to be that a typical web page today contains a hundred or so assets hosted on dozens of different servers. Many of these assets are unoptimized, unmeasured, unmonitored—and therefore unpredictable.
What types of assets does the HTTP Archive track, and how much do they matter?
Here’s a quick glossary of the page composition metrics that the HTTP Archive tracks, and how much they matter in terms of performance and user experience:
-
The total size is the total weight in bytes of the page. It matters especially to mobile users who have limited and/or metered data.
-
HTML is typically the smallest resource on the page. Its performance risk is negligible.
-
Unoptimized images are often the greatest contributor to page bloat. Looking at the 90th percentile of the distribution of page weight, images account for a whopping 5.2 MB of a roughly 7 MB page. In other words, images comprise almost 75% of the total page weight. And if that already wasn’t enough, the number of images on a page has been linked to lower conversion rates on retail sites. (More on that later.)
-
JavaScript matters. A page can have a relatively low JavaScript weight but still suffer from JavaScript-inflicted performance problems. Even a single 100 KB third-party script can wreak havoc with your page. The more scripts on your page, the greater the risk.
It’s not enough to focus solely on blocking JavaScript. It’s possible for your pages to contain zero blocking resources and still have less-than-optimal performance because of how your JavaScript is rendered. That’s why it’s so important to understand CPU usage on your pages, because JavaScript consumes more CPU than all other browser activities combined. While JavaScript blocks the CPU, the browser can’t respond to user input. This creates what’s commonly called “jank”: that annoying feeling of jittery, unstable page rendering.
-
CSS is an incredible boon for modern web pages. It solves a myriad of design problems, from browser compatibility to design maintenance and updating. Without CSS, we wouldn’t have great things like responsive design. But, like JavaScript, CSS doesn’t have to be bulky to cause problems. Poorly executed stylesheets can create a host of performance problems, ranging from stylesheets taking too long to download and parse, to improperly placed stylesheets that block the rest of the page from rendering. And, similarly to JavaScript, more CSS files equals more potential trouble.
Bigger, complex pages can be bad for your business
Let’s assume you’re not a heartless monster who doesn’t care about your site’s visitors. But if you are, you should know that serving bigger, more complex pages hurts you, too. That was one of the findings of a Google-led machine learning study that gathered over a million beacons’ worth of real user data from retail sites.
There were three really important takeaways from this research:
-
The total number of elements on a page was the greatest predictor of conversions. Hopefully this doesn’t come as a huge surprise to you, given what we’ve just covered about the performance risks imposed by the various assets that make up a modern web page.
-
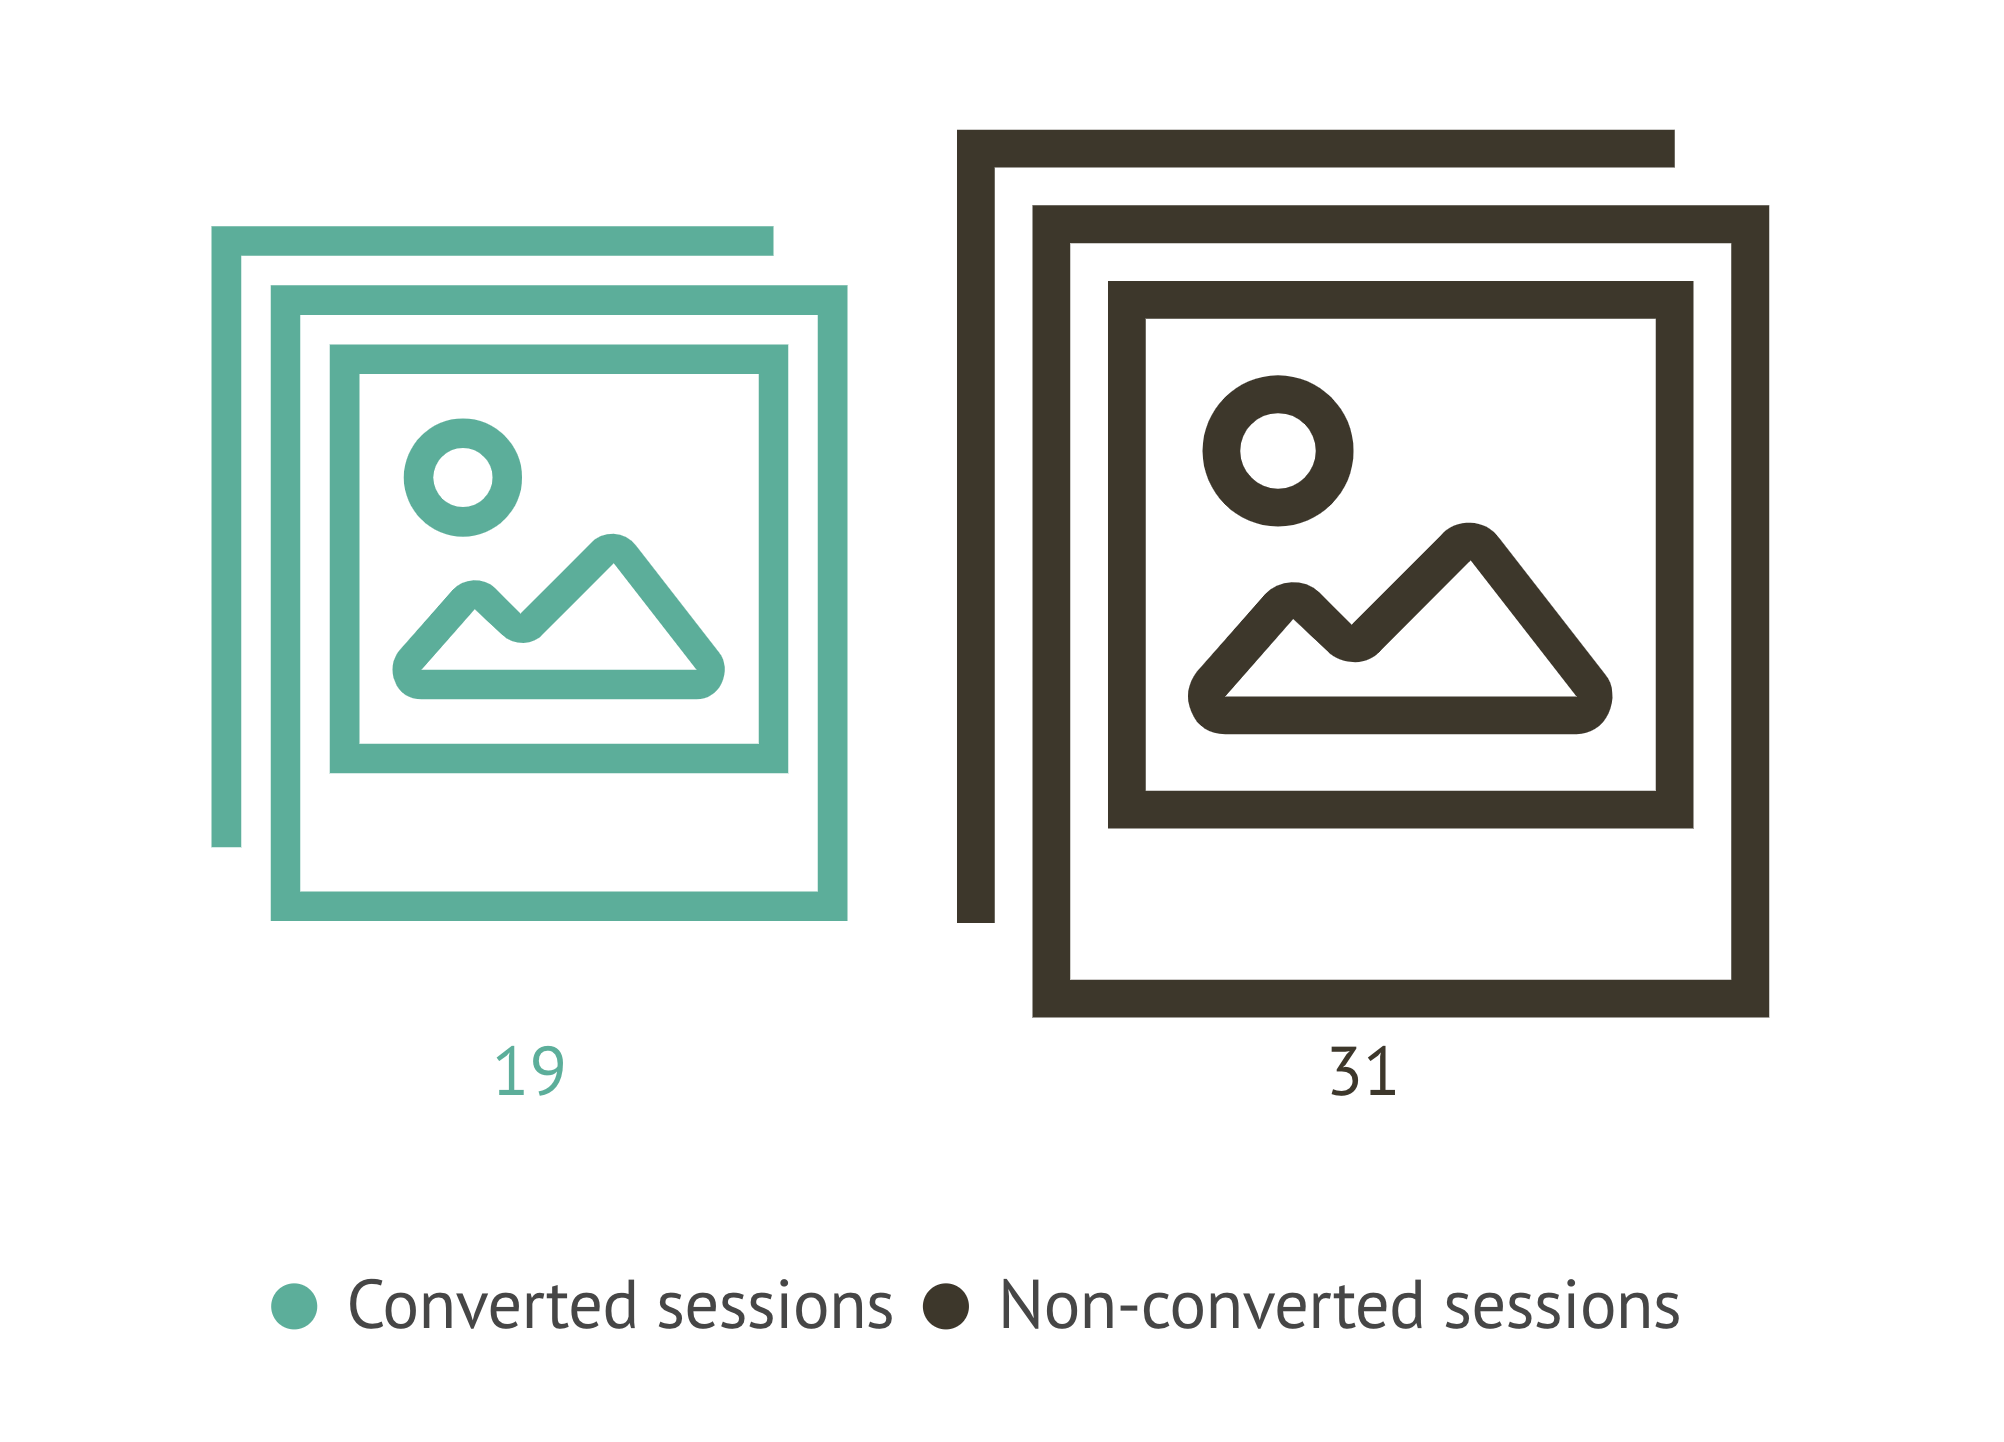
The number of images on a page was the second greatest predictor of conversions. Sessions in which users converted had 38% fewer images than in sessions that didn’t convert.
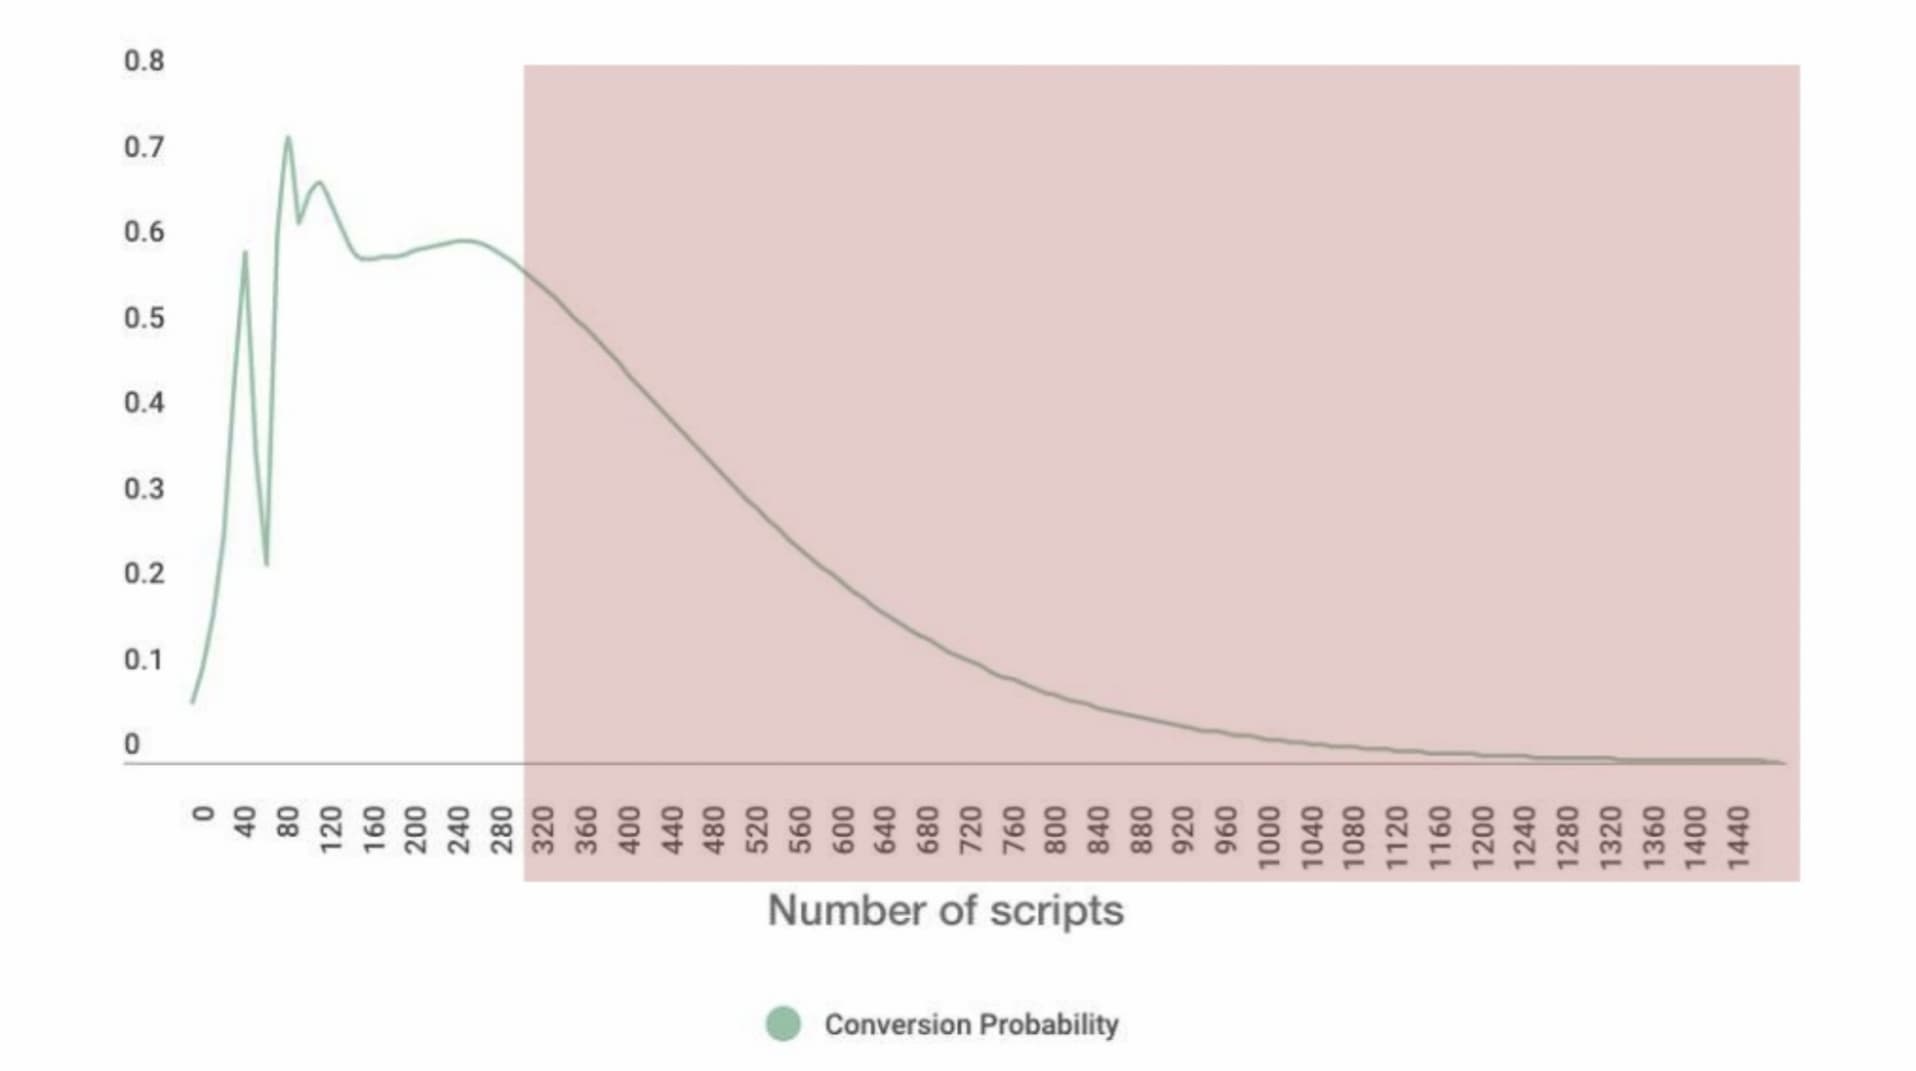
- Sessions with more scripts were less likely to convert. What’s really fascinating about this chart isn’t just the sharp drop-off in conversion probability after about 240 scripts. It’s the long tail that demonstrates how many retail sessions contained up to 1,440 scripts!
Now that we’ve covered why page size and complexity matter, let’s get into some juicy HTTP Archive stats so we can better understand the current state of the web and the impact of page bloat.
Analysis
The statistics in this section are all based on the transfer size of a page and its resources. Not all resources on the web are compressed before sending, but if they are, this analysis uses the compressed size.
Page weight
Roughly speaking, mobile sites are about 10% smaller than their desktop counterparts. The majority of the difference is due to mobile sites loading fewer image bytes than their desktop counterparts.
Mobile
| Percentile | Total (KB) | HTML (KB) | JS (KB) | CSS (KB) | Image (KB) | Document (KB) |
|---|---|---|---|---|---|---|
| 90 | 6226 | 107 | 1060 | 234 | 4746 | 49 |
| 75 | 3431 | 56 | 668 | 122 | 2270 | 25 |
| 50 | 1745 | 26 | 360 | 56 | 893 | 13 |
| 25 | 800 | 11 | 164 | 22 | 266 | 7 |
| 10 | 318 | 6 | 65 | 5 | 59 | 4 |
Desktop
| Percentile | Total (KB) | HTML (KB) | JS (KB) | CSS (KB) | Image (KB) | Document (KB) |
|---|---|---|---|---|---|---|
| 90 | 6945 | 110 | 1131 | 240 | 5220 | 52 |
| 75 | 3774 | 58 | 721 | 129 | 2434 | 26 |
| 50 | 1934 | 27 | 391 | 62 | 983 | 14 |
| 25 | 924 | 12 | 186 | 26 | 319 | 8 |
| 10 | 397 | 6 | 76 | 8 | 78 | 4 |
Page weight over time
Over the past year the median size of a desktop site increased by 434 KB, and the median size of a mobile site increased by 179 KB. Images are overwhelmingly driving this increase.
Mobile
| Percentile | Total (KB) | HTML (KB) | JS (KB) | CSS (KB) | Image (KB) | Document (KB) |
|---|---|---|---|---|---|---|
| 90 | +376 | -50 | +46 | +36 | +648 | +2 |
| 75 | +304 | -7 | +34 | +21 | +281 | 0 |
| 50 | +179 | -1 | +27 | +10 | +106 | 0 |
| 25 | +110 | -1 | +16 | +5 | +36 | 0 |
| 10 | +72 | 0 | +13 | +2 | +20 | +1 |
Desktop
| Percentile | Total (KB) | HTML (KB) | JS (KB) | CSS (KB) | Image (KB) | Document (KB) |
|---|---|---|---|---|---|---|
| 90 | +1106 | -75 | +22 | +45 | +1291 | +5 |
| 75 | +795 | -12 | +9 | +32 | +686 | +1 |
| 50 | +434 | -1 | +10 | +15 | +336 | 0 |
| 25 | +237 | 0 | +12 | +7 | +138 | 0 |
| 10 | +120 | 0 | +10 | +2 | +39 | +1 |
For a longer-term perspective on how page weight has changed over time, check out this timeseries graph from HTTP Archive. Median page size has grown at a fairly constant rate since the HTTP Archive started tracking this metric in November 2010 and the increase in page weight observed over the past year is consistent with this.
Page requests
The median desktop page makes 74 requests, and the median mobile page makes 69. Images and JavaScript account for the majority of these requests. There was no significant change in the quantity or distribution of requests over the last year.
Mobile
| Percentile | Total | HTML | JS | CSS | Image | Document |
|---|---|---|---|---|---|---|
| 90 | 168 | 15 | 52 | 20 | 79 | 7 |
| 75 | 111 | 7 | 32 | 12 | 49 | 2 |
| 50 | 69 | 3 | 18 | 6 | 28 | 0 |
| 25 | 40 | 2 | 9 | 3 | 15 | 0 |
| 10 | 22 | 1 | 4 | 1 | 7 | 0 |
Desktop
| Percentile | Total | HTML | JS | CSS | Image | Document |
|---|---|---|---|---|---|---|
| 90 | 179 | 14 | 53 | 20 | 90 | 6 |
| 75 | 118 | 7 | 33 | 12 | 54 | 2 |
| 50 | 74 | 4 | 19 | 6 | 31 | 0 |
| 25 | 44 | 2 | 10 | 3 | 16 | 0 |
| 10 | 24 | 1 | 4 | 1 | 7 | 0 |
File formats
The preceding analysis has focused on analyzing page weight through the lens of resource types. However, in the case of images and media, it’s possible to dive a level deeper and look at the differences in resource sizes between specific file formats.
File size by image format (mobile)
| Percentile | GIF (KB) | ICO (KB) | JPG (KB) | PNG (KB) | SVG (KB) | WEBP (KB) |
|---|---|---|---|---|---|---|
| 10 | 0 | 0 | 3.08 | 0.37 | 0.25 | 2.54 |
| 25 | 0.03 | 0.26 | 7.96 | 1.14 | 0.43 | 4.89 |
| 50 | 0.04 | 1.12 | 21 | 4.31 | 0.88 | 13 |
| 75 | 0.06 | 2.72 | 63 | 22 | 2.41 | 33 |
| 90 | 2.65 | 13 | 155 | 90 | 7.91 | 78 |
Some of these results, particularly those for GIFs, are really surprising. If GIFs are so small, then why are they being replaced by formats like JPG, PNG, and WEBP?
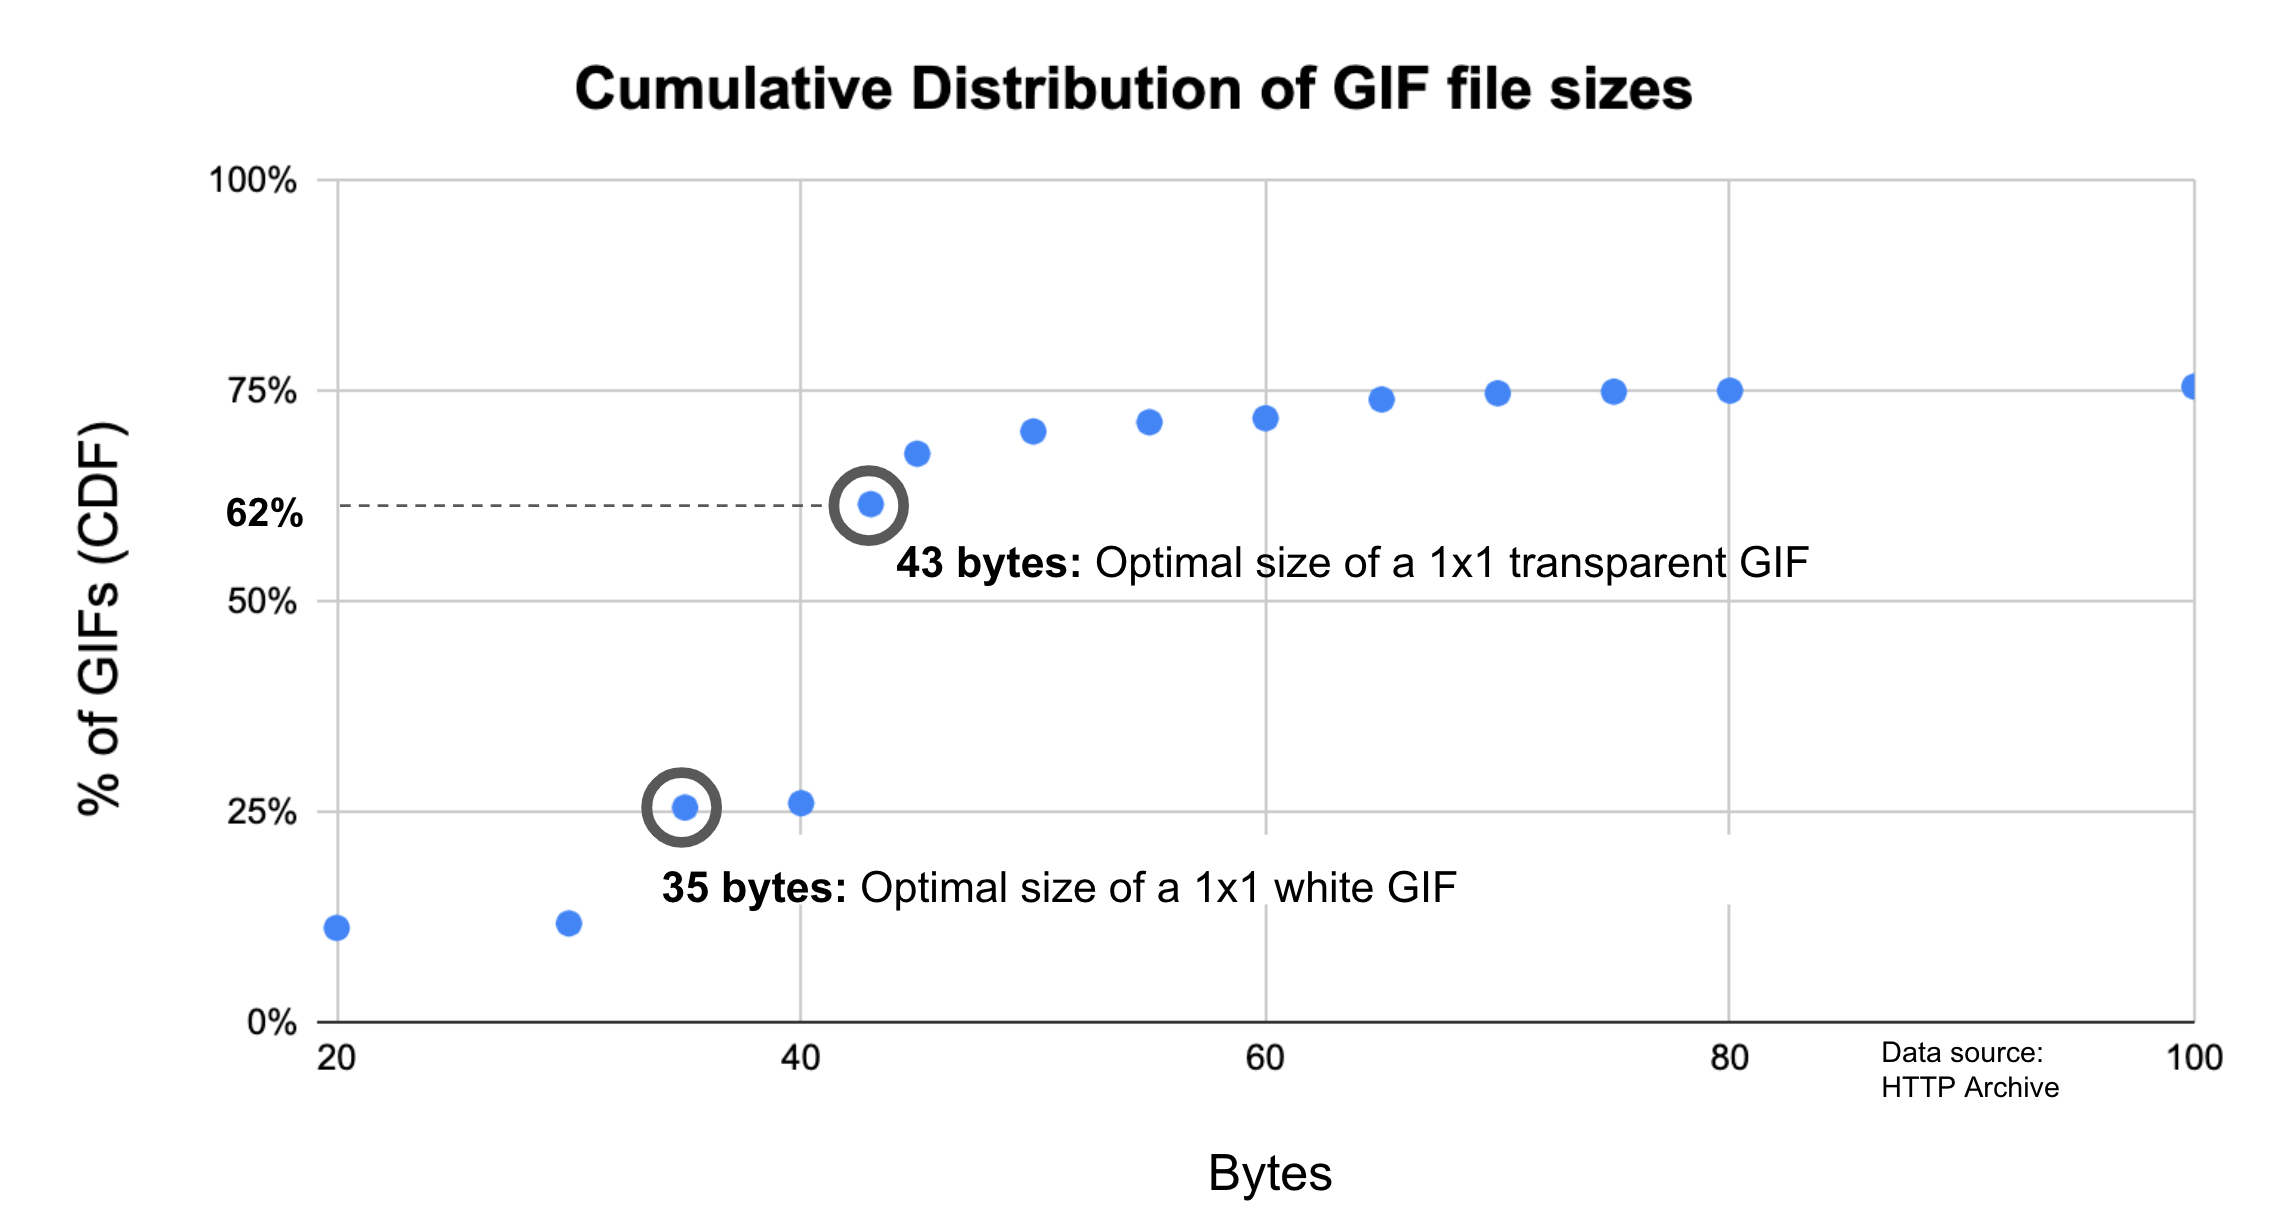
The data above obscures the fact that the vast majority of GIFs on the web are actually tiny 1x1 pixels. These pixels are typically used as “tracking pixels”, but can also be used as a hack to generate various CSS effects. While these 1x1 pixels are images in the literal sense, the spirit of their usage is probably closer to what we’d associate with scripts or CSS.
Further investigation into the data set revealed that 62% of GIFs are 43 bytes or smaller (43 bytes is the size of a transparent, 1x1 pixel GIF) and 84% of GIFs are 1 KB or smaller.
The tables below show two different approaches to removing these tiny images from the data set: the first one is based on images with a file size greater than 100 bytes, the second is based on images with a file size greater than 1024 bytes.
File size by image format for images > 100 bytes
| Percentile | GIF (KB) | ICO (KB) | JPG (KB) | PNG (KB) | SVG (KB) | WEBP (KB) |
|---|---|---|---|---|---|---|
| 10 | 0.27 | 0.31 | 3.08 | 0.4 | 0.28 | 2.1 |
| 25 | 0.75 | 0.6 | 7.7 | 1.17 | 0.46 | 4.4 |
| 50 | 2.14 | 1.12 | 20.47 | 4.35 | 0.95 | 11.54 |
| 75 | 7.34 | 4.19 | 61.13 | 21.39 | 2.67 | 31.21 |
| 90 | 35 | 14.73 | 155.46 | 91.02 | 8.26 | 76.43 |
File size by image format for images > 1024 bytes
| Percentile | GIF (KB) | ICO (KB) | JPG (KB) | PNG (KB) | SVG (KB) | WEBP (KB) |
|---|---|---|---|---|---|---|
| 10 | 1.28 | 1.12 | 3.4 | 1.5 | 1.2 | 3.08 |
| 25 | 1.9 | 1.12 | 8.21 | 2.88 | 1.52 | 5 |
| 50 | 4.01 | 2.49 | 21.19 | 8.33 | 2.81 | 12.52 |
| 75 | 11.92 | 7.87 | 62.54 | 33.17 | 6.88 | 32.83 |
| 90 | 67.15 | 22.13 | 157.96 | 127.15 | 19.06 | 79.53 |
The low file size of PNG images compared to JPEG images may seem surprising. JPEG uses lossy compression. Lossy compression results in data loss, which makes it possible to achieve smaller file sizes. Meanwhile, PNG uses lossless compression. This does not result in data loss, which this produces higher-quality, but larger images. However, this difference in file sizes is probably a reflection of the popularity of PNGs for iconography due to their transparency support, rather than differences in their encoding and compression.
File size by media format
MP4 is overwhelmingly the most popular video format on the web today. In terms of popularity, it is followed by WebM and MPEG-TS respectively.
Unlike some of the other tables in this data set, this one has mostly happy takeaways. Videos are consistently smaller on mobile, which is great to see. In addition, the median size of an MP4 video is a very reasonable 18 KB on mobile and 39 KB on desktop. The median numbers for WebM are even better but they should be taken with a grain of salt: the duplicate measurement of 0.29 KB across multiple clients and percentiles is a little bit suspicious. One possible explanation is that identical copies of one very tiny WebM video is included on many pages. Of the three formats, MPEG-TS consistently has the highest file size across all percentiles. This may be related to the fact that it was released in 1995, making it the oldest of these three media formats.
Mobile
| Percentile | MP4 (KB) | WebM (KB) | MPEG-TS (KB) |
|---|---|---|---|
| 10 | 0.89 | 0.29 | 0.01 |
| 25 | 2.07 | 0.29 | 55 |
| 50 | 18 | 1.44 | 153 |
| 75 | 202 | 223 | 278 |
| 90 | 928 | 390 | 475 |
Desktop
| Percentile | MP4 (KB) | WebM (KB) | MPEG-TS (KB) |
|---|---|---|---|
| 10 | 0.27 | 0.29 | 34 |
| 25 | 1.05 | 0.29 | 121 |
| 50 | 39 | 17 | 286 |
| 75 | 514 | 288 | 476 |
| 90 | 2142 | 896 | 756 |
Conclusion
Over the past year, pages increased in size by roughly 10%. Brotli, performance budgets, and basic image optimization best practices are probably the three techniques which show the most promise for maintaining or improving page weight while also being widely applicable and fairly easy to implement. That being said, in recent years, improvements in page weight have been more constrained by the low adoption of best practices than by the technology itself. In other words, although there are many existing techniques for improving page weight, they won’t make a difference if they aren’t put to use.

