Third Parties

Introduction
The open web is vast, linkable, and interoperable by design. The ability to grab someone else’s complex library and use it on your site with a single <link> or <script> element has supercharged developers’ productivity and enabled awesome new web experiences. On the flip side, the immense popularity of a select few third-party providers raises important performance, privacy, and security concerns. This chapter examines the prevalence and impact of third-party code on the web in 2019, the usage patterns that lead to the popularity of third-party solutions, and potential repercussions for the future of web experiences.
Definitions
“Third Party”
A third party is an entity outside the primary site-user relationship, i.e. the aspects of the site not directly within the control of the site owner but present with their approval. For example, the Google Analytics script is an example of a common third-party resource.
Third-party resources are:
- Hosted on a shared and public origin
- Widely used by a variety of sites
- Uninfluenced by an individual site owner
To match these goals as closely as possible, the formal definition used throughout this chapter of a third-party resource is a resource that originates from a domain whose resources can be found on at least 50 unique pages in the HTTP Archive dataset.
Note that using these definitions, third-party content served from a first-party domain is counted as first-party content. For example, self-hosting Google Fonts or bootstrap.css is counted as first-party content. Similarly, first-party content served from a third-party domain is counted as third-party content. For example, first-party images served over a CDN on a third-party domain are considered third-party content.
Provider categories
This chapter divides third-party providers into one of these broad categories. A brief description is included below and the mapping of domain to category can be found in the third-party-web repository.
- Ad - display and measurement of advertisements
- Analytics - tracking site visitor behavior
- CDN - providers that host public shared utilities or private content of their users
- Content - providers that facilitate publishers and host syndicated content
- Customer Success - support and customer relationship management functionality
- Hosting - providers that host the arbitrary content of their users
- Marketing - sales, lead generation, and email marketing functionality
- Social - social networks and their affiliated integrations
- Tag Manager - provider whose sole role is to manage the inclusion of other third parties
- Utility - code that aids the development objectives of the site owner
- Video - providers that host the arbitrary video content of their users
- Other - uncategorized or non-conforming activity
Caveats
- All data presented here is based on a non-interactive, cold load. These values could start to look quite different after user interaction.
- Roughly 84% of all third-party domains by request volume have been identified and categorized. The remaining 16% fall into the “Other” category.
Data
Third-party code is everywhere. 93% of pages include at least one third-party resource, 76% of pages issue a request to an analytics domain, the median page requests content from at least 9 unique third-party domains that represent 35% of their total network activity, and the most active 10% of pages issue a whopping 175 third-party requests or more. It’s not a stretch to say that third parties are an integral part of the web.
Categories
If the ubiquity of third-party content is unsurprising, perhaps more interesting is the breakdown of third-party content by provider type.
While advertising might be the most user-visible example of third-party presence on the web, analytics providers are the most common third-party category with 76% of sites including at least one analytics request. CDNs at 63%, ads at 57%, and developer utilities like Sentry, Stripe, and Google Maps SDK at 56% follow up as a close second, third, and fourth for appearing on the most web properties. The popularity of these categories forms the foundation of our web usage patterns identified later in the chapter.
Providers
A relatively small set of providers dominate the third-party landscape: the top 100 domains account for 30% of network requests across the web. Powerhouses like Google, Facebook, and YouTube make the headlines here with full percentage points of share each, but smaller entities like Wix and Shopify command a substantial portion of third-party popularity as well.
While much could be said about every individual provider’s popularity and performance impact, this more opinionated analysis is left as an exercise for the reader and other purpose-built tools such as third-party-web.
| Rank | Third party domain | Percent of requests |
|---|---|---|
| 1 | fonts.gstatic.com |
2.53% |
| 2 | www.facebook.com |
2.38% |
| 3 | www.google-analytics.com |
1.71% |
| 4 | www.google.com |
1.17% |
| 5 | fonts.googleapis.com |
1.05% |
| 6 | www.youtube.com |
0.99% |
| 7 | connect.facebook.net |
0.97% |
| 8 | googleads.g.doubleclick.net |
0.93% |
| 9 | cdn.shopify.com |
0.76% |
| 10 | maps.googleapis.com |
0.75% |
| Rank | Third party URL | Percent of requests |
|---|---|---|
| 1 | https://www.google-analytics.com/analytics.js |
0.64% |
| 2 | https://connect.facebook.net/en_US/fbevents.js |
0.20% |
| 3 | https://connect.facebook.net/signals/plugins/inferredEvents.js?v=2.8.51 |
0.19% |
| 4 | https://staticxx.facebook.com/connect/xd_arbiter.php?version=44 |
0.16% |
| 5 | https://fonts.gstatic.com/s/opensans/v16/mem8YaGs126MiZpBA-UFVZ0b.woff2 |
0.13% |
| 6 | https://www.googletagservices.com/activeview/js/current/osd.js?cb=%2Fr20100101 |
0.12% |
| 7 | https://fonts.gstatic.com/s/roboto/v18/KFOmCnqEu92Fr1Mu4mxK.woff2 |
0.11% |
| 8 | https://googleads.g.doubleclick.net/pagead/id |
0.11% |
| 9 | https://fonts.gstatic.com/s/roboto/v19/KFOmCnqEu92Fr1Mu4mxK.woff2 |
0.10% |
| 10 | https://www.googleadservices.com/pagead/conversion_async.js |
0.10% |
Resource types
The resource type breakdown of third-party content also lends insight into how third-party code is used across the web. While first-party requests are 56% images, 23% script, 14% CSS, and only 4% HTML, third-party requests skew more heavily toward script and HTML at 32% script, 34% images, 12% HTML, and only 6% CSS. While this suggests that third-party code is less frequently used to aid the design and instead used more frequently to facilitate or observe interactions than first-party code, a breakdown of resource types by party status tells a more nuanced story. While CSS and images are dominantly first-party at 70% and 64% respectively, fonts are largely served by third-party providers with only 28% being served from first-party sources. This concept of usage patterns is explored in more depth later in this chapter.
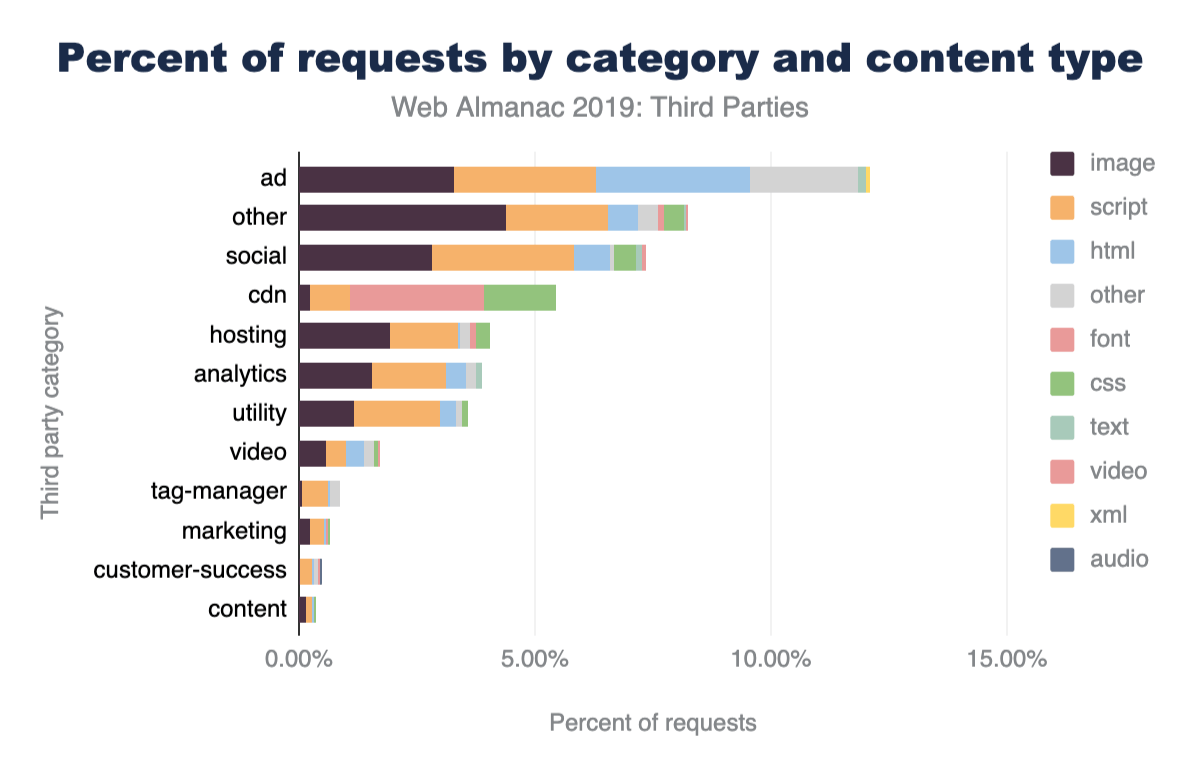
Several other amusing factoids jump out from this data. Tracking pixels (image requests to analytics domains) make up 1.6% of all network requests, six times as many video requests are to social networks like Facebook and Twitter than dedicated video providers like YouTube and Vimeo (presumably because the default YouTube embed consists of HTML and a preview thumbnail but not an autoplaying video), and there are still more requests for first-party images than all scripts combined.
Request count
49% of all requests are third-party. At 51%, first-party can still narrowly hold on to the crown in 2019 of comprising the majority of the web resources. Given that just under half of all the requests are third-party yet a small set of pages do not include any at all, the most active third-party users must be doing quite a bit more than their fair share. Indeed, at the 75th, 90th, and 99th percentiles we see nearly all of the page being comprised of third-party content. In fact, for some sites heavily relying on distributed WYSIWYG platforms like Wix and SquareSpace, the root document might be the sole first-party request!
The number of requests issued by each third-party provider also varies considerably by category. While analytics are the most widespread third-party category across websites, they account for only 7% of all third-party network requests. Ads, on the other hand, are found on nearly 20% fewer sites yet make up 25% of all third-party network requests. Their outsized resource impact compared to their popularity will be a theme we continue to uncover in the remaining data.
Byte weight
While 49% of requests are third-party, their share of the web in terms of bytes is quite a bit lower at only 28%. The same goes for the breakdown by multiple resource types. Third-party fonts make up 72% of all fonts, but they’re only 53% of font bytes; 74% of HTML requests, but only 39% of HTML bytes; 68% of video requests, but only 31% of video bytes. All this seems to suggest third-party providers are responsible stewards who keep their response sizes low, and, for the most part, that is in fact the case until you look at scripts.
Despite serving 57% of scripts, third parties comprise 64% of script bytes. meaning their scripts are larger on average than first-party scripts. This is an early warning sign for their performance impact to come in the next few sections.
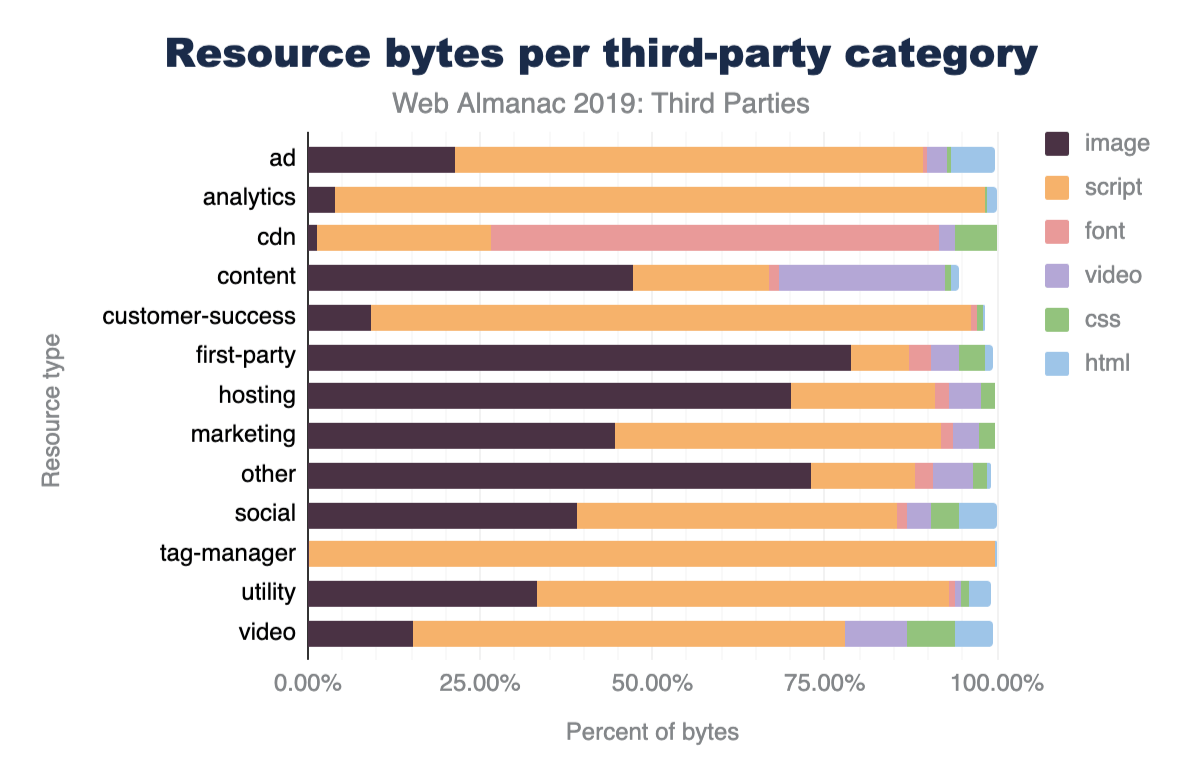
As for specific third-party providers, the same juggernauts topping the request count leaderboards make their appearance in byte weight as well. The only few notable movements are the large, media-heavy providers such as YouTube, Shopify, and Twitter which climb to the top of the byte impact charts.
Script execution
57% of script execution time is from third-party scripts, and the top 100 domains already account for 48% of all script execution time on the web. This underscores just how large an impact a select few entities really have on web performance. This topic is explored more in depth in the Repercussions > Performance section.
The category breakdowns among script execution largely follow that of resource counts. Here too advertising looms largest. Ad scripts comprise 25% of third-party script execution time with hosting and social providers in a distant tie for second at 12%.
While much could be said about every individual provider’s popularity and performance impact, this more opinionated analysis is left as an exercise for the reader and other purpose-built tools such as the previously mentioned third-party-web.
Usage patterns
Why do site owners use third-party code? How did third-party content grow to be nearly half of all network requests? What are all these requests doing? Answers to these questions lie in the three primary usage patterns of third-party resources. Broadly, site owners reach for third parties to generate and consume data from their users, monetize their site experiences, and simplify web development.
Generate and consume data
Analytics is the most popular third-party category found across the web and yet is minimally user-visible. Consider the volume of information at play in the lifetime of a web visit; there’s user context, device, browser, connection quality, location, page interactions, session length, return visitor status, and more being generated continuously. It’s difficult, cumbersome, and expensive to maintain tools that warehouse, normalize, and analyze time series data of this magnitude. While nothing categorically necessitates that analytics fall into the domain of third-party providers, the widespread attractiveness of understanding your users, deep complexity of the problem space, and increasing emphasis on managing data respectfully and responsibly naturally surfaces analytics as a popular third-party usage pattern.
There’s also a flip side to user data though: consumption. While analytics is about generating data from your site’s visitors, other third-party resources focus on consuming data about your visitors that is known only by others. Social providers fall squarely into this usage pattern. A site owner must use Facebook resources if they wish to integrate information from a visitor’s Facebook profile into their site. As long as site owners are interested in personalizing their experience with widgets from social networks and leveraging the social networks of their visitors to increase their reach, social integrations are likely to remain the domain of third-party entities for the foreseeable future.
Monetize web traffic
The open model of the web does not always serve the financial interests of content creators to their liking and many site owners resort to monetizing their sites with advertising. Because building direct relationships with advertisers and negotiating pricing contracts is a relatively difficult and time-consuming process, this concern is largely handled by third-party providers performing targeted advertising and real-time bidding. Widespread negative public opinion, the popularity of ad blocking technology, and regulatory action in major global markets such as Europe pose the largest threat to the continued use of third-party providers for monetization. While it’s unlikely that site owners suddenly strike their own advertising deals or build bespoke ad networks, alternative monetization models like paywalls and experiments like Brave’s Basic Attention Token have a real chance of shaking up the third-party ad landscape of the future.
Simplify development
Above all, third-party resources are used to simplify the web development experience. Even previous usage patterns could arguably fall into this pattern as well. Whether analyzing user behavior, communicating with advertisers, or personalizing the user experience, third-party resources are used to make first-party development easier.
Hosting providers are the most extreme example of this pattern. Some of these providers even enable anyone on Earth to become a site owner with no technical expertise necessary. They provide hosting of assets, tools to build sites without coding experience, and domain registration services.
The remainder of third-party providers also tend to fall into this usage pattern. Whether it’s hosting of a utility library such as jQuery for usage by front-end developers cached on Cloudflare’s edge servers or a vast library of common fonts served from a popular Google CDN, third-party content is another way to give the site owner one fewer thing to worry about and, maybe, just maybe, make the job of delivering a great experience a little bit easier.
Repercussions
Performance
The performance impact of third-party content is neither categorically good nor bad. There are good and bad actors across the spectrum and different category types have varying levels of influence.
The good: shared third-party font and stylesheet utilities are, on average, delivered more efficiently than their first-party counterparts.
Utilities, CDNs, and Content categories are the brightest spots on the third-party performance landscape. They offer optimized versions of the same sort of content that would otherwise be served from first-party sources. Google Fonts and Typekit serve optimized fonts that are smaller on average than first-party fonts, Cloudflare CDN serves a minified version of open source libraries that might be accidentally served in development mode by some site owners, Google Maps SDK efficiently delivers complex maps that might otherwise be naively shipped as large images.
The bad: a very small set of entities represent a very large chunk of JavaScript execution time carrying out narrow set of functionality on pages.
Ads, social, hosting, and certain analytics providers represent the largest negative impact on web performance. While hosting providers deliver a majority of a site’s content and will understandably have a larger performance impact than other third-party categories, they also serve almost entirely static sites that demand very little JavaScript in most cases that should not justify the volume of script execution time. The other categories hurting performance though have even less of an excuse. They fill very narrow roles on each page they appear on and yet quickly take over a majority of resources. For example, the Facebook “Like” button and associated social widgets take up extraordinarily little screen real estate and are a fraction of most web experiences, and yet the median impact on pages with social third parties is nearly 20% of their total JavaScript execution time. The situation is similar for analytics - tracking libraries do not directly contribute to the perceived user experience, and yet the 90th percentile impact on pages with analytics third parties is 44% of their total JavaScript execution time.
The silver lining of such a small number of entities enjoying such large market share is that a very limited and concentrated effort can have an enormous impact on the web as a whole. Performance improvements at just the top few hosting providers can improve 2-3% of all web requests.
Privacy
The abundance of analytics providers and top-heavy concentration of script execution raises two primary privacy concerns for site visitors: the largest use case of third-parties is for site owners to track their users and a handful of companies receive information on a large swath of web traffic.
The interest of site owners in understanding and analyzing user behavior is not malicious on its own, but the widespread and relatively behind-the-scenes nature of web analytics raises valid concerns, and users, companies, and lawmakers have taken notice in recent years with privacy regulation such as GDPR in Europe and the CCPA in California. Ensuring that developers handle user data responsibly, treat the user respectfully, and are transparent with what data is collected is key to keeping analytics the most popular third-party category and maintaining the symbiotic nature of analyzing user behavior to deliver future user value.
The top-heavy concentration of script execution is great for the potential impact of performance improvements, but less exciting for the privacy ramifications. 29% of all script execution time across the web is just from scripts on domains owned by Google or Facebook. That’s a very large percentage of CPU time that is controlled by just two entities. It’s critical to ensure that the same privacy protections held to analytics providers be applied in these other ad, social, and developer utility categories as well.
Security
While the topic of security is covered more in-depth in the Security chapter, the security implications of introducing external dependencies to your site go hand-in-hand with privacy concerns. Allowing third parties to execute arbitrary JavaScript effectively provides them with complete control over your page. When a script can control the DOM and window, it can do everything. Even if code has no security concerns, it can introduce a single point of failure, which has been recognized as a potential problem for some time now.
Self-hosting third-party content addresses some of the concerns mentioned here - and others. Additionally with browsers increasingly partitioning HTTP caches the benefits of loading directly from the third-party are increasingly questionable. Perhaps this is a better way to consume third-party content for many use cases, even if it makes measuring its impact more difficult.
Conclusion
Third-party content is everywhere. This is hardly surprising; the entire basis of the web is to allow interconnectedness and linking. In this chapter we have examined third-party content in terms of assets hosted away from the main domain. If we had included self-hosted third-party content (e.g. common open source libraries hosted on the main domain), third-party usage would have been even larger!
While reuse in computer technologies is generally a best practice, third parties on the web introduce dependencies that have a considerable impact on the performance, privacy, and security of a page. Self-hosting and careful provider selection can go a long way to mitigate these effects
Regardless of the important question of how third-party content is added to a page, the conclusion is the same: third parties are an integral part of the web!
