Third Parties
Introduction
Third parties are an integral part of most websites. This chapter shows that nearly all websites use at least one third party, and nearly half of all requests are third-party requests.
Website owners use third parties to delegate some complex functionality such as analytics, advertising, live chats, consent management, and others. Although website developers may not directly control third-party code, they still can influence third parties’ impact on the websites. Taking into account how widely third parties are used, they have a crucial impact on web performance. It is quite common that they block page rendering, especially on mobile devices. For instance, the average median blocking time for the top 10 most popular third parties is 1.4 seconds. Because of this, third parties can have a direct effect on Core Web Vitals and other important performance metrics like First Contentful Paint.
Many recommendations can help to eliminate the negative impact. It could be simple techniques like minifying resources or more complex ones, for example, evaluating and choosing third-party scripts that don’t serve legacy JavaScript or loading and executing third-party scripts using web workers.
This chapter focuses on the topic of how website owners and third-party developers can reduce negative third-party impact and if the best practices are followed. We start with a review of third-party prevalence and some web performance-related metrics: render-blocking time and impact on the main thread. The second half is an analysis of the best practices regarding minifying and compressing resources, third-party facades, async and defer script attributes, legacy JavaScript, and other optimization opportunities.
Definitions
A third party is an entity outside the primary site-user relationship. It involves the aspects of the site not directly within the control of the site owner but with their approval. Third-party resources are:
- Hosted on a shared and public origin
- Widely used by a variety of sites
- Uninfluenced by an individual site owner
Some examples of third parties include Google Fonts, the jQuery library served over public origin, and embedded YouTube videos.
To match the definition, only third parties originating from a domain whose resources can be found on at least 50 unique pages in the HTTP Archive dataset were included.
In the case where third-party content is served from a first-party domain, it is counted as first-party content. For example, self-hosting Google Fonts or bootstrap.css is counted as first-party content. Similarly, first-party content served from a third-party domain is counted as third-party content—assuming it passes the “more than 50 pages criteria”.
Third-party categories
We are relying on the third-party-web repository from Patrick Hulce to help us identify and categorize third parties. This repository breaks down third parties by the following categories:
- Ad - These scripts are part of advertising networks, either serving or measuring.
- Analytics - These scripts measure or track users and their actions. There’s a wide range in impact here depending on what’s being tracked.
- CDN - These are a mixture of publicly hosted open source libraries (e.g. jQuery) served over different public CDNs and private CDN usage.
- Content - These scripts are from content providers or publishing-specific affiliate tracking.
- Customer Success - These scripts are from customer support/marketing providers that offer chat and contact solutions. These scripts are generally heavier in weight.
- Hosting* - These scripts are from web hosting platforms (WordPress, Wix, Squarespace, etc.).
- Marketing - These scripts are from marketing tools that add popups/newsletters/etc.
- Social - These scripts enable social features.
- Tag Manager - These scripts tend to load lots of other scripts and initiate many tasks.
- Utility - These scripts are developer utilities (API clients, site monitoring, fraud detection, etc.).
- Video - These scripts enable video player and streaming functionality.
- Consent provider - These scripts allow sites to manage the user consent (eg. for the General Data Protection Regulation compliance). They are also known as the ’Cookie Consent’ popups and are usually loaded on the critical path.
- Other - These are miscellaneous scripts delivered via a shared origin with no precise category or attribution.
Note: The CDN category here includes providers that provide resources on public CDN domains (e.g. bootstrapcdn.com, cdnjs.cloudflare.com, etc.) and does not include resources that are simply served over a CDN. For example, putting Cloudflare in front of a page would not influence its first-party designation according to our criteria.
- The same as in the previous year, the Hosting category is removed from our analysis. For example, if you happen to use WordPress.com for your blog, or Shopify for your e-commerce platform, then we’re going to ignore other requests for those domains by that site as not truly “third-party” as they are, in many ways, part of hosting on those platforms.
Caveats
- All data presented here is based on a non-interactive, cold load. These values could start to look quite different after user interaction.
- The pages are tested from servers in the U.S. with no cookies set, so third parties requested after opt-in are not included. This will especially affect pages hosted and predominantly served to countries in scope of the General Data Protection Regulation, or other similar legislation.
- Only the home pages are tested. Other pages may have different third-party requirements.
- Some of the lesser-used third-party domains are grouped into the unknown category.
- We are leveraging different Lighthouse audits. Some of them have limited coverage. Namely, it is not feasible to cover all existing facade implementations in the third-party facades audit.
Learn more about our Methodology.
Prevalence
The prevalence of third parties remained at the same high levels as the previous year: 94% of websites use at least one third party.
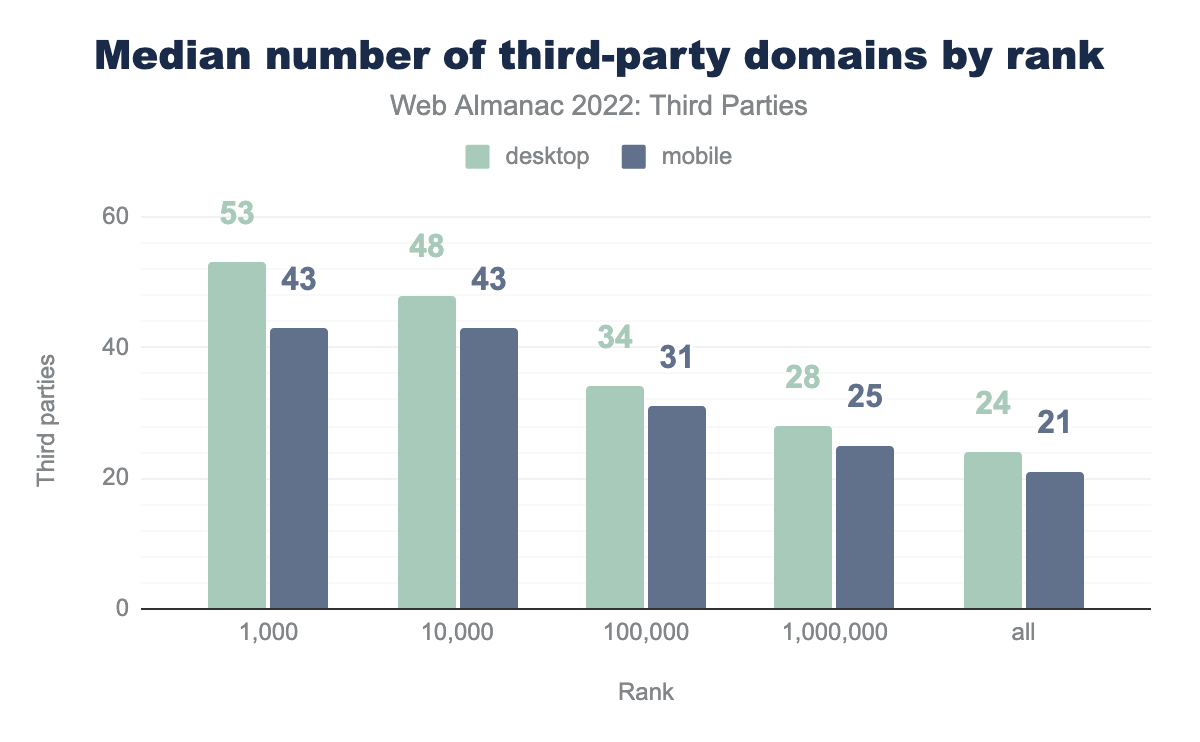
The figure above shows the number of third-party domains for the most-used websites. For example, on average the top 1,000 popular websites use 43 third-party domains on mobile and 53 on desktop devices. More popular websites seem to have a larger number of third-party domains, i.e. the top 1,000 sites have twice more third parties than the median number of third parties for all websites. This large number is explained by the fact that some third-party providers might have content hosted on multiple domains, for example, Yahoo serves their content from mempf.yahoo.co.jp, yjtag.yahoo.co.jp, etc. Though the exact number of third-party providers is still a subject for further research, the current data about third-party domains gives an overview of how much they might affect time spent on network requests. As every request to a new domain takes time for DNS lookup and establishing an initial connection, the more third party domains are used the more it might affect page loading speed.
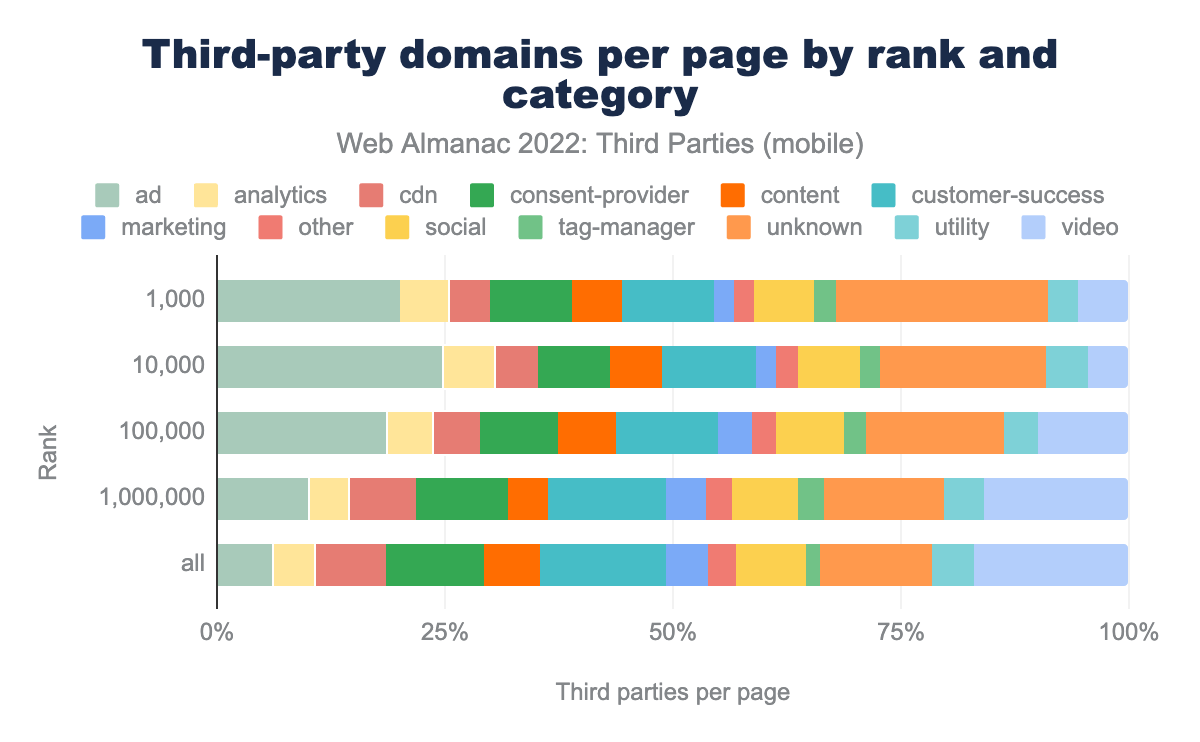
When looking at the distribution of third parties by category and by rank, it becomes clear that the increase in the number of third parties on more popular websites is mostly made up of the ad and unknown (i.e. unclassified) third-party categories. That means the third parties—especially ads—have a crucial impact on the users because they are more used on websites with a larger number of users.
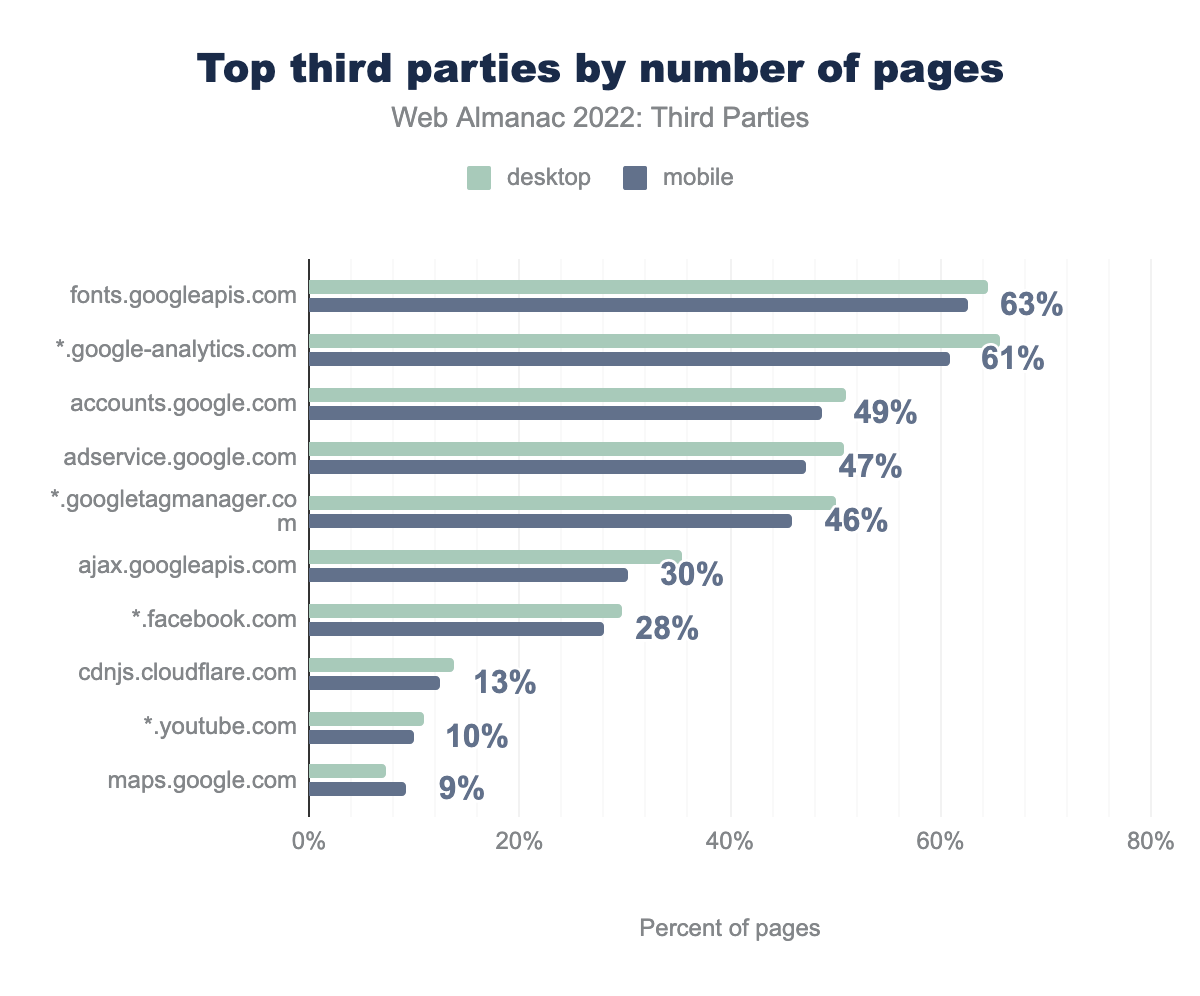
Google services: fonts, analytics, account management, advertising, and tag management, are the most popular third parties across the entire web. 63% of all pages use Google Fonts which is over 4.9 million pages out of the 7.9 million mobile pages in our dataset!
Third-party requests account for 45% of all requests made by websites, and of those third-party requests, approximately one-third are scripts. This suggests it is worthwhile analyzing scripts in more detail in the best practices section.
Performance impact
Some third parties might inevitably block page rendering and negatively affect the web page loading experience. Lighthouse has a render-blocking resources audit, that provides data about render-blocking time.
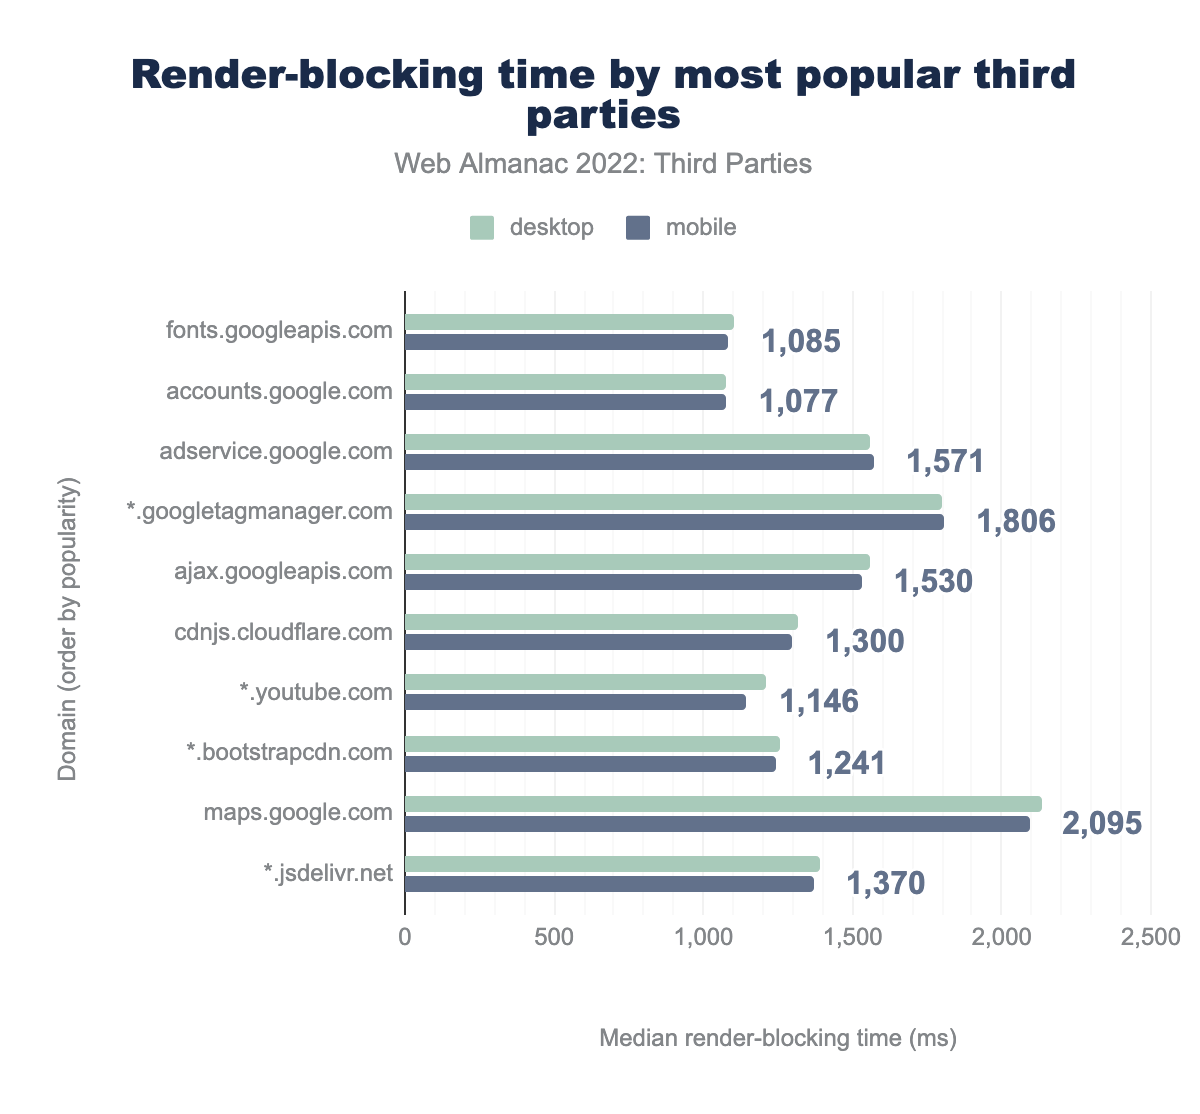
The figure above shows the median render-blocking time for the top 10 most popular third parties. Google maps have the most significant impact on rendering time. It accounts for more than 2 seconds for the median website. That is a significant impact taking into account that the recommended time for First Contentful Paint—a page load speed metric—is 1.8 seconds.
A website can save a lot of loading time by eliminating render-blocking resources. There are many methods to embed third parties in a non-blocking way. For example, in the case of Google Maps, the Maps Static API could be used to implement a third-party facade. Also, the third-party iframes can be lazy-loaded.
Additionally, third-party scripts compete for the main thread resources with the website’s first-party code. If a third-party has a long-running JavaScript task that runs on the main thread for more than 50 ms, it is considered to be “blocking the main thread”. It can significantly influence user experience when interacting with a page as the main thread is responsible for processing user events, as well as rendering the page. When it is blocked, a user suffers from a non-responsive page.
We inspected the third party summary audit to emulate main-thread blocking time caused by third parties.
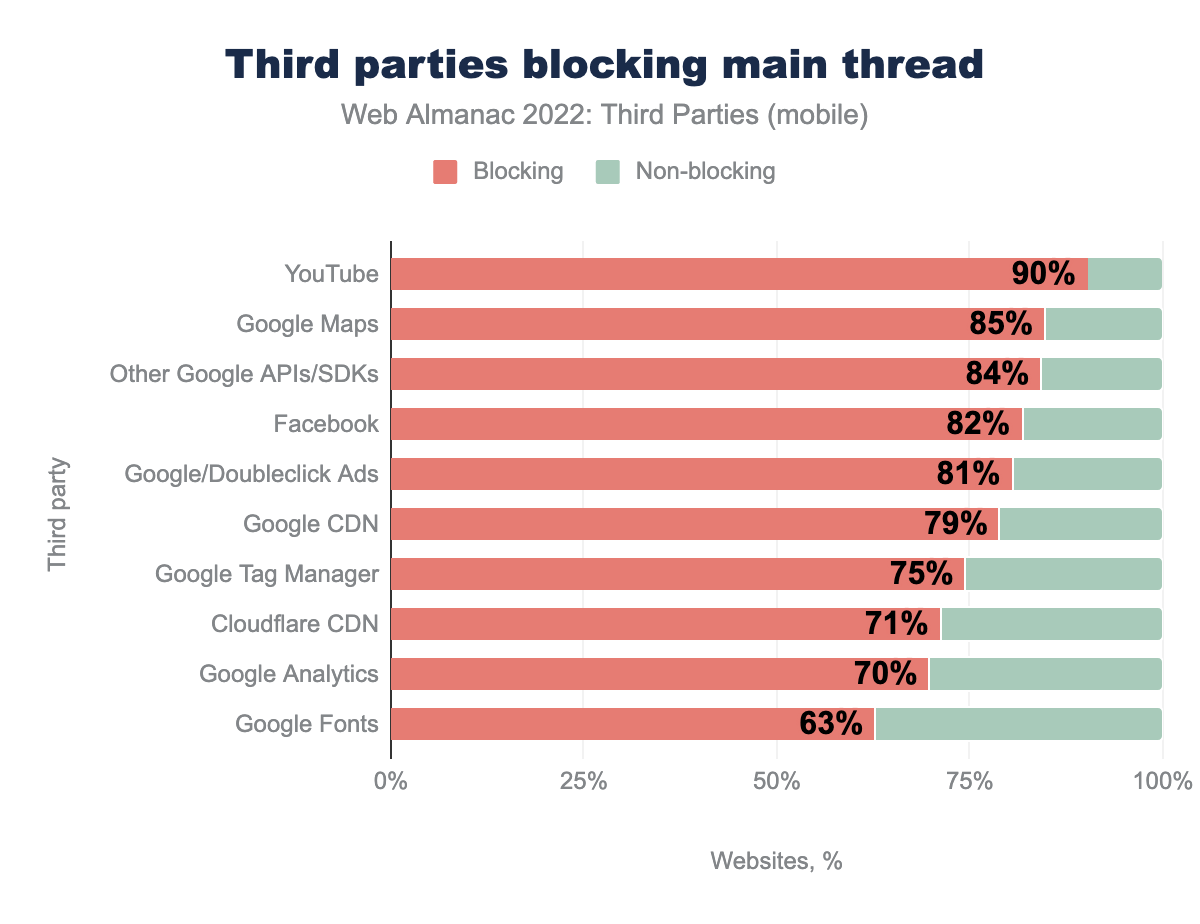
The figure above presents the top 10 most-used third parties and their impact on the main thread on mobile devices. Note that for desktop devices the impact is much lower. For example, YouTube blocks the main thread for 90% of the mobile websites while blocking only 26% of desktop websites it is embedded on. This is logical taking into account that desktop devices are much more powerful. However, nowadays mobile user experience is very important and—according to the Mobile Web chapter—58% of website visits are coming from mobile devices.
To examine in more detail how the website users could be affected by the main thread blocking third-party, we can review the median main thread blocking time.
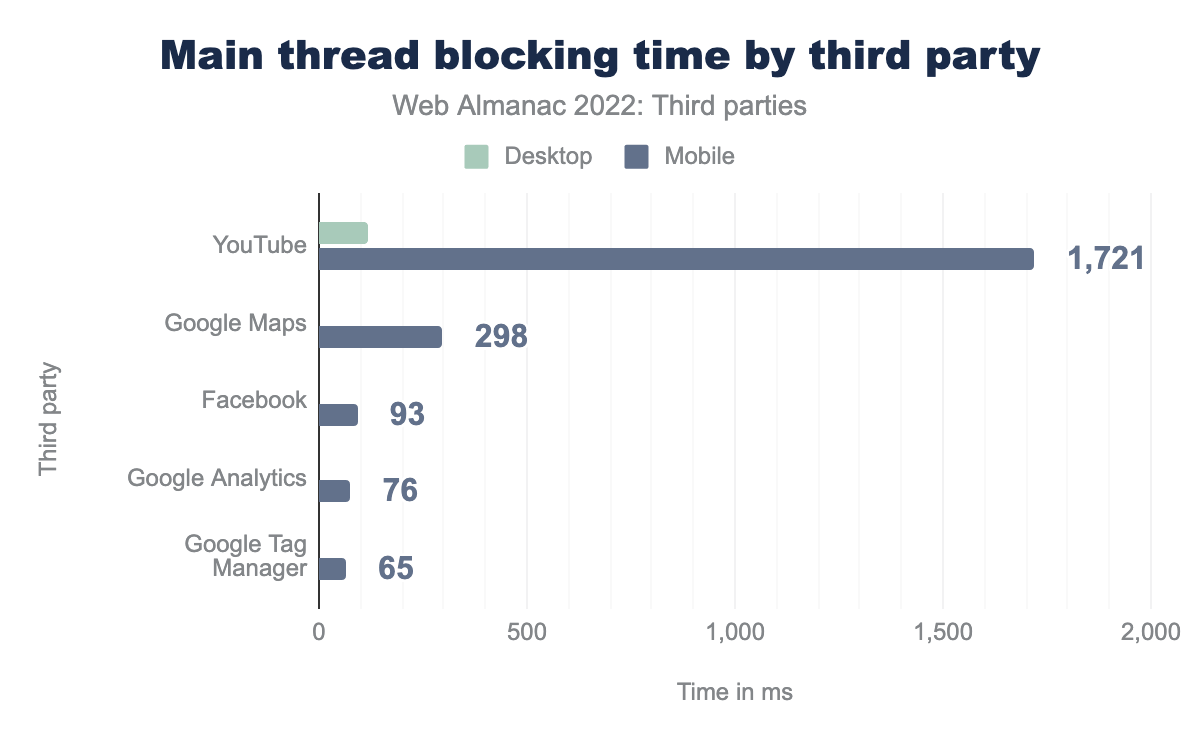
YouTube is the most blocking third party among the top 5 most-used third parties. It blocks the main thread for more than 1.7 seconds for the median website that loads YouTube videos—based on the mobile device we emulate as part of our crawl. There is a notable gap between desktop and mobile websites as the desktop websites are almost completely unaffected.
Note that Lighthouse might mark some third parties as potentially render-blocking while their size is so small that they don’t have any tangible effect on the render-blocking time. This is the case for third parties like Google Fonts or Google/Doubleclick Ads whose median render-blocking time is 0 milliseconds.
A blocked main thread has a big impact on the First Input Delay (FID) and Interaction to Next Paint (INP) performance metrics. To provide good web page responsiveness, FID should be 100ms or less and INP below 200ms. There is research by Annie Sullivan about the correlation between Total Blocking Time and Interaction to Next Paint on mobile devices. It shows that the smaller the main thread blocking time, the more likely the sites meet good INP and FID thresholds. That leads to the conclusion that it becomes harder to achieve good core web performance metrics if third parties are blocking the main thread for such a long time, as in the YouTube example. Moreover, other third-party and first-party assets might also contribute to the render-blocking effect. Despite this, there are many ways to minimize the render-blocking effect of third parties. This will be further explored in the next section.
Web performance best practices
The previous section confirmed that the third parties are potentially causing a huge performance impact that can affect the entire website experience. However, website and third-party developers can follow many best practices to minimize third-party performance impact from minifying resources to using third-party facades. We looked at different third party usage trends to understand how the best practices are followed.
Minifying resources
Minifying JavaScript and CSS files is one of the first recommendations when speaking about web performance. To check how third-party resources are minified we are making use of the following Lighthouse audits: Unminified JavaScript and Unminified CSS.
Minifying scripts should have a large positive impact as they are the most popular third-party content type. Moreover, compared to other content types like CSS, scripts tend to be a lot more verbose, with comments and large variable names that affect the file size.
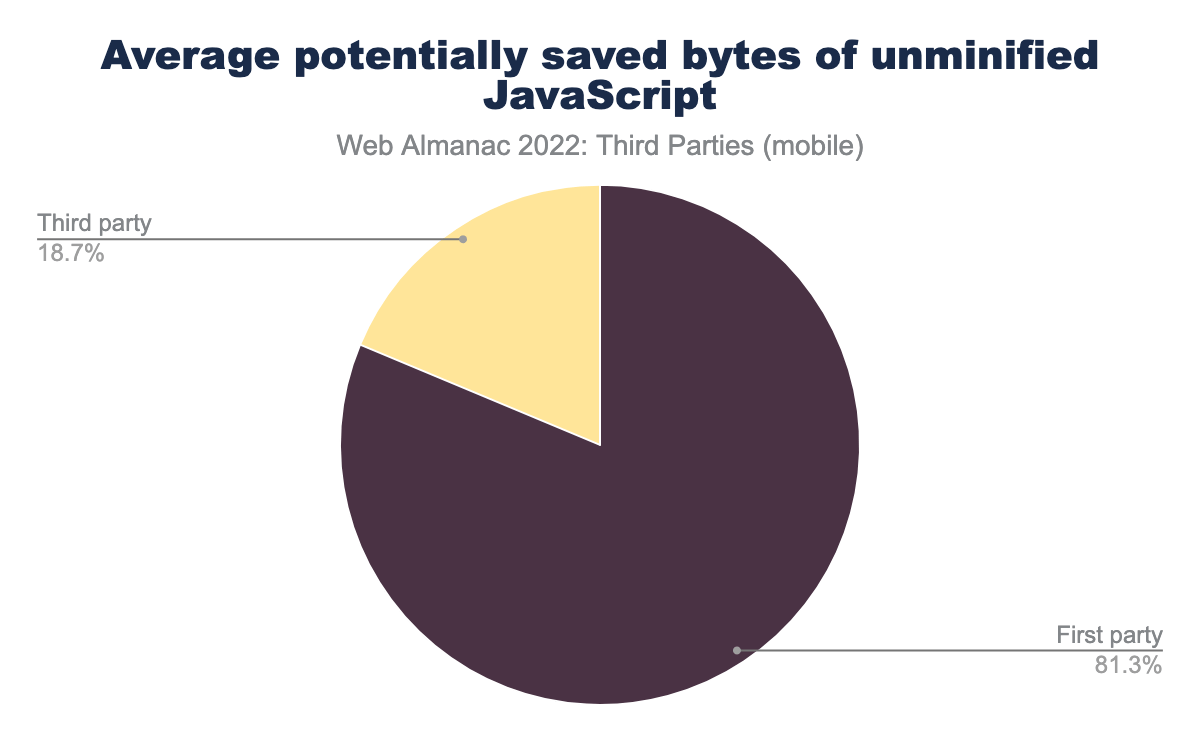
Although some JavaScript bytes could be saved by minifying third-party resources, the first-party scripts are still responsible for the largest amount of unminified JavaScript on the websites, i.e. 81% of the average total potentially saved bytes. The distribution of unminified JavaScript shows that for 75% of websites total potential savings could achieve 34.5 KB of savings while savings from third parties are only 2.8 KB.
The next figure displays the size of potential savings by a third-party. It is important to note that the methodology used only includes third parties that come from external domains and does not count third-party content hosted by a first party, for example libraries imported as node modules.
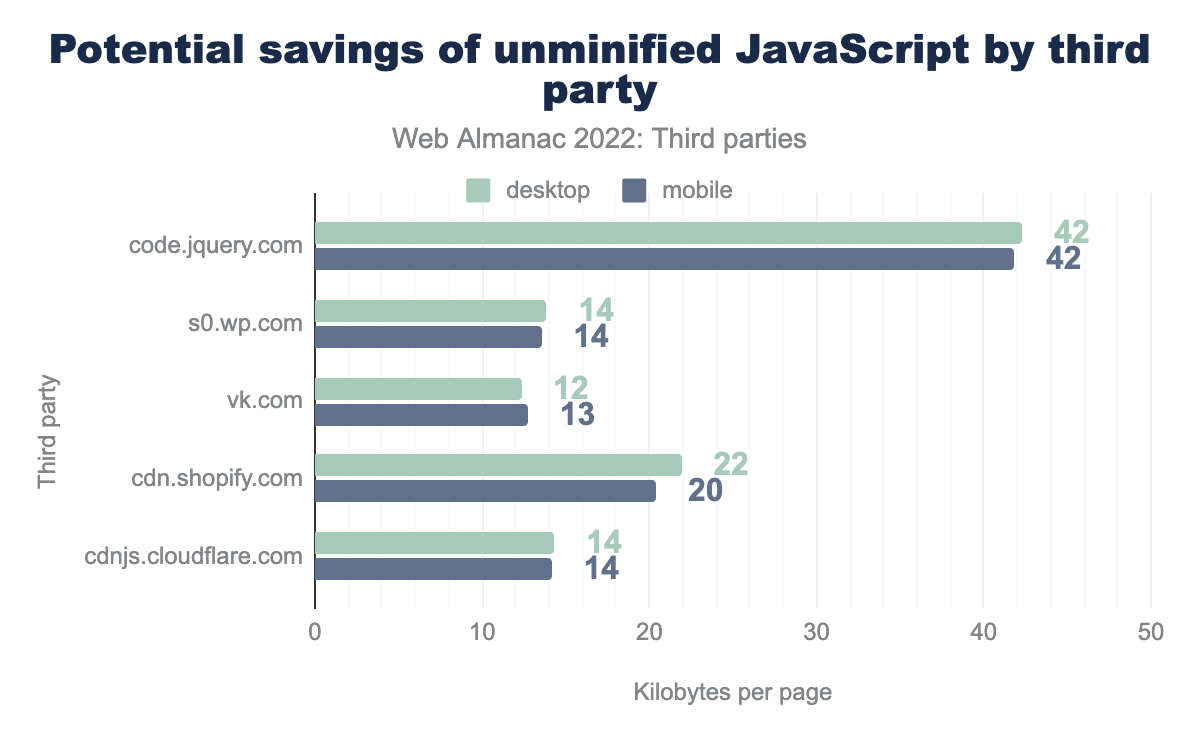
code.jquery.com are 42 kilobytes for mobile pages, from s0.wp.com 14 kilobytes, from vk.com 13, from shopify.com 20 and from cloudflare.com 14 kilobytes for desktop and mobile pages is almost identical.The code.jquery.com CDN library for jQuery is the most popular JavaScript third-party library being used on 6% of all websites on desktop (note that jQuery is used on far more websites, but not all uses are served from this CDN). On average 43 KB of data per page that has unminified jQuery could be saved by using the minified version of its resources, which are available on this CDN.
17% of the websites that use jQuery hosted on a third-party domain fail the Lighthouse audit for unminified JavaScript. Digging deeper into how the library is imported shows that many websites are using the unminified versions of jQuery that should only be used for development purposes. A similar tendency can be found in the usage of some other less popular third-party scripts.
This should serve as a reminder for web developers to check if the third-party scripts imported on their websites are optimized for production environments.
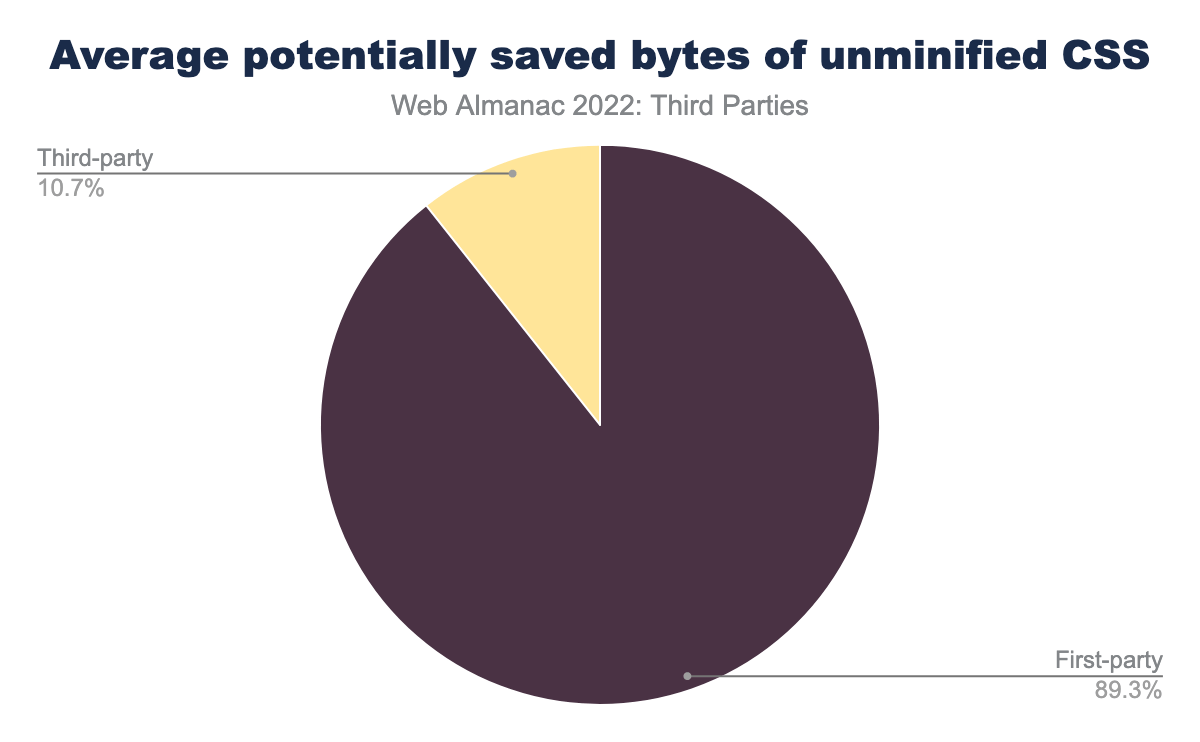
The unminified CSS audit shows that third-party assets have a much smaller impact, especially when compared with the first-party average of potentially saved bytes of CSS code, which is 89% of the total average potentially saved bytes. This data demonstrates that third-party CSS content is well minified and has a much lower impact than first-party CSS.
Google fonts are the most-popular third party on mobile devices being used by 62.6% of all websites. The CSS they provide is not minified. The data shows the average page which has Google Fonts could save 13.3 KB from minifying it. This would seem like an opportunity for improvement. However, their CSS contains a number of very similar font-face definitions that are almost identically repeated in the case of many fonts, so HTTP-level compression will work really well here and significantly reduce the file size, even without minification. This makes the benefits of minifying very low, compared to the code readability for those wanting to see the CSS to potentially replicate locally. Other third parties with more complicated and larger CSS, may benefit from minification considerably more.
Compressing resources
Compressing files is another quick win that third-party developers can do to have a positive impact on web performance. Most heavy content types like scripts and CSS have a good compression coverage. Only 12% of scripts and 4.5% of CSS files of total third-party requests are not compressed.
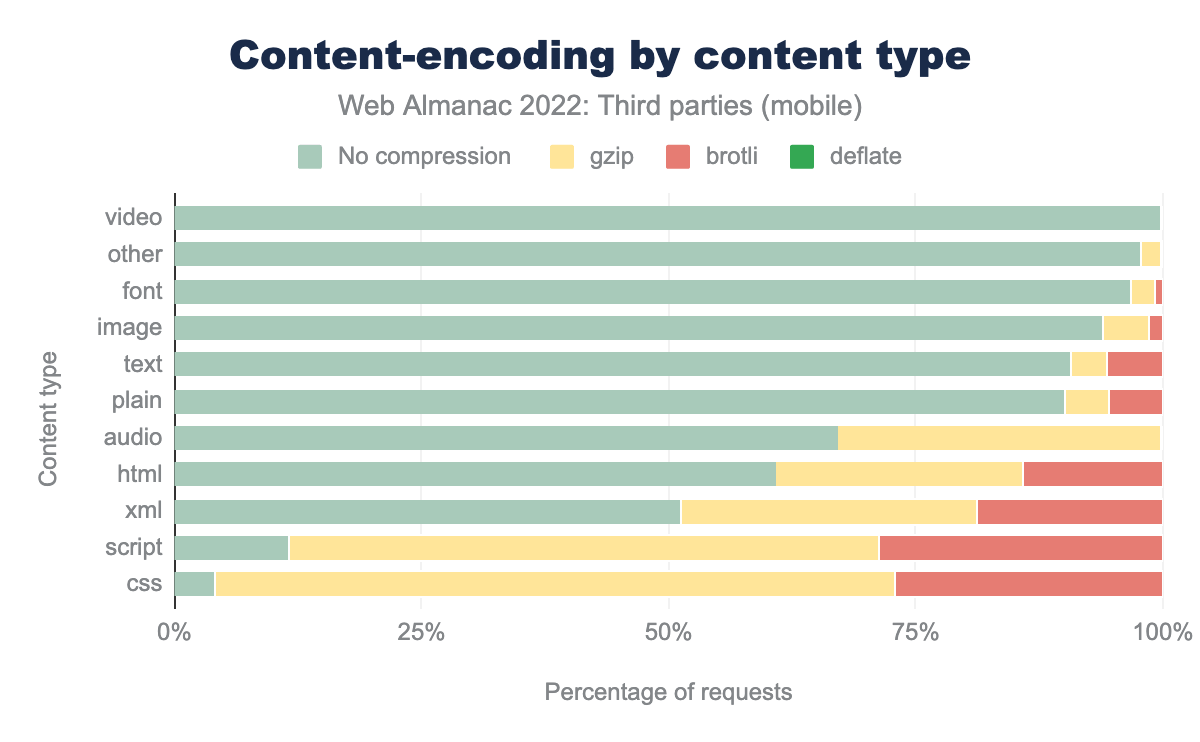
Website content-encoding data displayed in the above figure revealed an interesting fact about image compression. Even though image formats like JPEG, PNG, WebP, AVIF, and others provide compression under the hood as part of their formats, 5.2% of image content is compressed again using Gzip or Brotli compression. Adding additional layers of compression on top of the standard image compression formats is usually unnecessary and may lead to increased file size and add extra load on the CPU when uncompressing the image.
Gzip is still the most popular compression type, i.e. 59% of scripts and 68% of CSS are compressed with Gzip. However, Brotli compression is more effective. The trends among first and third parties show that usage of Brotli compression has grown in the past 3 years, while no compression and Gzip have fallen.
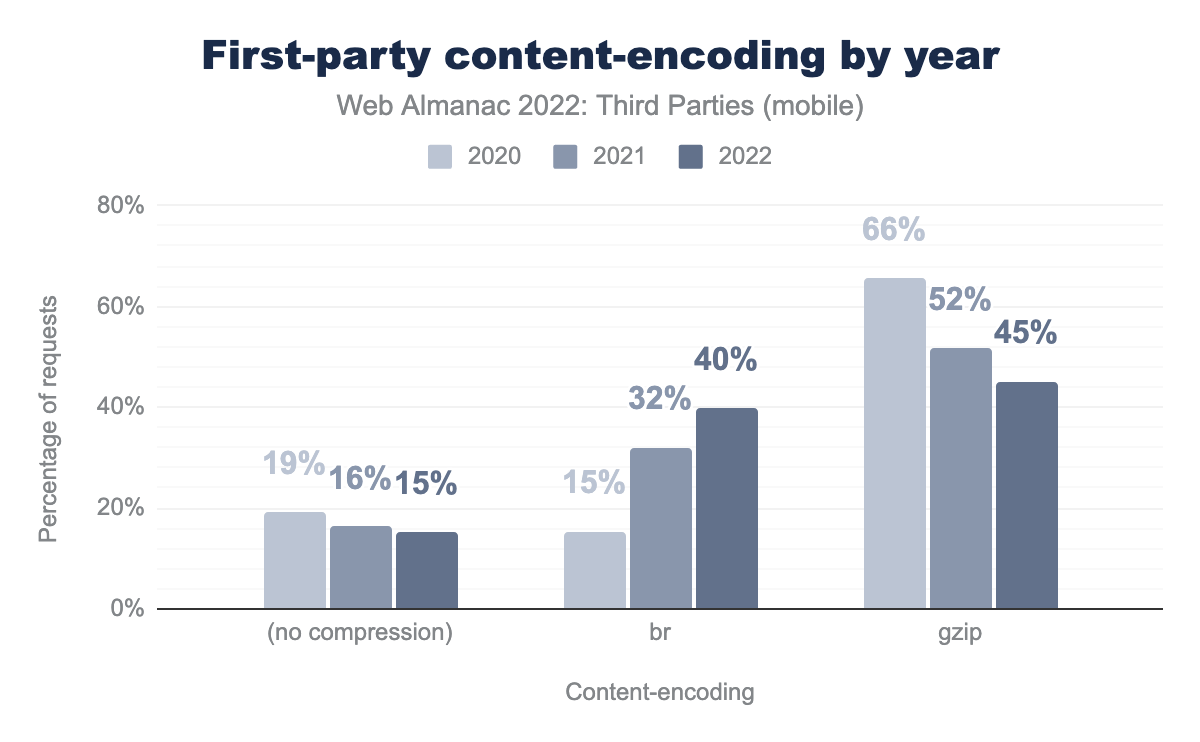
The rate of first-party scripts compressed via brotli almost tripled, increasing from 15% to 40%.
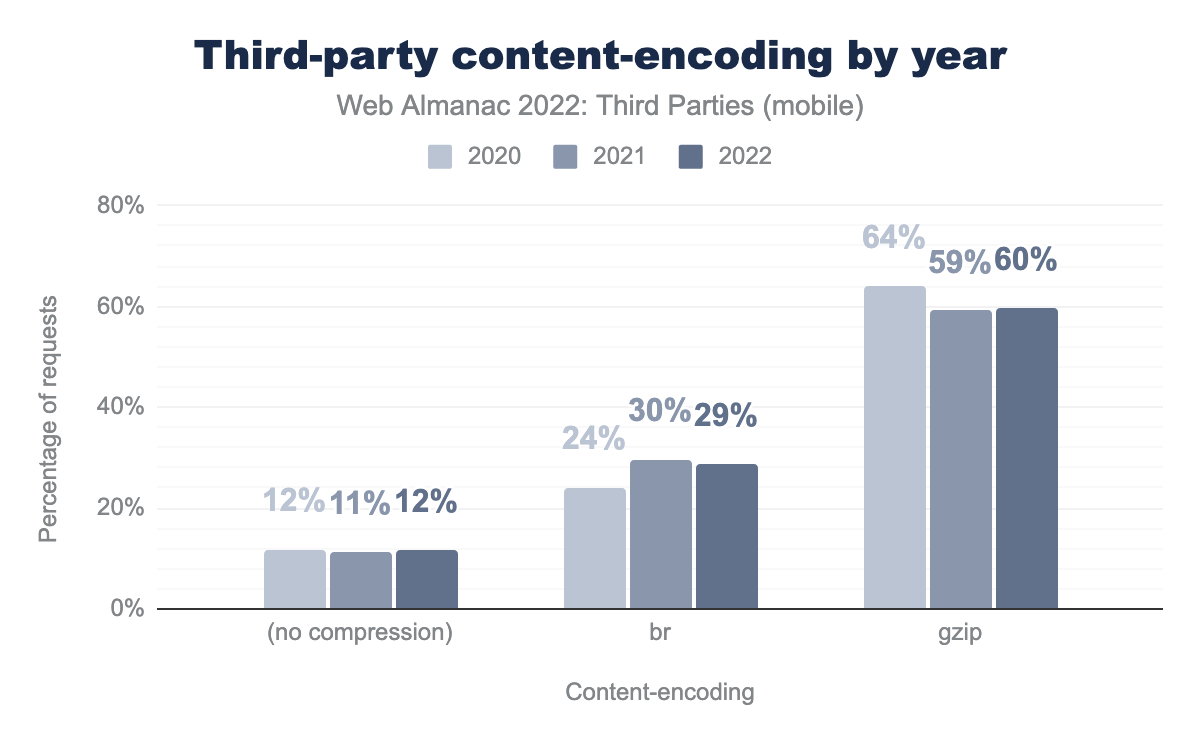
However, Brotli adoption among third parties stayed more or less at the same level, changing from 24% to 29%. Despite the slight positive tendency, there is still room for improvement of Brotli adoption for third parties.
Usage of third-party facades
There are multiple techniques to eliminate render-blocking resources. One of them is third-party facades that are useful for visual content like YouTube videos or interactive widgets like a live chat. They help to exclude third parties from the critical loading sequence and lazy load them. Lighthouse has introduced an audit Lazy load third-party resources with facades. There are multiple third-party facade solutions, for example, lite-youtube-embed, lite-youtube, or some custom approaches, and only a small number of them are in the list of third parties checked during the audit. This limitation makes it complicated to assess third-party facade usage across the web at this time.
Usage of async and defer
Using async and defer is another technique that could be used by website developers to optimize the loading of render-blocking third-party scripts.
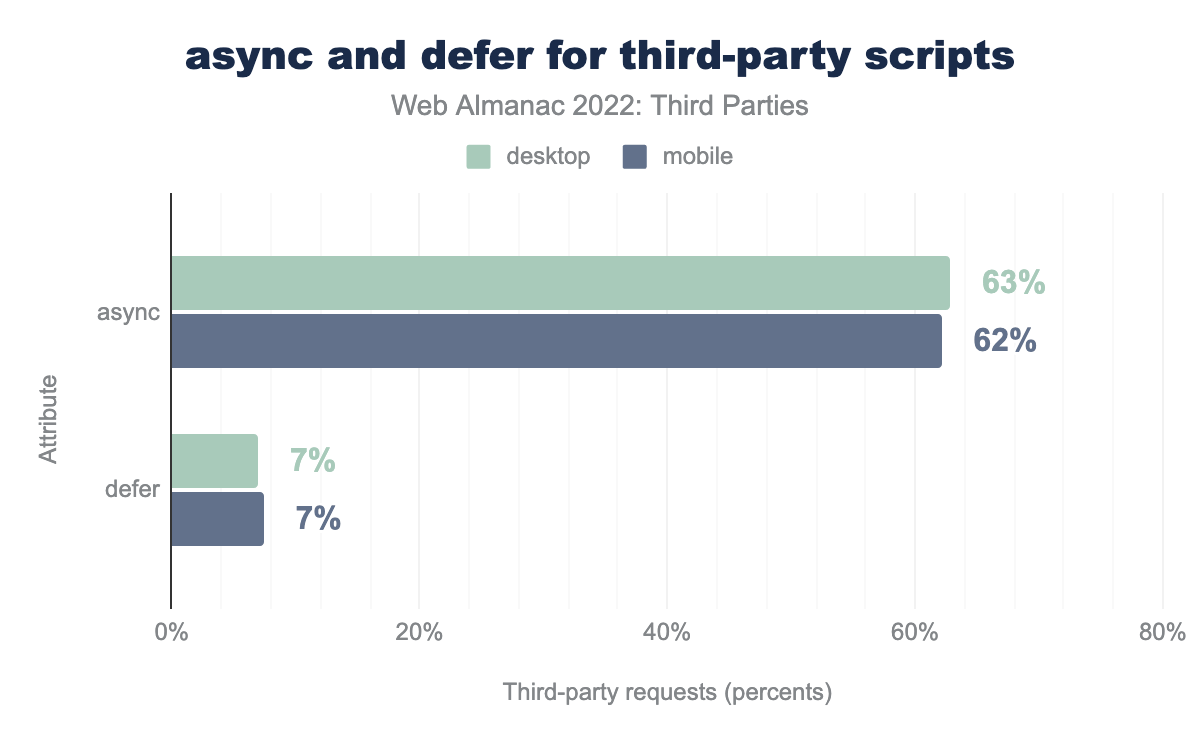
async attribute and 7% defer attribute on mobile pages. Data for desktop pages is very similar.async and defer attributes.
The async attribute is considerably more popular than defer. It is used for 62% of total third-party scripts on mobile devices. Usage of the async attribute can still result in a render-blocking script as its execution can start during HTML parsing. The async attribute is useful for critical resources that are important during the page loading and can interrupt rendering.
The fact that async is more used demonstrates that third-party scripts are mostly treated as critical resources. Although this is true for some scripts, many third parties, for example, a video player is less critical. Deferred scripts potentially have a better impact on page rendering time which is reflected in core web performance metrics like Largest Contentful Paint. Website developers should consider using defer for third-party assets that are not important for the critical rendering path.
Which resources are critical and which could be deferred might be a tricky question to consider, especially when considering Consent Management third parties that enable other third parties to be used. For example, analytics scripts are usually considered important for site owners but can’t be used without the user’s consent in countries with GDPR or similar legislation, making user consent third-party critical. Loading consent third-party resources in a critical path may result in a bad user experience causing Cumulative Layout Shifts and First Input Delay. Therefore, developers should strive for a balance between the way third parties are loaded and a good user experience.
Legacy JavaScript
Despite JavaScript’s rapid involvement, the prevalence of legacy code is still significant. We are using one of the Lighthouse audits to check how many third parties are serving legacy JavaScript to modern browsers.
In general, third parties account for 59% of Lighthouse legacy JavaScript audit failures. A closer look into the audit results highlights the top 5 third-party script providers that include legacy JavaScript.
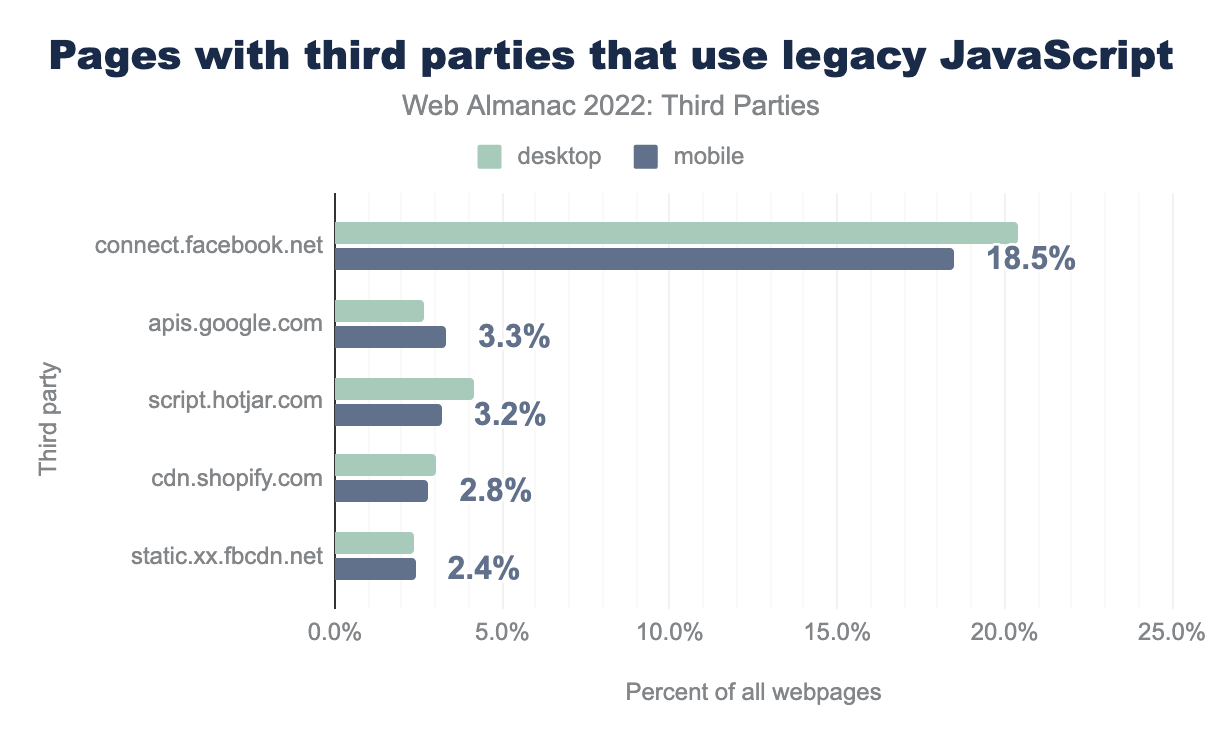
Facebook is a third-party with legacy JavaScript that affects the most pages. It introduces legacy code to around 20% of the total number of web pages on mobile and desktop devices correspondingly when looking at both facebook.net and fbcdn.net from the above graph. Nowadays, when old browsers like Internet Explorer may no longer need to be supported, the necessity to keep legacy JavaScript becomes lower. Despite this fact, the trends of using Facebook resources that have legacy JavaScript in the past 3 years reveal that the numbers actually increased—from around 14% in 2020 to 18% in 2022 for facebook.net alone. This is due to the increasing number of websites that embed this third party.
Serving legacy JavaScript to modern browsers results in a larger amount of redundant and slower code. We can look into this more by analyzing the size of unused JavaScript.
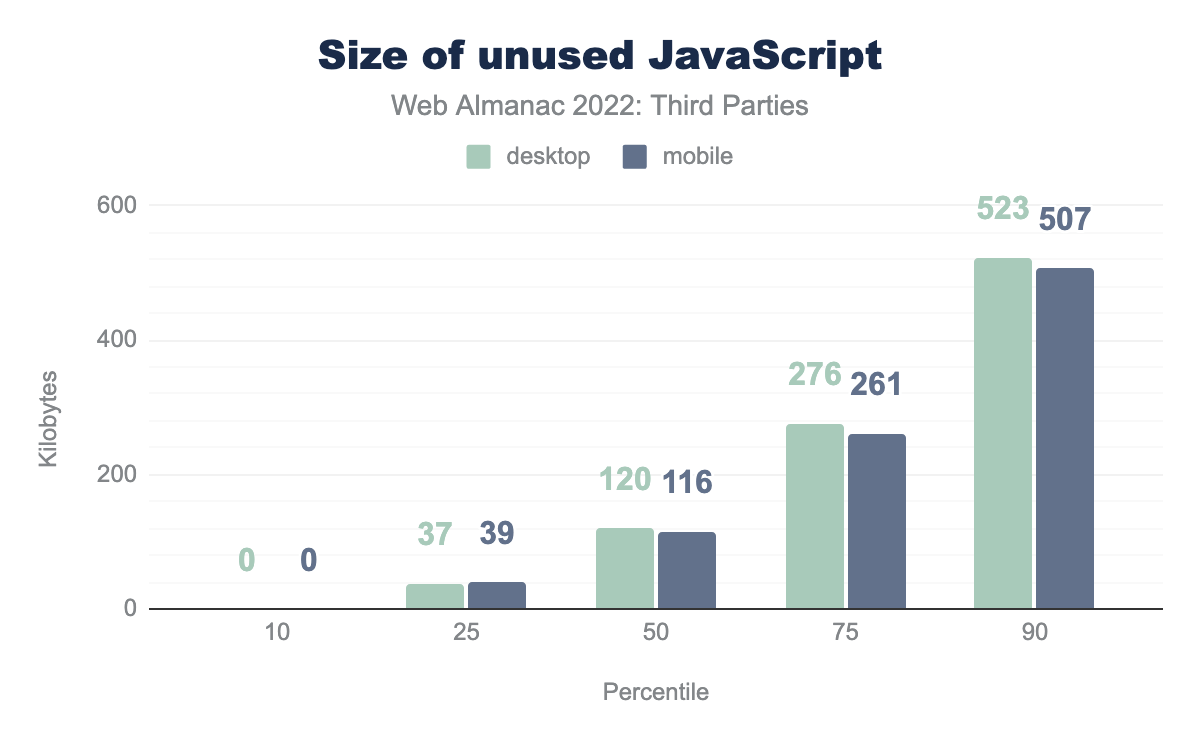
The median amount of unused third-party JavaScript is approximately 120 KB. For 25% of websites that use third-party scripts, it is more than 261 KB.
Unfortunately, website owners do not always have the possibility to change the way third-party JavaScript is bundled. However, if the third-party dependencies are self-hosted they can be optimized during development by adopting modern script bundling approaches that could help to reduce the amount of unused code.
Other optimization technologies
One of the third-party resource management problems is that sometimes it can skip the development team and be added using tag management tools without proper web performance evaluation. As a result, third-party scripts can uncontrollably affect the page loading and responsiveness experience.
Some modern third-party loading and execution solutions have appeared in recent years. For example, Partytown is a library that relocates third-party scripts into the web worker to free up the main thread for first-party code. Currently, the library is in the early adoption stage and its usage is very low. Only 70 websites from the whole dataset are using it in 2022. However, the Next.js framework has started to introduce this solution that could increase Partytown’s popularity.
The previous sections showed that the responsibility for third-party negative impact is split between first and third-party developers. However, browsers are also showing interest in optimizing the loading of third-party resources. The proposals include better real user monitoring and developer tooling providing more data about the impact of third parties on their websites.
That might be challenging to achieve given only 25% of total third-party requests provide the Timing-Allow-Origin (TAO) header that is important for third-party web performance data transparency.
Taking into account that the TAO header prevalence has not improved in comparison to the previous years, we would encourage third-party providers to use it more actively, to allow first parties to get more accurate insights into the performance of these resources.
Conclusion
Third parties are often associated with a negative impact on website performance. Indeed some account for notable rendering and main thread blocking time, especially on mobile devices, which are increasingly the more popularly used devices. However, the main goal of this chapter is to show that the responsibility for third-party impact on web performance is shared between third-party providers and website owners. There are lots of opportunities for website developers to lower the third-party impact on their websites. In the future, browsers also might look to automatically apply third-party resource optimizations.
We have analyzed data related to different web performance recommendations, including compressed and minified resources, legacy APIs, unused JavaScript, etc. Based on the findings, we have conducted the following action points that could be helpful for website and third-party developers to improve the user experience:
- Load third-party resources suitable for production environments where the assets are minified and compressed.
- Leverage different third-party facade techniques, especially for “heavy” content like videos, maps, and live chats, that can block render and have a crucial impact on First Contentful Paint.
- While evaluating third-party candidates, ensure that they are not serving legacy APIs except where necessary.
- Consider how critical third-party content is for the page and load the non-critical resources using the
deferattribute when it is not render-blocking. - Explore modern third-party load and execution strategies.
- Choose Brotli compression over gzip.
There are many more optimization opportunities out there! We encourage web developers to take them so that functionality provided by third parties would serve websites without harming the user experience.
