SEO

Introduction
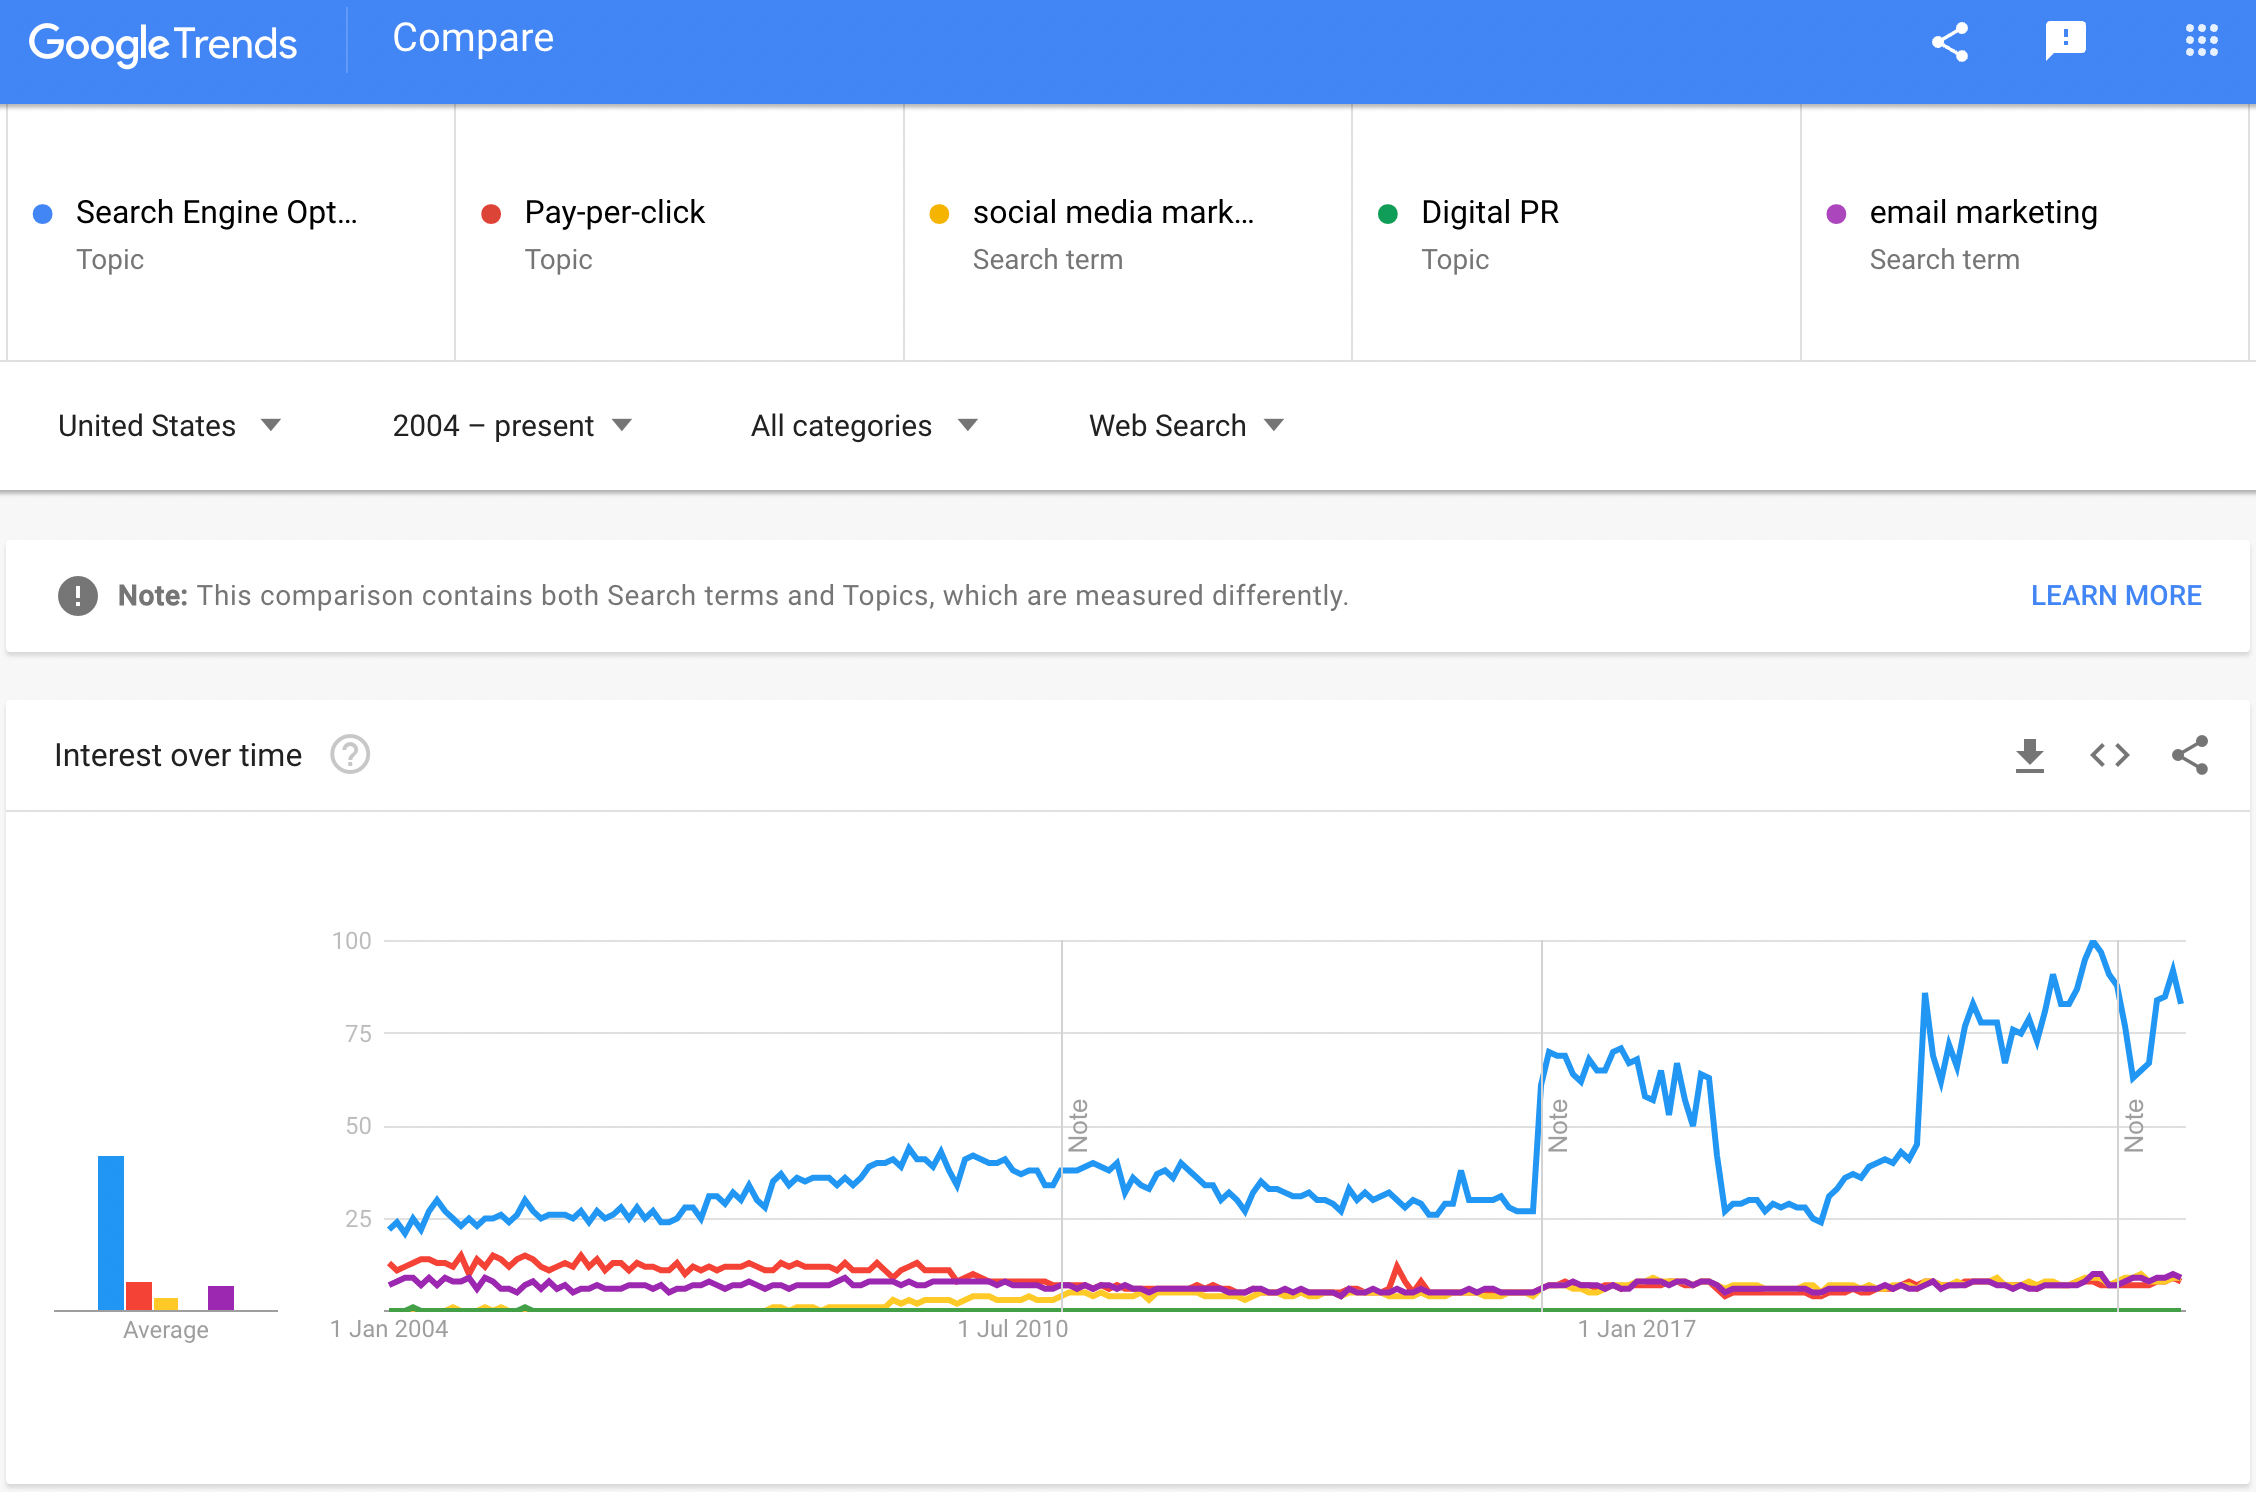
Search engine optimization (SEO) is a digital technique used to improve a website or page’s visibility so that it organically ranks higher in search engine results. It often combines technical configuration, content creation, and link acquisition, with the goal of improving relevance for a searcher’s query and intent. SEO has continued to grow in popularity and become one of the most popular digital marketing channels.
With custom metrics that expose some new, never-before-seen insights, we have analyzed more than eight million home pages across the web, comparing our findings to those from 2021 and, in some instances, from 2020. Note: Our data, particularly from Lighthouse and the HTTP Archive, is limited to just websites’ home pages, not site wide crawls. Learn more about these limitations in our Methodology.
Read on for more about how search engine-friendly the web is.
Crawlability and indexability
Crawling and Indexing are the backbone of what Google and other search engines ultimately display on their search results pages. Without them, ranking simply cannot happen.
The first step in the process is discovering web pages via crawling. While numerous pages are crawled, fewer of them are actually indexed, which is essentially stored and categorized in a search engine’s database. Based on a searcher’s query, matching indexed pages are then served.
This section deals with the state of the web, as it pertains to bots crawling and indexing websites. What directives are sites giving search engines bots? What are sites doing to ensure Google serves the right page and not a near duplicate in search results?
Let’s explore the web and some of its facets that impact crawlability and indexability.
Robots.txt
The robots.txt file instructs bots, including search engine crawlers, as to where they can and cannot go, meaning what they can or cannot crawl.
Robots.txt status codes
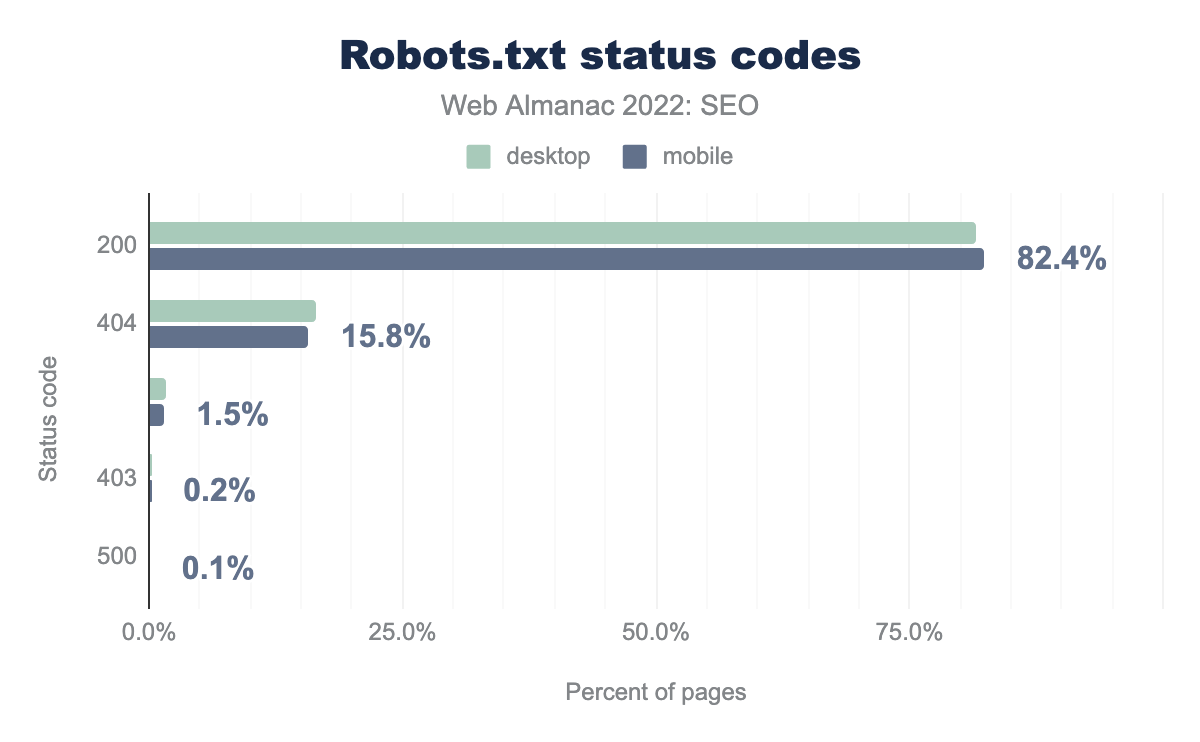
There has been a nominal increase in the percentage of sites whose robots.txt files return a 200 status code in 2022 compared to 2021. In 2022, 81.5% of robots.txt files for desktop sites returned a 200 status code while 82.4% of mobile sites returned the same. This stands in comparison to 81% and 81.9% of robots.txt files on desktop and mobile sites, respectively, returning a 200 status code in 2021.
Concurrently, there was just a small reduction in the percentage of robots.txt files returning a 404 status code in 2022 compared to 2021. Last year, 17.3% of robots.txt files for desktop sites returned a 404 while 16.5% of mobile sites’ robots.txt files returned that status code. In 2022, it’s just 16.5% for desktop and 15.8% for mobile sites’ robots.txt files that are returning a 404 status code.
Like in 2021, the remaining status codes are associated with a minimal number of robots.txt files.
Note: The above data does not indicate how well optimized a robots.txt file is. Even a file returning a 200 status code can contain directives that are perhaps not in the best interest of a site’s overall health.
Robots.txt size
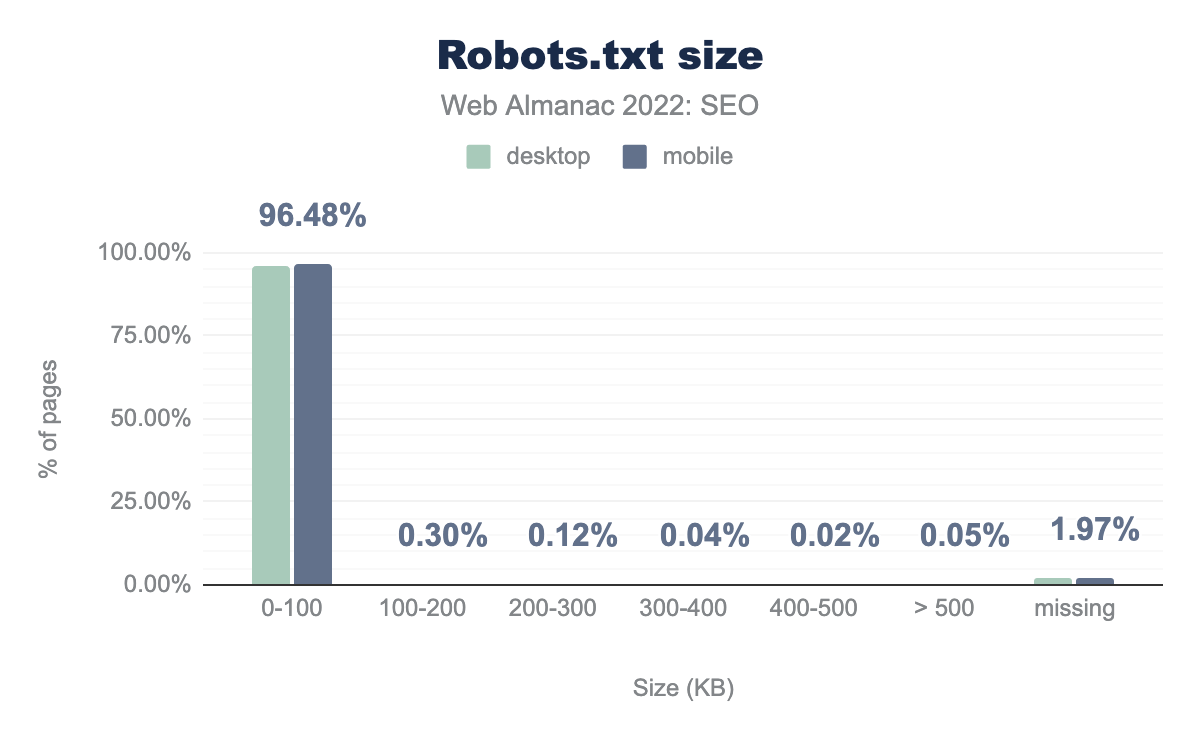
As expected, the overwhelming majority of robots.txt files were quite small, weighing between 0-100 KB.
Google’s max limit for a robots.txt file is 500 KiB. Any directives found after the file reaches that limit are ignored by the search engine. A very small number of robots.txt files fall into that category. Specifically, just .005% of both desktop and mobile sites contain a robots.txt file that is above Google’s max limit (which is consistent with 2021’s data). In cases where the file size exceeds limits, Google recommends consolidating directives.
Robots.txt user-agent usage
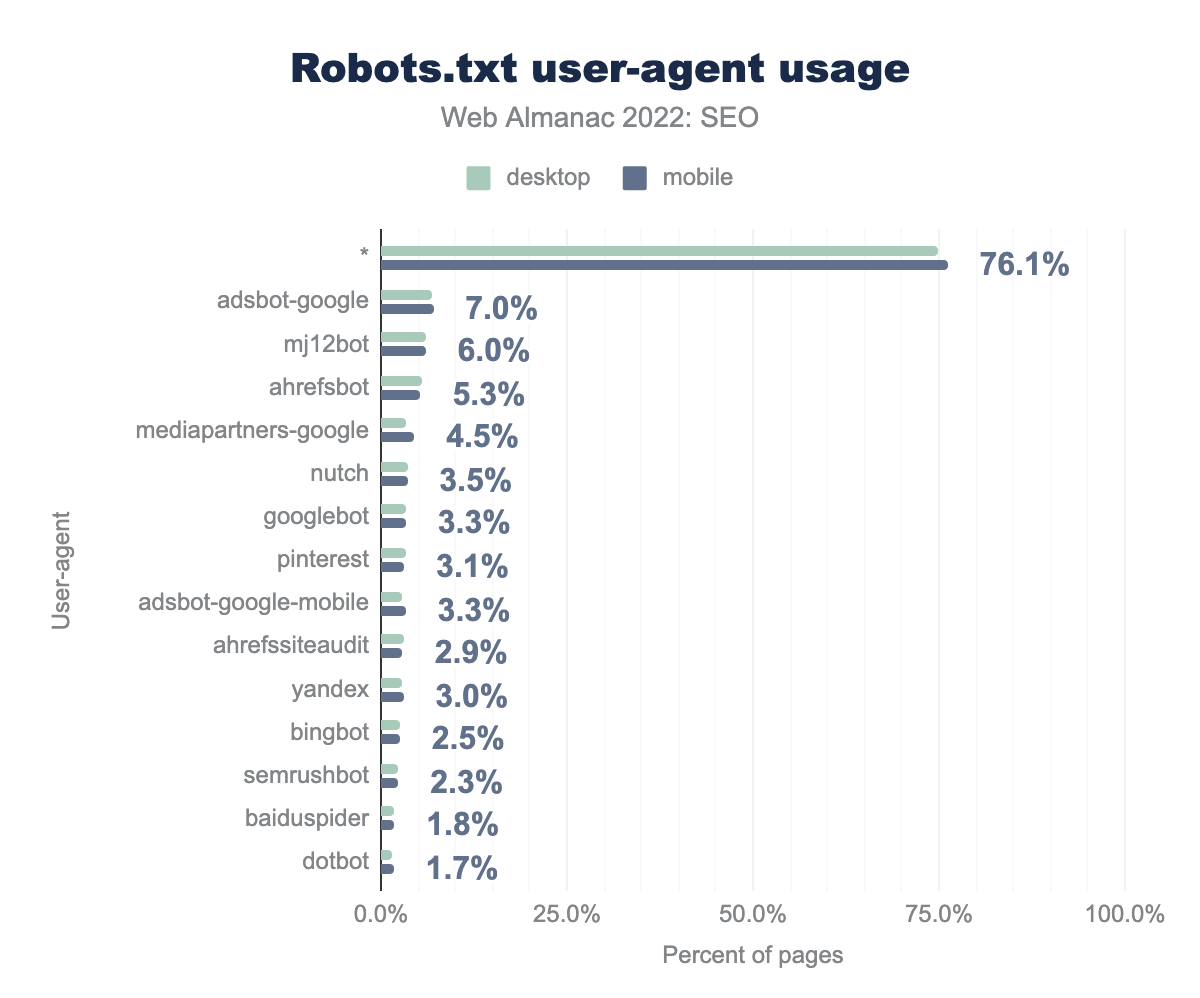
* is 74.9%, adsbot-google is 6.8%, mj12bot is 6.0%, ahrefsbot is 5.4%, mediapartners-google is 3.4%, nutch is 3.7%, googlebot is 3.3%, pinterest is 3.3%, adsbot-google-mobile is 2.8%, ahrefssiteaudit is 3.2%, yandex is 2.9%, bingbot is 2.6%, semrushbot is 2.2%, baiduspider is 1.8%, and finally dotbot is 1.5%. Mobile is almost identical at 76.1%, 7.0%, 6.0%, 5.3%, 4.5%, 3.5%, 3.3%, 3.1%, 3.3%, 2.9%, 3.0%, 2.5%, 2.3%, 1.8%, and 1.7%Most websites today (74.9% desktop and 76.1% mobile) do not indicate a specific user-agent within the robots.txt file, meaning the directives in the file apply to all user-agents. This is consistent with the data from 2020 when 74% of desktop robots.txt files and 75.2% of mobile robots.txt files did not specify a particular user-agent.
Interestingly, Bingbot did not fall into the top 10 most specified user-agents. As for SEO tools, much like in 2021, both Majestic’s and Ahrefs’ bots were in the top 5 most specified user-agents, while Semrush’s bot rounded out the top 15 most specific user-agents.
In terms of search engines, Googlebot leads the pack with 3.3% of robots.txt files specifying the user-agent while Bingbot comes in at 2.5%. Interestingly, there was nearly a full percentage point difference in 2021 between mobile site robots.txt files and desktop files specifying Bingbot. Such is not the case in 2022 where the data is essentially uniform.
Of note, Yandexbot was specified in just 0.5% of robots.txt files in 2021. By 2022 , there was a six-fold increase, with 3% of files specifying Yandexbot.
IndexIfEmbedded tag
In January 2022, Google introduced a new robots tag called indexifembedded. The tag offers control over indexation when content is embedded in an iframe on a page, even when a noindex tag has been applied.
Let’s start by determining the percentage of pages for which the new tag is possibly applicable.
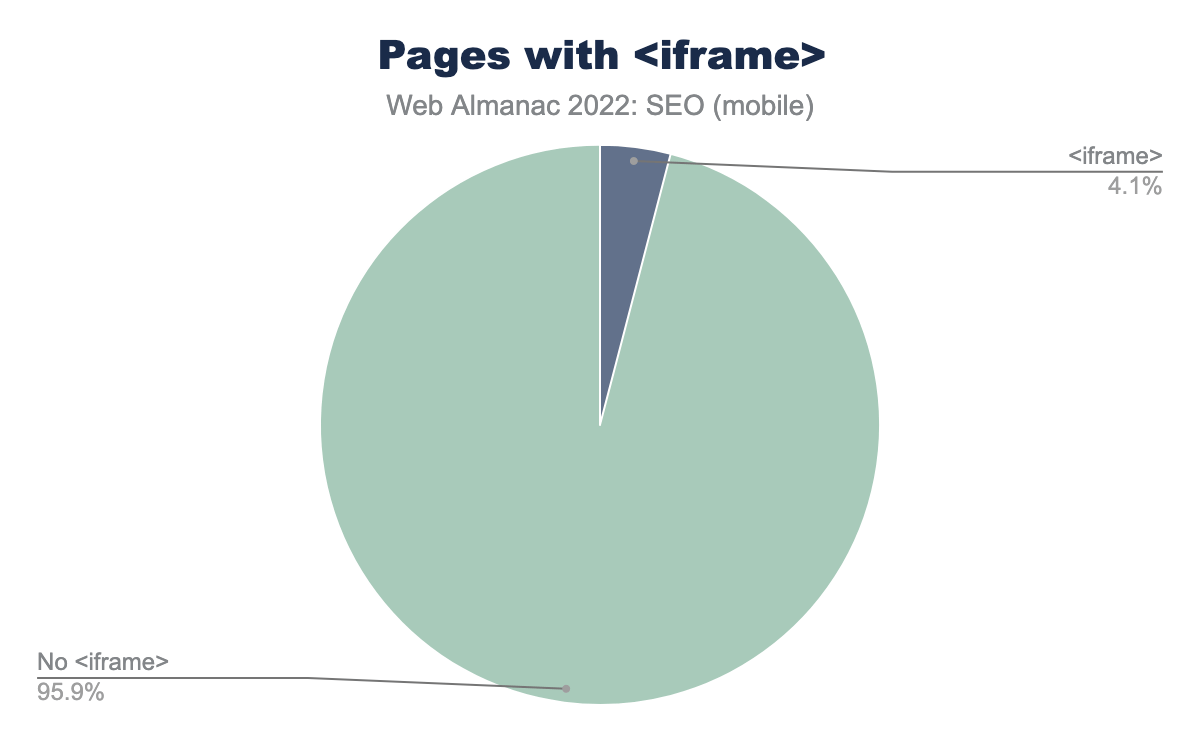
<iframe>.
A little more than 4% of pages contain an <iframe> element. Of the 4.1% of pages containing that element, 76% of them had the iframe noindexed, making them a potential use case for the new indexifembedded tag.
However, a minuscule percentage of sites have adopted the indexifembedded robots tag. The tag can be found on just 0.015% of pages surveyed.
Of the pages that have adopted the indexifembedded tag, 98.3% of them implemented it in the header while 66.3% are using the HTML.

indexifembedded implementations use a robots header at 98.3% and target the googlebot user agent. The other three user agents (google, gogglebot-news, and robots) show 0% usage.Indexifembedded user agents.
Invalid head elements
The <head> element serves as the container for a page’s metadata. From an SEO point of view, a page’s title tag and meta description reside within the <head> element, as do robots meta tags.
Not all elements, however, belong in the <head>. Should Google come across an invalid element in the page’s <head>, it assumes that it has reached the end of the <head> and will not discover the rest of its contents.
Our data from 2022 shows 12.7% of desktop pages and 12.6% of mobile pages contain an invalid element in the <head>.
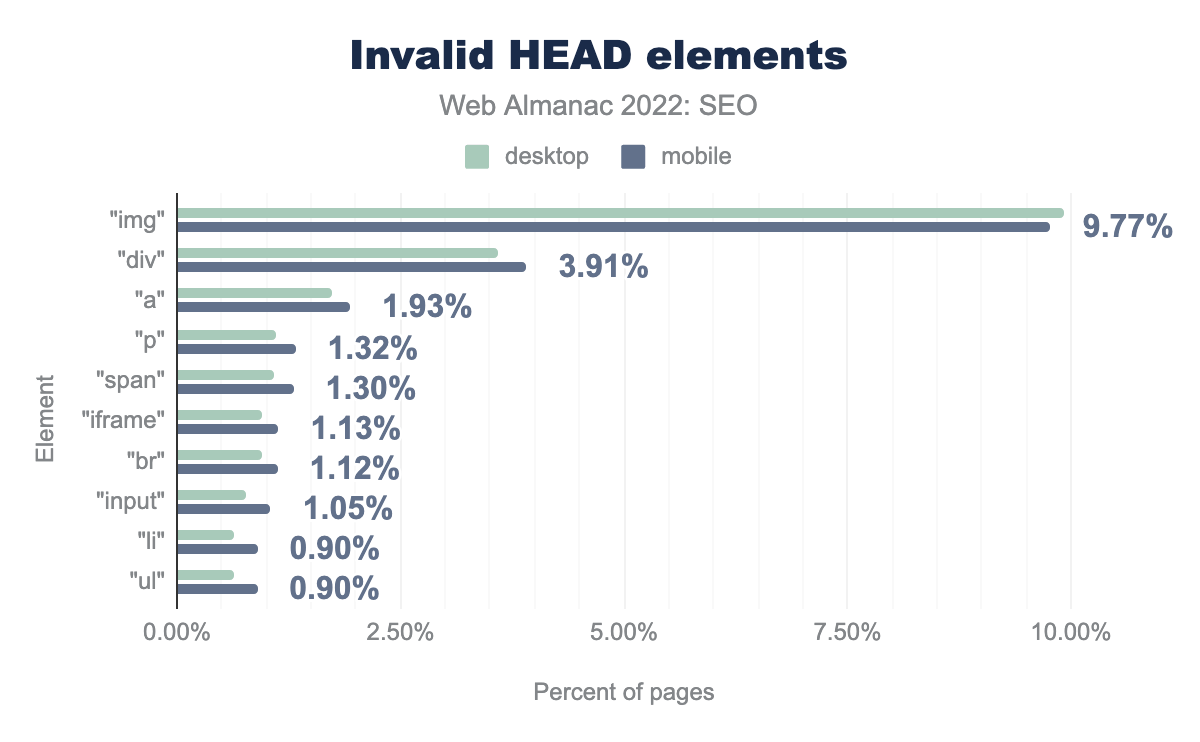
<head>. On Desktop img is used in the head on 9.92% of pages, div on 3.58%, a on 1.73%, p on 1.11%, span on 1.08%, iframe on 0.96%, br on 0.94%, input on 0.78%, li on 0.63%, and finally ul 0.63%. Mobile is very similar at 9.77%, 3.91%, 1.93%, 1.32%, 1.30%, 1.13%, 1.12%, 1.05%, 0.90%, and 0.90% respectively.<head> elements.
The most misapplied element to the <head> by far is the <img> element. It is incorrectly placed within the <head> on 9.7% of mobile pages and 9.9% of desktop pages.
The <div> element is the only other misapplied element to appear within the <head> on more than 3% of the pages within the 2022 dataset. It is incorrectly applied to the <head> on 3.5% of desktop pages and 3.9% of mobile pages.
Canonical tags
Canonical tags are traditionally used when defining duplicate content pages and to help search engines prioritize. They are a snippet of HTML code (rel="canonical") that allows webmasters to define to the search engine which page is the “preferred” version. They are not directives, and instead act as a “hint.” Therefore, search engines such as Google determine their own canonical version of the page, based on how useful they believe the page is for the user. Canonical tags can also be used to consolidate other signals such as links, as well as to simplify tracking metrics and better manage syndicated content.
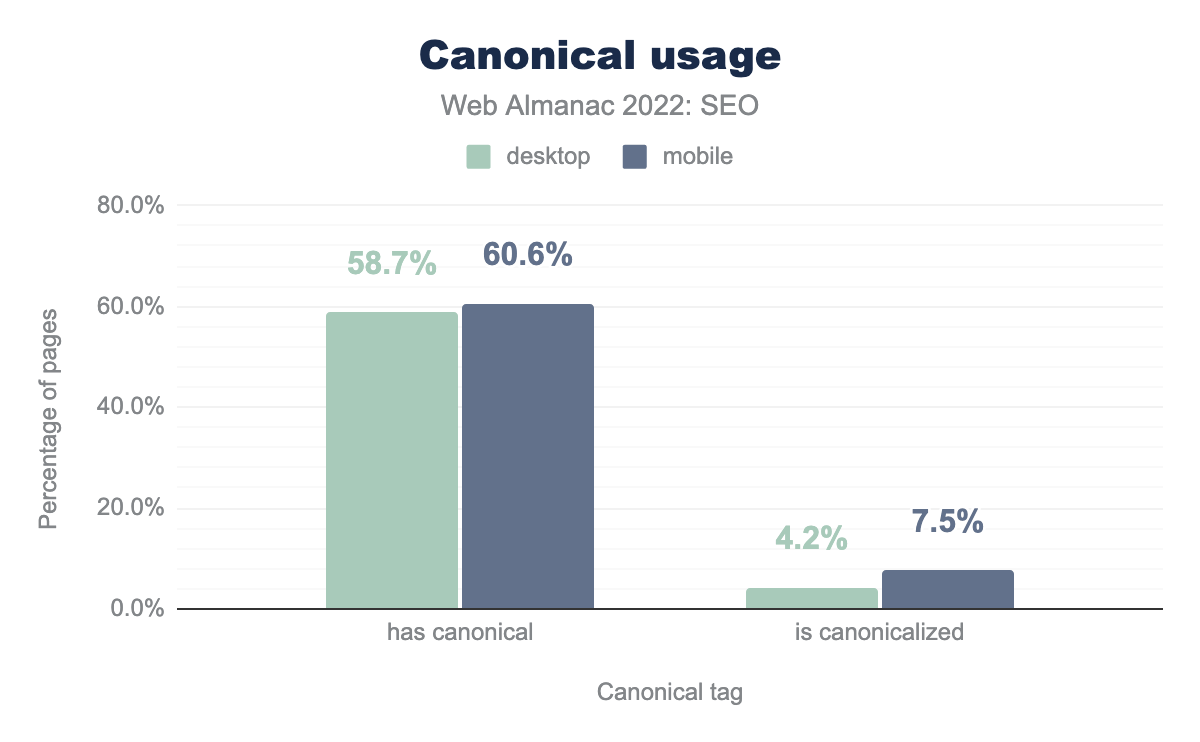
We see from the data that canonical tags usage has increased over the years. In 2019, 48.3% of mobile pages used canonicals. In 2020, this grew to 53.6%. In 2021, this grew even further to 58.5%. And in 2022, it’s increased to 60.6%.
Mobile has a higher percentage of canonical attribution than desktop (60.6% vs. 58.7%), which is likely a direct result of single use URLs on mobile. Since the data set in this chapter is limited to home pages, it’s fair to assume that this is the reason for the higher canonical attribution on mobile. According to Google’s guidelines, having a separate mobile site is not recommended.
HTML vs. HTTP canonical usage
There are two ways of implementing canonical tags:
- Within the HTML
<head> - Within the HTTP headers (
LinkHTTP header)
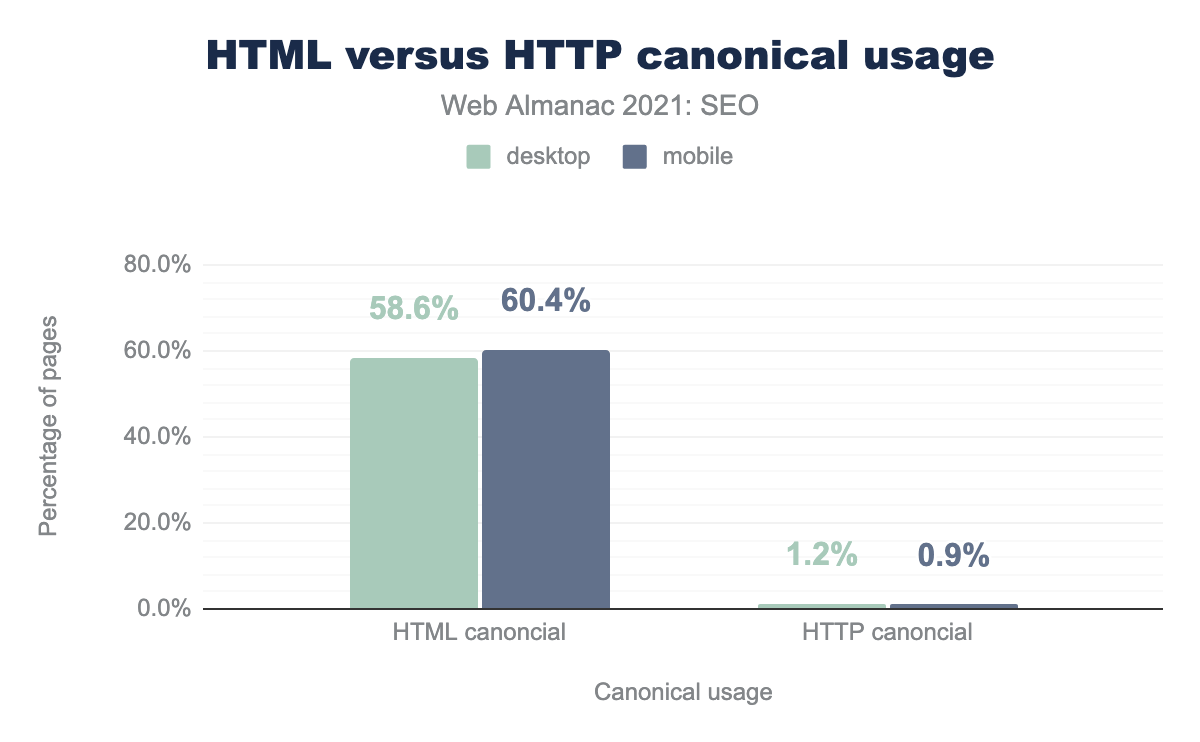
The most common usage across both desktop and mobile is through HTML at 58.6% and 60.4%, respectively. This is likely due to the ease of implementation. While one requires basic HTML knowledge, the other method (through HTTP headers) requires a more technical skillset.
Raw vs. rendered usage

Compared to 2021, where raw canonical usage was 57.7% and rendered canonical usage was 58.4%, in 2022 there was some growth, with raw canonical usage reaching 59.4% and rendered canonical usage rising to 60.4%. This correlates with the growth in overall canonical use.
Page experience
In this section of the chapter, we’re looking at different elements of page experience and how this has evolved since the 2021 Web Almanac.
HTTPS
In 2021, there was an increased focus on site speed and page experience following Google’s introduction of the Core Web Vitals update, which had been publicized and pushed throughout 2020. While evidence of HTTPS being a ranking factor dates back to 2014, the overall focus on page experience since the Core Web Vitals announcement likely had an impact on the adoption of HTTPS across the web.
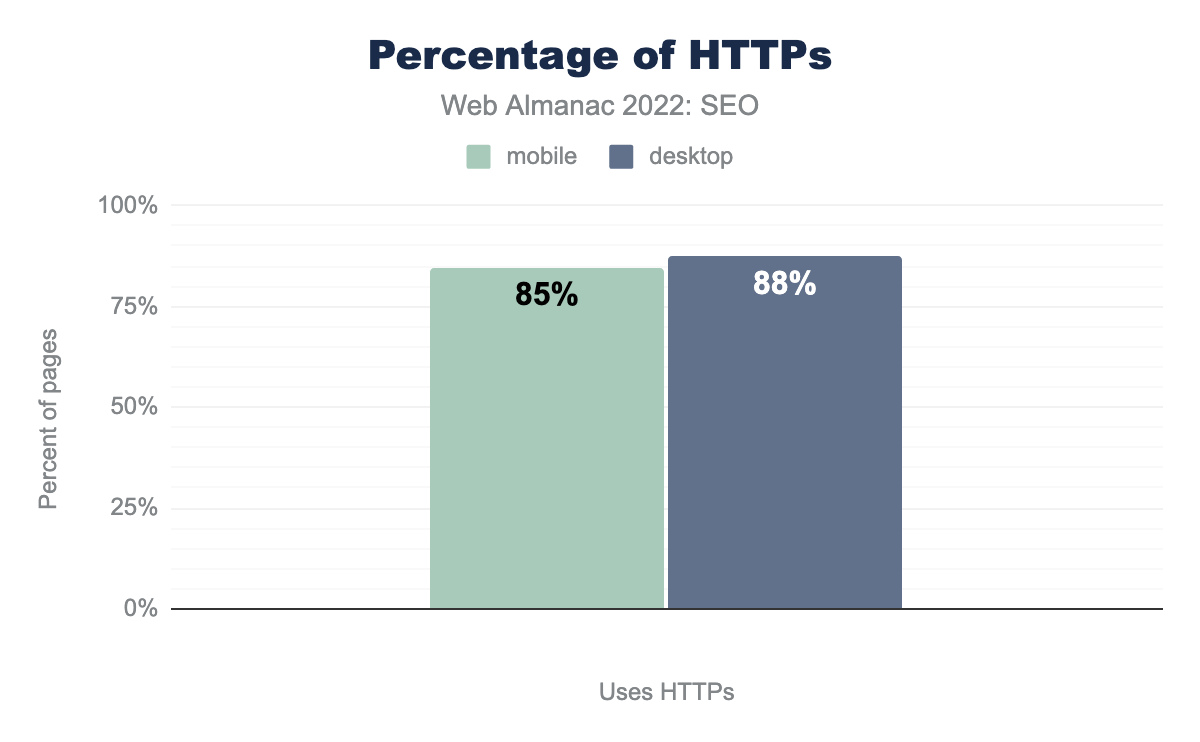
We see from the data how more sites are using a secure certificate (HTTPS) at the time of the crawl (taking into account expirations of these certificates). In 2021, 84.3% of desktop pages used HTTPs, and it went up to 87.71% in 2022. On mobile, this increased from 81.2% in 2021 to 84.75% in 2022. Since the announcement of the Core Web Vitals update in 2020 to the present there’s been an increase of nearly 11% on mobile and 10% on desktop.
Mobile friendliness
Mobile-friendliness can be determined by looking at responsive design implementation vs. dynamic serving. To identify this, we looked at the use of the viewport meta tag which is commonly used in responsive design vs. the vary: User-Agent header to determine if a website is using dynamic serving.
Viewport meta tag
We have seen the use of the viewport meta tag grow from 91.1% of mobile pages using viewport meta tag in 2021 to now 92%. In 2020, it was at 89.2%.
Vary header usage
The vary header is a HTTP header that enables different content to be served to different users on different devices. This is known as dynamic serving, and is the opposite to responsive design, which serves the exact same content, but to different devices.
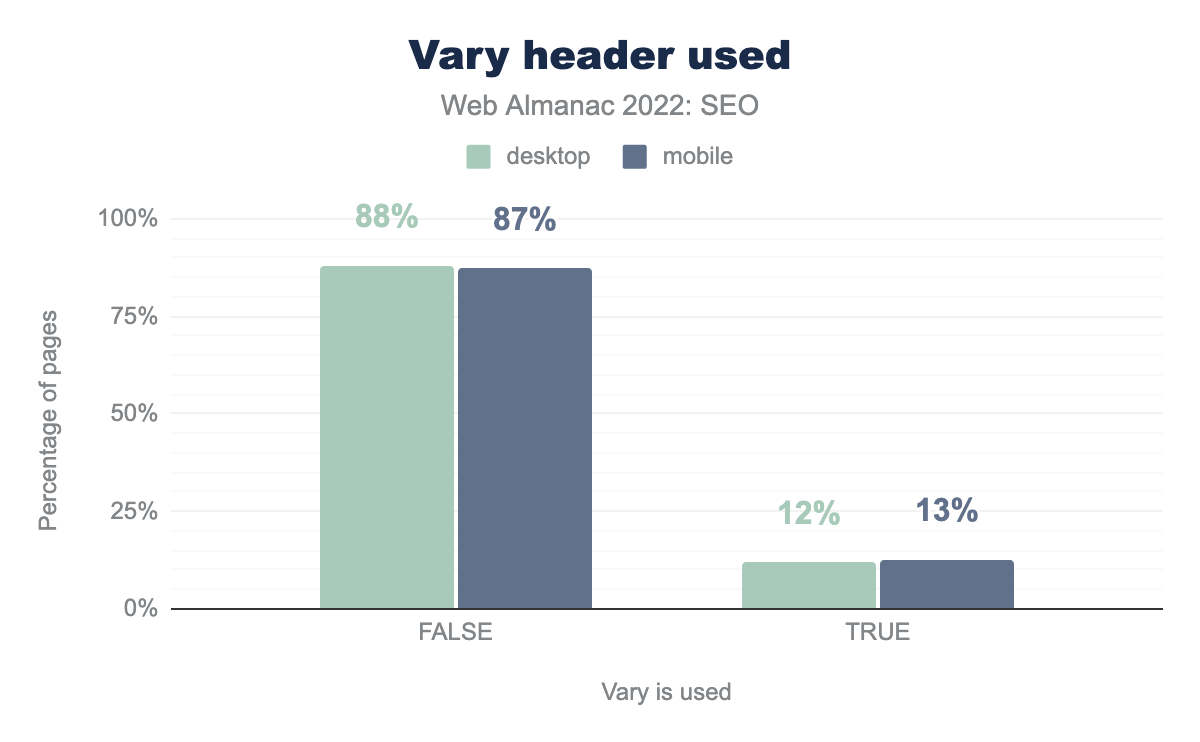
Vary header usage has remained relatively unchanged for the past few years. In 2021, 12.6% of desktop and 13.4% of mobile pages used this footprint. In 2022, the data is nearly identical, with 12% for desktop and 13% for mobile.
Legible font sizes
In 2021, 13.5% of mobile pages were not using a legible font size. Thanks to Google’s focus on user experience across all devices, more pages than ever now use a legible font size. Only 11% of mobile pages are still not using a legible font size.
Core Web Vitals (CWV)
Core Web Vitals was a hot topic in SEO throughout 2021 following Google announcing the roll out of its Page Experience update that June. We have seen a continued interest this year, with more sites paying attention to their CWV performance.
Core Web Vitals are a series of standardized metrics that can help developers and SEOs to better understand how a user is experiencing a page. The main metrics are:
- Largest Contentful Paint (LCP) measures how quickly a web page’s main content loads
- First Input Delay (FID) measures how long it takes from when a user interacts with a web page (i.e. clicks a button) to when the browser is able to respond
- Cumulative Layout Shift (CLS) measures the visual stability and whether a page shifts within the viewport
All three of these metrics are critical to user experience and the stability of a web page.
The data for Core Web Vitals is sourced from the Chrome User Experience Report (CrUX). The report comes from a public dataset of real (opted-in) users, and is sourced from millions of websites (as opposed to lab data, which is simulated).
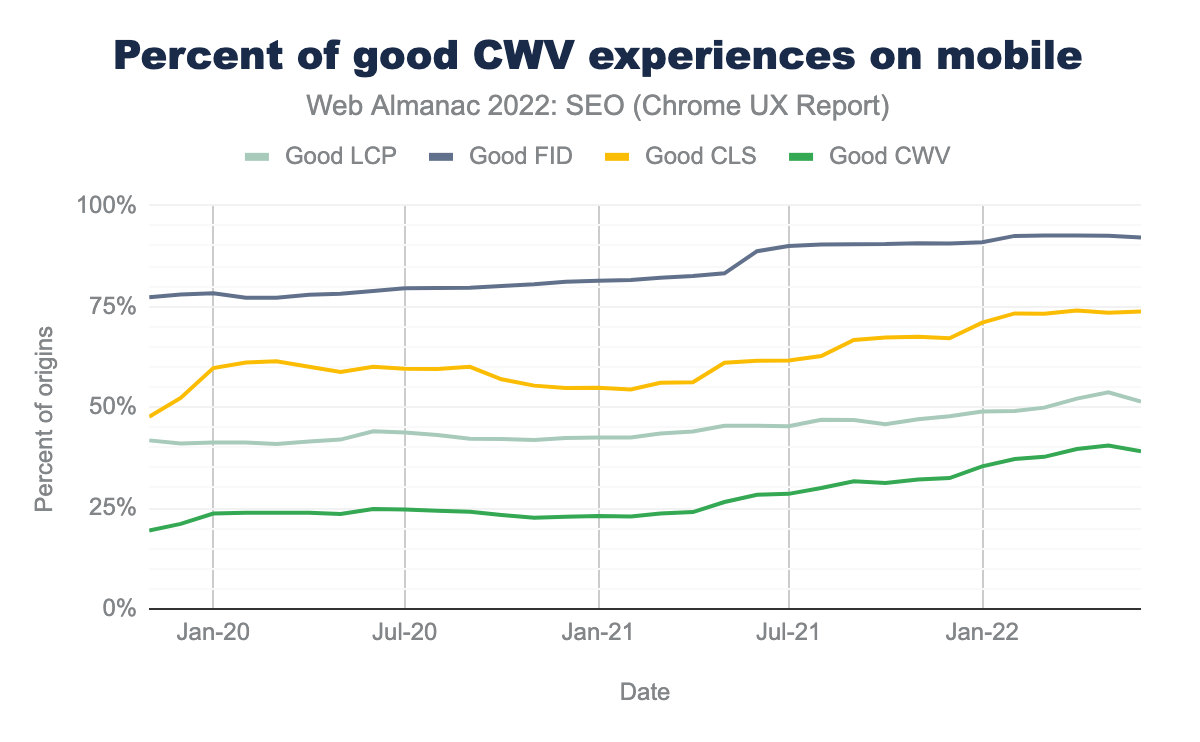
On mobile, 39% of sites now pass CWV, which is up from 29% in 2021 and just 20% in 2020. And while 92% of sites currently pass FID, most site owners are struggling with LCP, which has a pass rate of 51%.
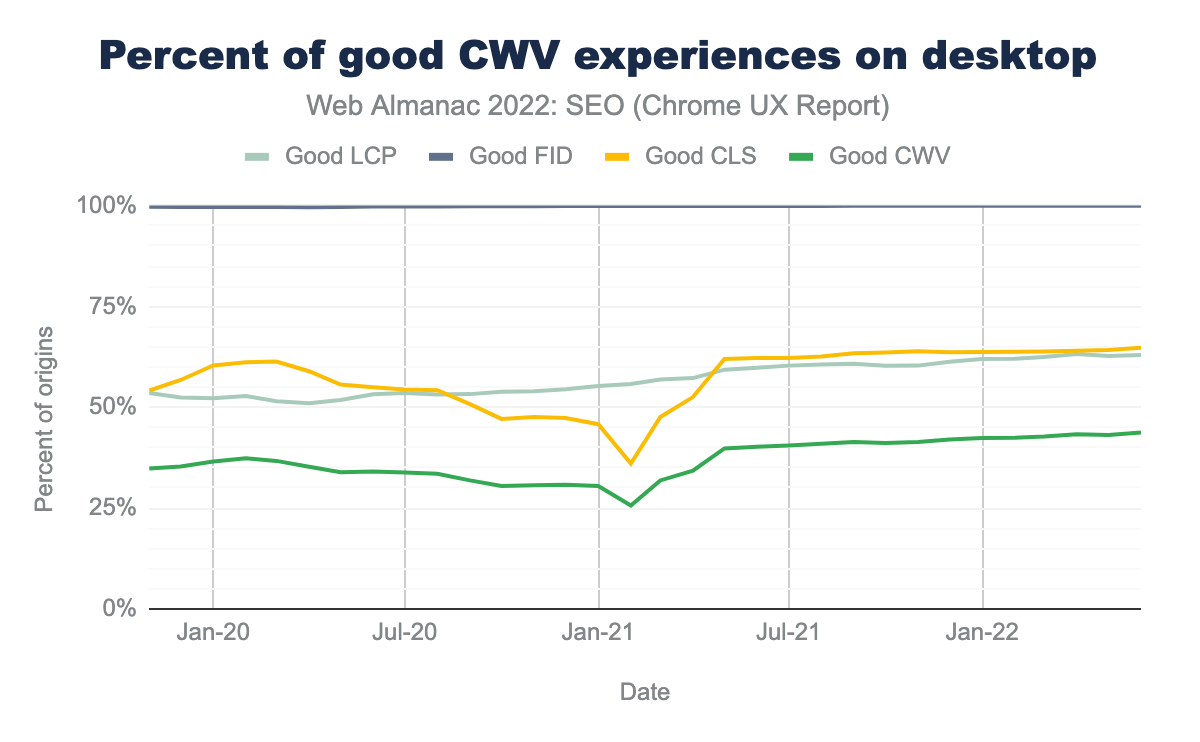
On desktop, we see an astounding 100% of sites passing FID, though similarly struggling to pass LCP and CLS. Noteworthy, more sites are passing CWV on desktop (43%) than on mobile (39%).
lazy loading vs. eager loading iframes
Lazy loading is a technique that defers the loading of non-critical elements on a web page until the point in which they are needed. This can help with the reduction of page weight, as well as conserve bandwidth and system resources. Eager loading is when related entities are simultaneously loaded and fetched all at once.
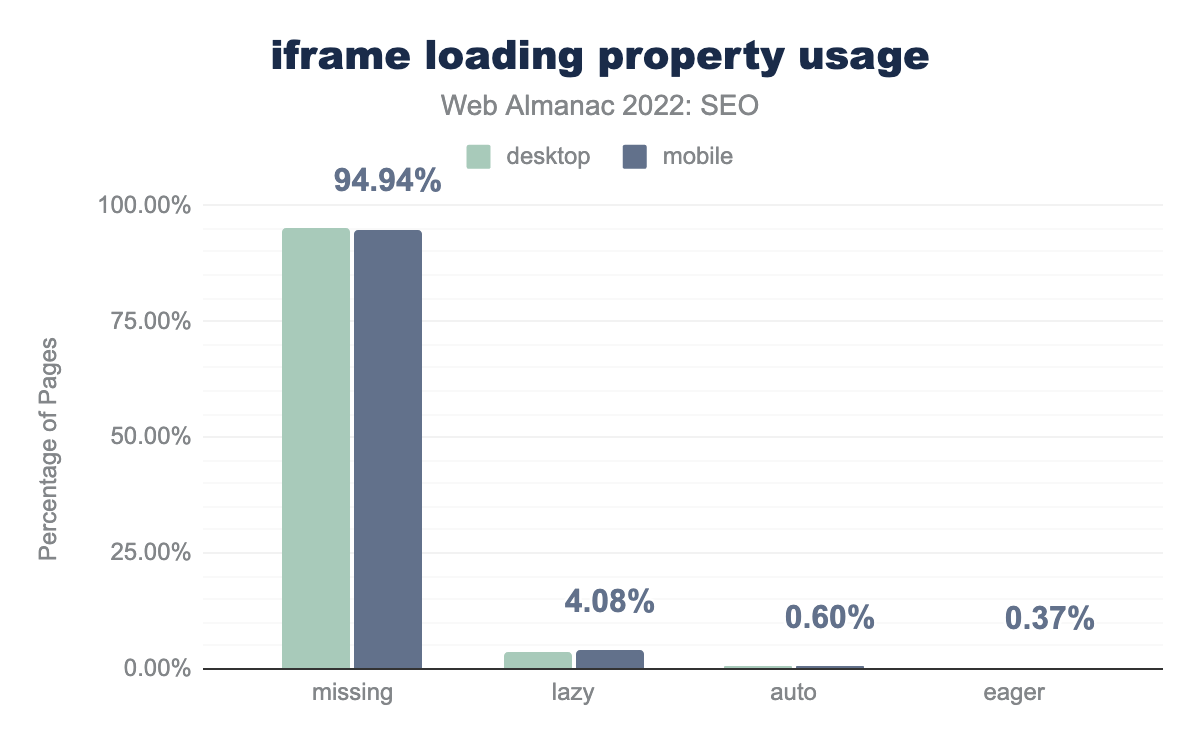
iframe loading properties between lazy, auto, eager, or none. It is missing on 95.30% of desktop pages, lazy is used on 3.67%, auto on 0.74%, eager on 0.29%, it is invalid on 0.00%, and blank on 0.00% of pages. Mobile is almost identical on 94.94%, 4.08%, 0.60%, 0.37%, 0.00%, and 0.00% respectively.iframe loading property usage.
When looking solely at iframes, we see lazy loading is preferred far more to eager loading, with 4.08% of iframes being lazy loaded versus 0.37% of iframes being eager loaded.
This is particularly interesting since browser-level lazy loading for iframes has become standardized in Chrome. The standardization of the loading attribute, without specifying lazy or eager, is likely why data shows 94.4% of attributes do not contain lazy or eager.
On page
When looking for relevancy signals, search engines look at the content on a web page. There are various on-page SEO elements that can affect rankings and/or appearance on the SERPs (Search Engine Results Pages).
Meta data
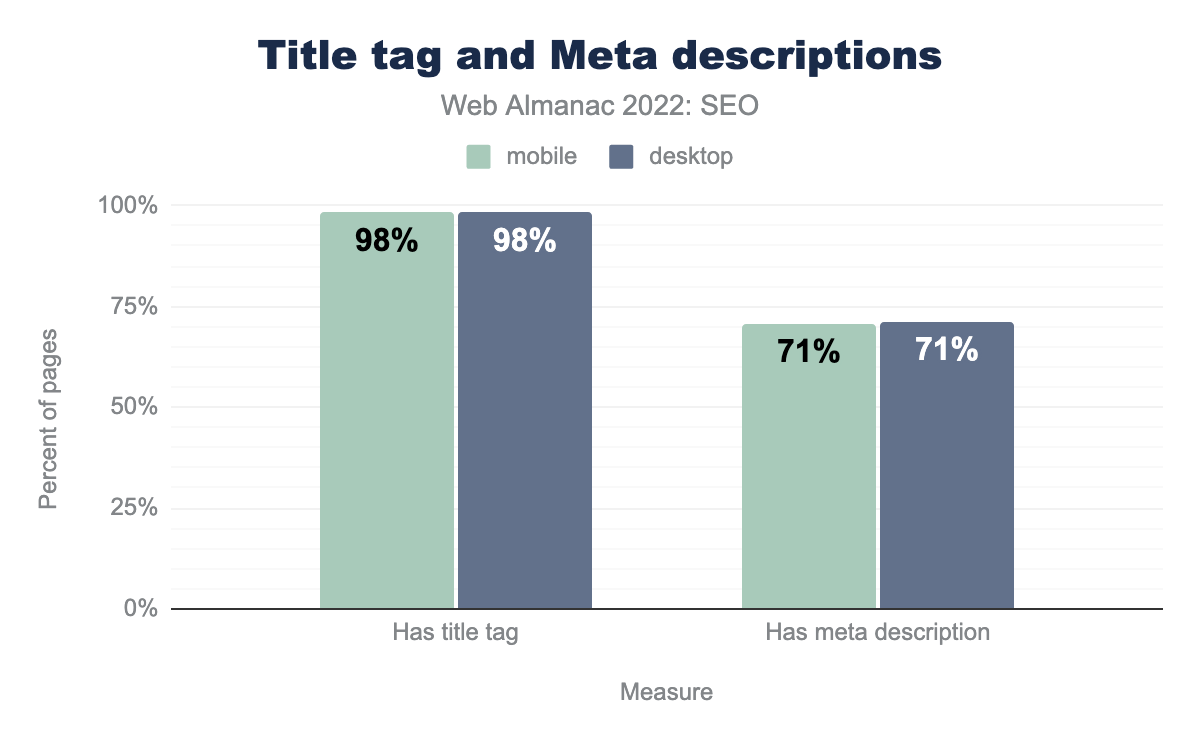
For the second year in a row, 98.8% of desktop and mobile pages had <title> elements. Also in 2022, 71% of desktop and mobile home pages had <meta name="description"> tags, a 0.1% decrease from last year.
<title> element
The <title> element is an on-page ranking factor that provides a strong hint regarding page relevance and may appear on the SERP. In August 2021, Google started rewriting more websites’ titles in their search results.
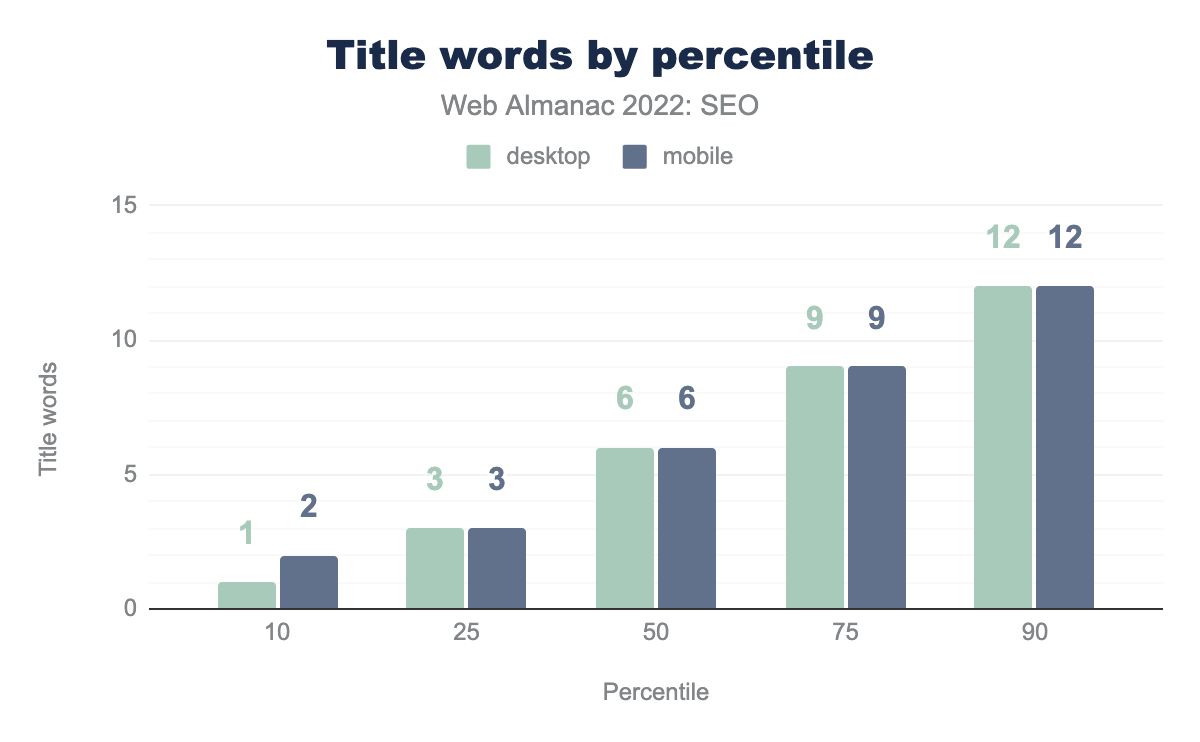
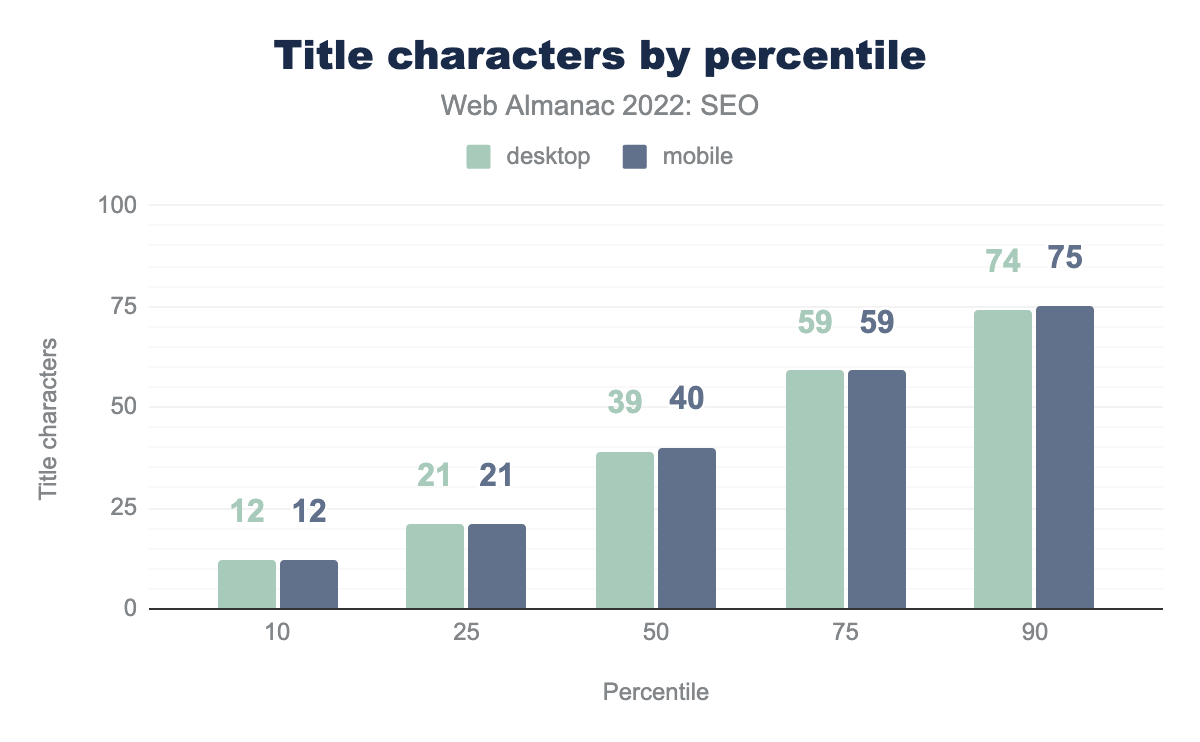
In 2022:
- The median page
<title>contained 6 words. - The median page
<title>contained 39 and 40 characters on desktop and mobile, respectively. - 10% of pages had
<title>elements containing 12 words. - 10% of desktop and mobile pages had
<title>elements containing 74 and 75 characters, respectively.
These stats remain unchanged from last year. Note: These titles on home pages tend to be shorter than those used on deeper pages.
Meta description tag
The <meta name="description> tag does not directly impact rankings. However, it may appear as the page description on the SERP, and it can influence click-through rate.
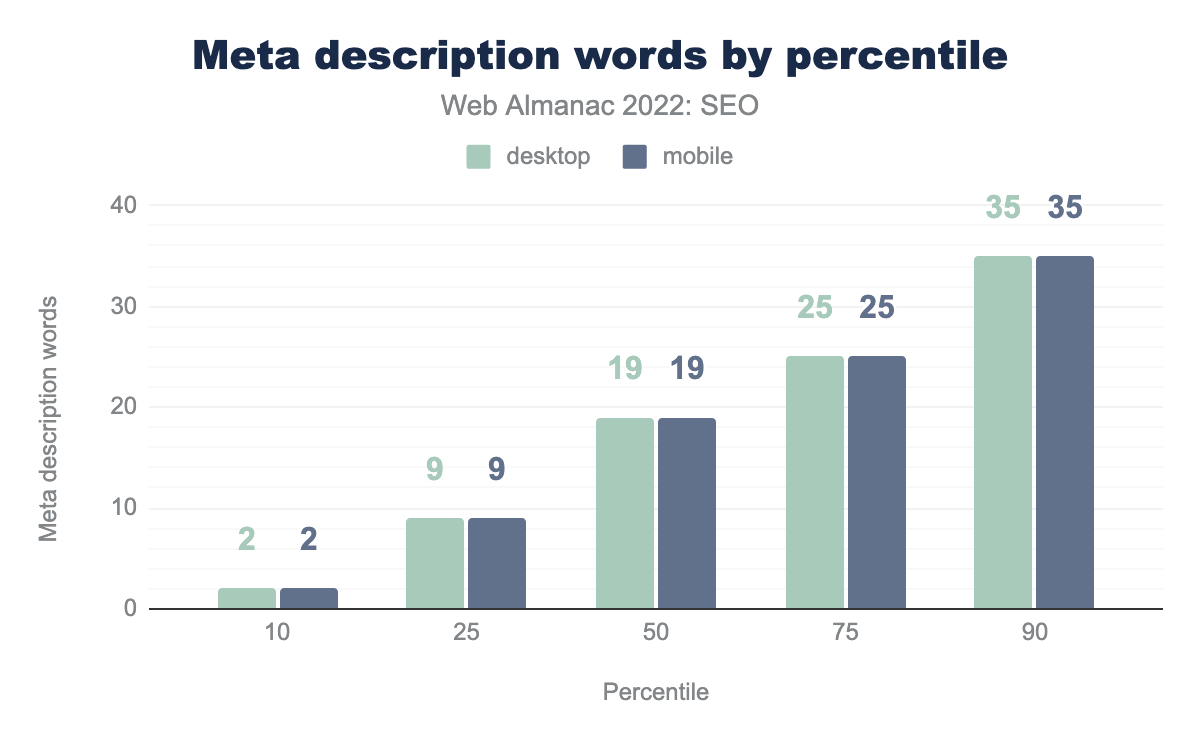
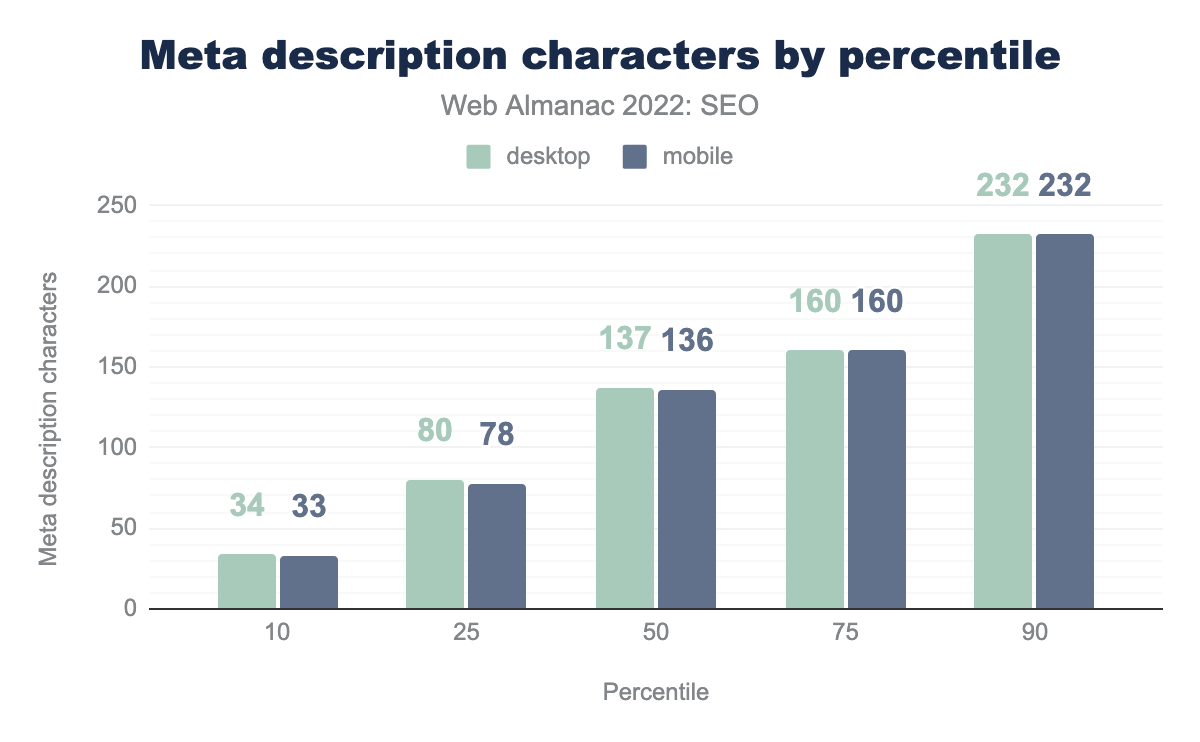
In 2022:
- The median desktop and mobile page
<meta name="description>tag contained 19 words. - The median desktop and mobile page
<meta name="description>tag contained 137 and 136 characters, respectively. - 10% of desktop and mobile pages had
<meta name="description>tags containing 35 words. - 10% of desktop and mobile pages had
<meta name="description>tags containing 232 characters.
For the most part, these stats are relatively unchanged from last year.
Header tags
Heading elements (<h1>, <h2>…) are important parts of a page’s structure since they help organize the content on the page. Heading elements are not a direct ranking factor, but they can help Google better understand the content found on the page.
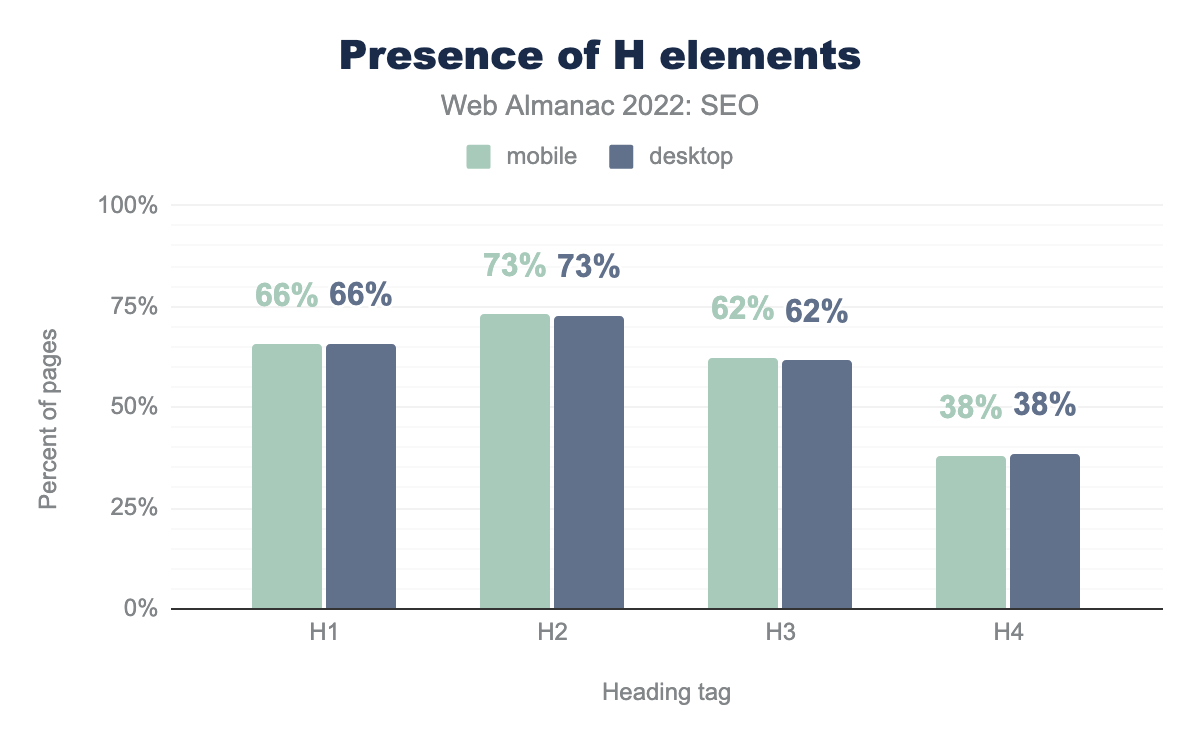
The trends around implementation of headings by type in 2022 closely match those from 2021, with just a few small differences. For example, 71.9% of mobile pages utilized an h2 in 2021 while 73.02% did in 2022.
Another trend that has carried over is the discrepancy in usage between the h1 and h2. While 72.7% of desktop pages implement an h2, only 65.8% use an h1 (with similar numbers reflected on mobile).
Although there is no definitive explanation for this, one possible reason is that the h1 is often placed above any content. It’s not essential for the natural flow of the content. However, without the h2, there could be a long flow of unstructured content.
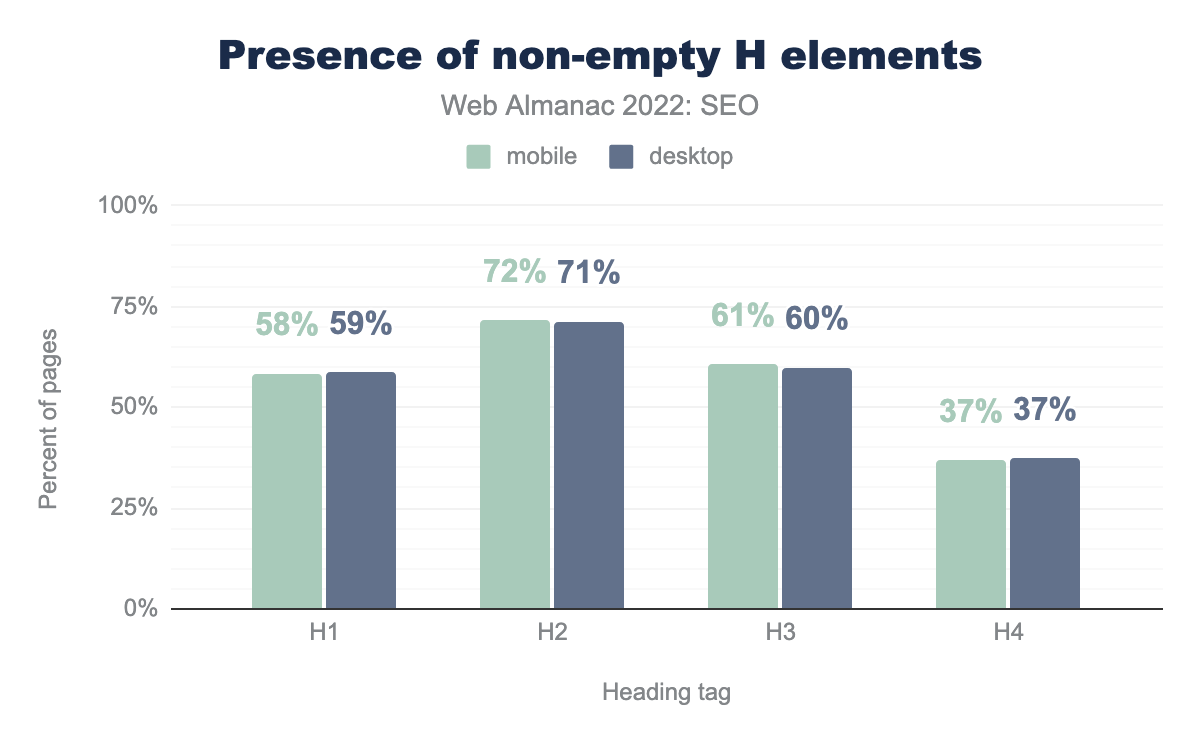
Overall, much like 2021’s stats, there are relatively few empty H elements found on pages. Additionally, there is little discrepancy between the desktop and mobile data.
There is divergence, however, with the h1. While 65.8% of pages contained an h1 element, 58.5% contained a non-empty h1 element. That’s a 7.3 percentage point difference. Contrast that with the h2, which has just a 1.5 percentage point difference. As noted in the 2021 Web Almanac, this may be a result of the many websites that wrap logo-images in the h1 element on home pages.
Image attributes
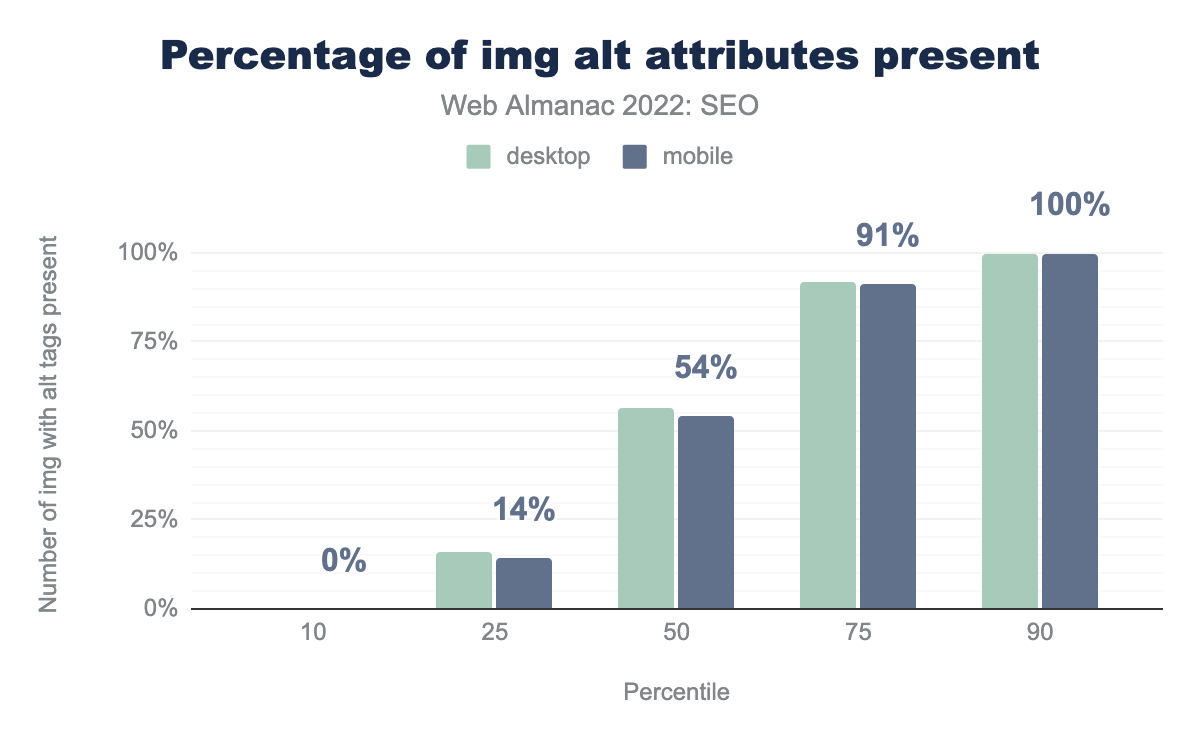
The primary purpose of the alt attribute on the <img> element is accessibility. Alt attributes also assist search engines rank specific assets in image search.
img alt attributes present.
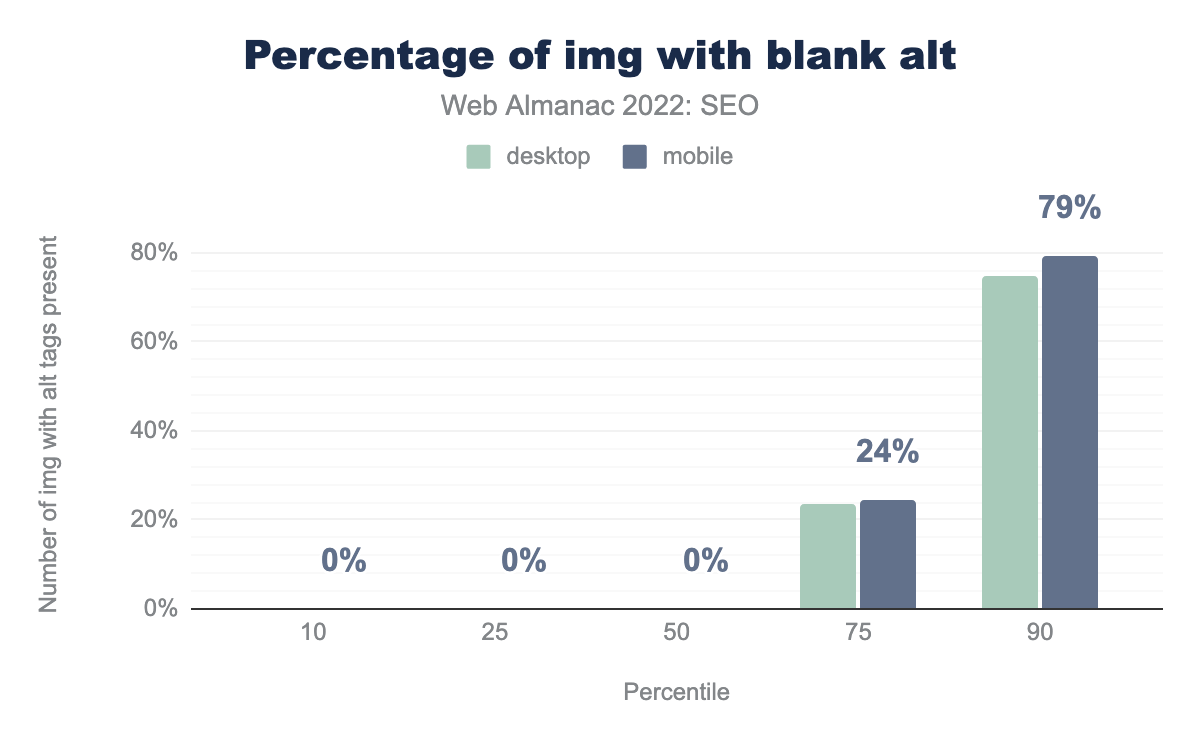
img with blank alt.
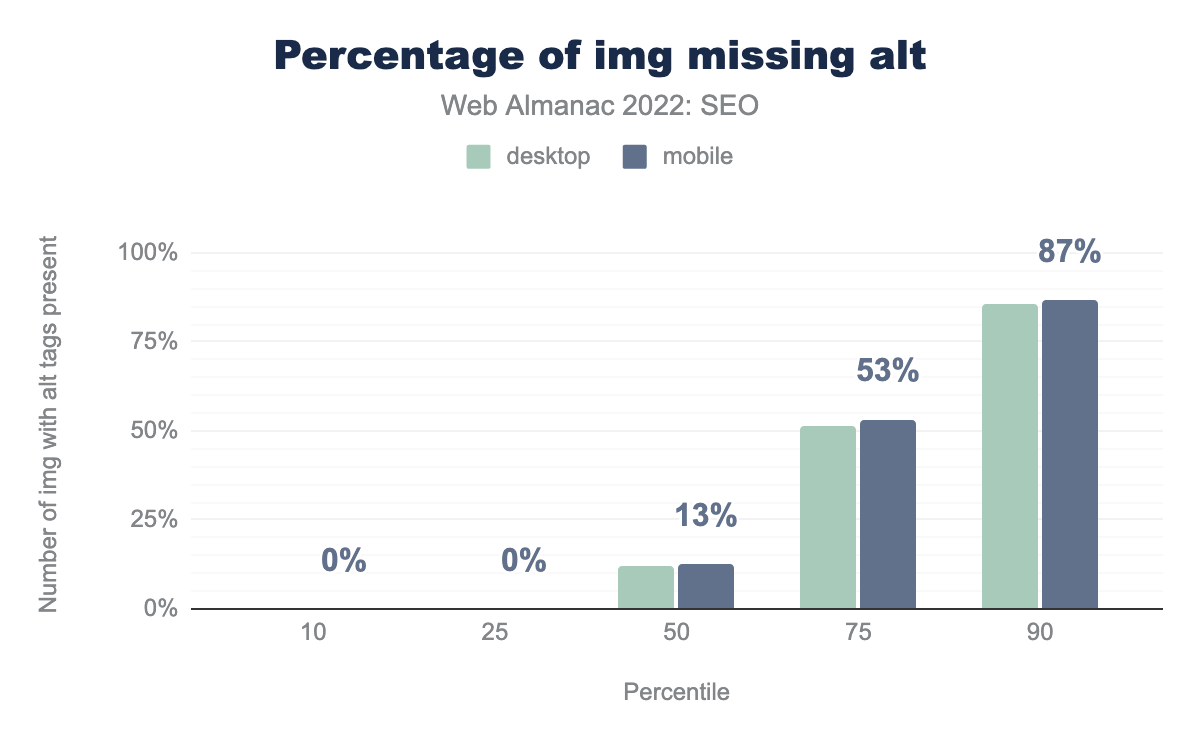
img missing alt.
What we found:
- On the median desktop page, 56.25% of
<img>tags have the alt attribute. This is a negligible decrease of just a quarter of a percentage point from 2021’s 56.5%. - On the median mobile page, 54.9% of
<img>tags have the alt attribute. This is a marginal increase from the 54.6% of tags with the alt attribute in 2021. - There is a noticeable change in the median desktop and mobile pages containing
<img>tags that have blank alt attributes compared to 2021. Last year, the median desktop and mobile pages, respectively had 10.5% and 11.8%<img>tags with blankaltattributes. In 2022, this figure rose to 12.1% and 12.5% on desktop and mobile, respectively. - The trend towards 0% of median desktop and mobile pages containing
<img>tags missing the alt attribute continues. On the median desktop page in 2021, 1.4% of the<img>tags had blank attributes. It fell to 0% in 2022.
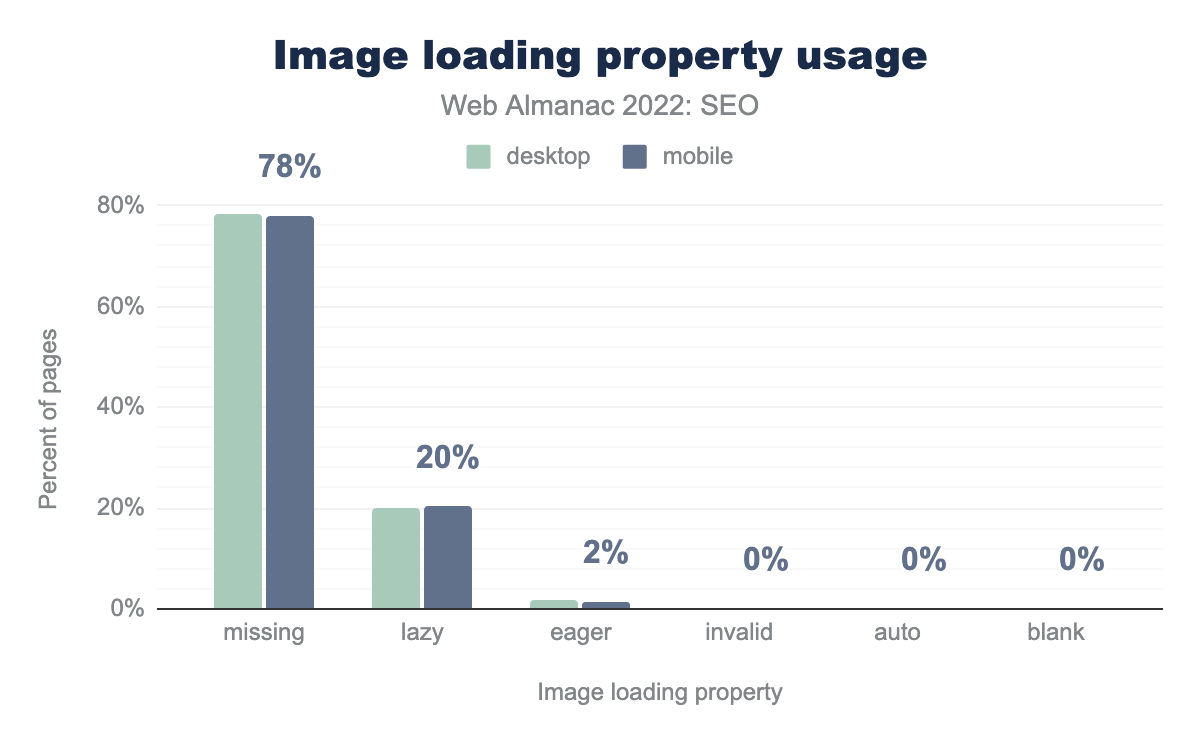
Image loading property usage
How user agents prioritize the rendering and displaying of images is affected by the loading attribute applied to <img> elements. This implementation can impact user experience and performance time, with possible effects on both SEO success and conversions.
eager. 0% set it to auto of blank. The numbers are identical on desktop and mobile.loading property usage.
What we found:
- There has been a significant reduction in the number of pages that do not use any image loading property. In 2021, 83.3% of desktop pages and 83.5% of mobile pages didn’t utilize any image loading property at all. It’s now 78.3% of desktop pages and 77.9% of mobile pages in 2022.
- Conversely, the implementation of loading=”lazy” has increased. In 2021, both 15.6% of desktop and mobile pages implemented loading=”lazy”. This has increased to 19.8% (desktop) and 20.3% (mobile) in 2022.
- The number of pages defaulting to the brower’s loading method has fallen in 2022. On desktop, .07% of pages use loading=”auto” and .08% on mobile. In 2021, .01% of pages utilized loading=”auto”.
Word count
While content length is not a ranking factor, it is still valuable to assess how many words a page contains on average.
Rendered word count
Let’s begin with the number of words found on the page once it has been rendered.
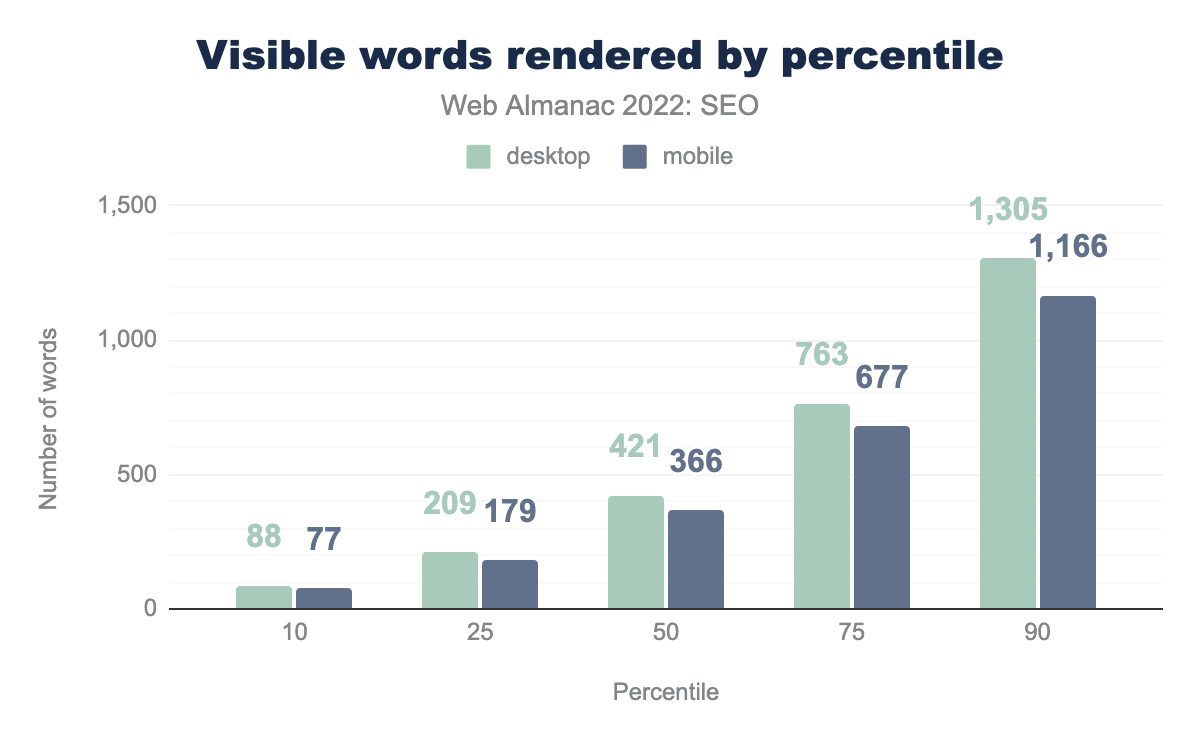
The median desktop page in 2022 contains 421 words. This is quite close to the 425 words found in 2021. However, this is still a big leap percentage-wise from what we found back in 2020 when 402 words were found on the median desktop page. Whatever the cause was in 2021 for the uptick in rendered word count, it appears to have remained through 2022.
Similarly, the median number of rendered words on mobile in 2022 contains 366 words, which is also similar percentage-wise to the data in 2021. For context, desktop pages contain more words than mobile pages. The median desktop page contains 15% more words than mobile pages within the 50th percentile. This is significant since Google some years ago adopted a mobile-first index, and content not found on the mobile version of a page runs the risk of not being indexed by the search engine.
Raw word count
Let’s now examine the number of words contained in a page’s source code prior to the browser executing any JavaScript code or other modifications in the DOM or CSSOM.
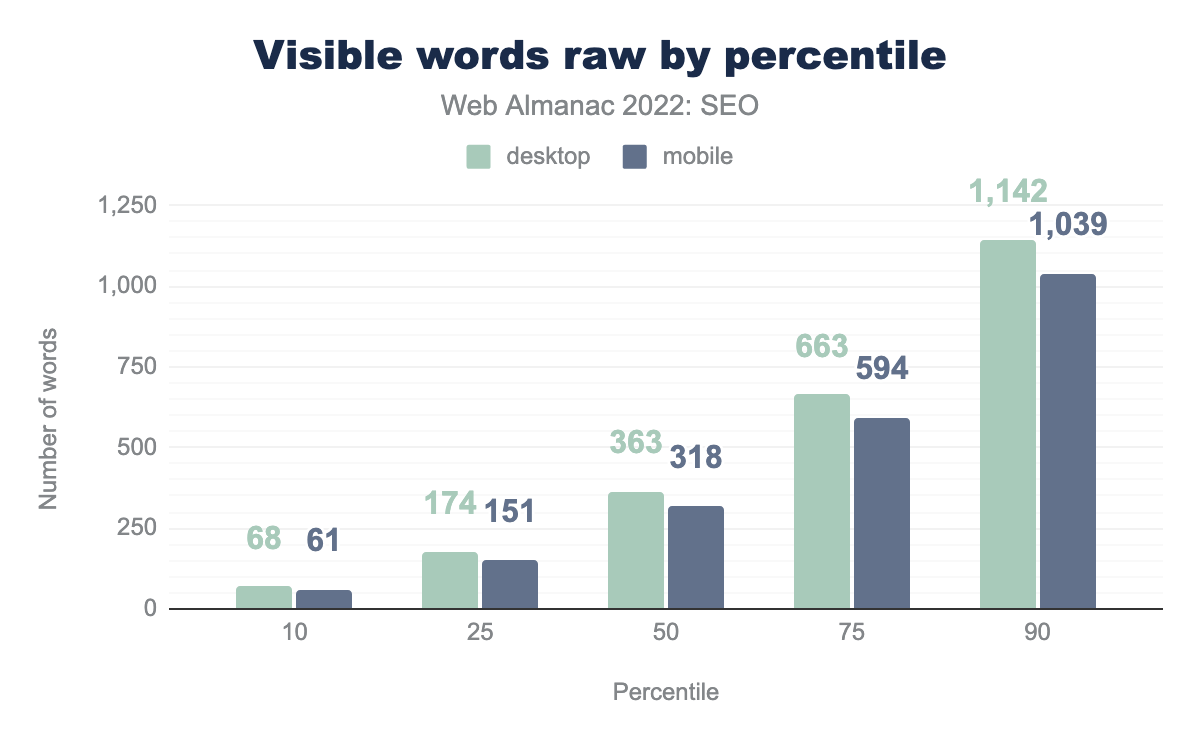
Much like the rendered word count, there is a minimal difference between the data in 2022 versus what was found in 2021. For example, the median desktop page’s raw word count was 369 in 2021 compared to 363 in 2022 and median mobile page’s raw word count was 318 which is slightly less than 2021 which saw 321 words as the median.
Here, too, mobile pages contain fewer words than desktop pages across the board. The median mobile page contains a raw word count that is 12.39% less than desktop. As noted above, this is significant because of Google’s mobile-first indexing.
Structured Data
Implementing Structured Data has come into increased focus as rich results on the Google SERP have become more prominent.
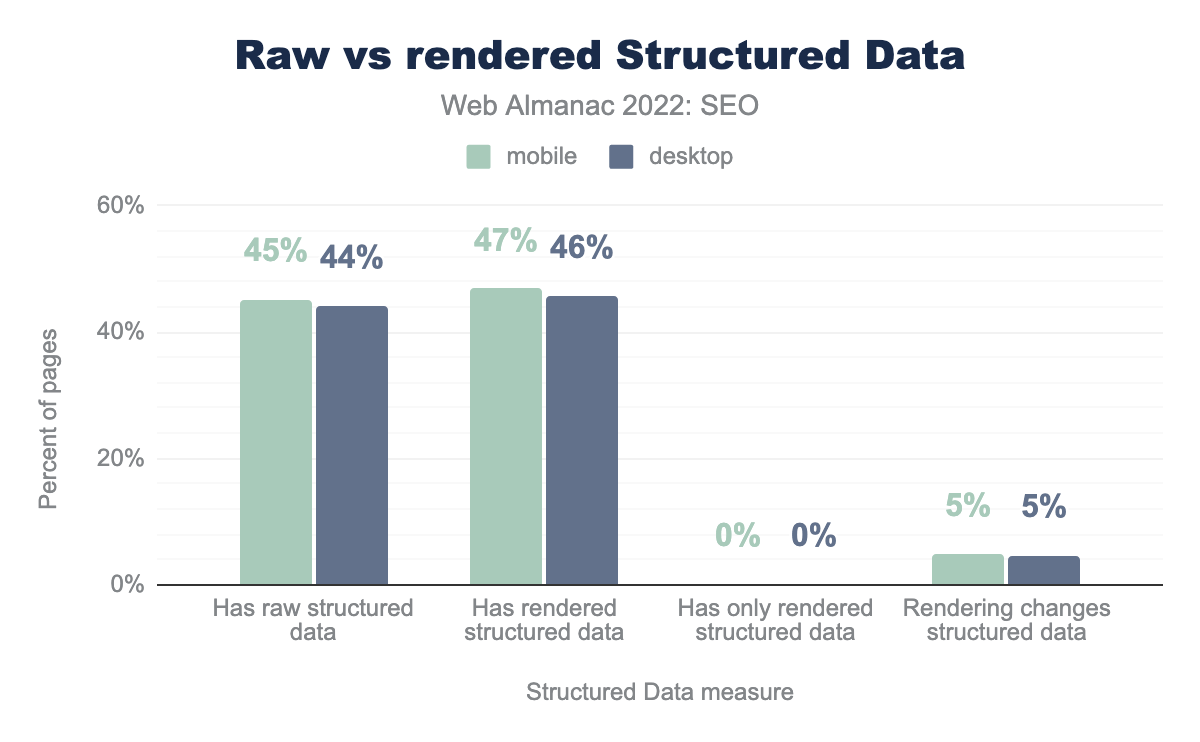
The implementation of structured data in the HTML of a page has continually increased. In 2021, 42% of desktop pages and 43% of mobile pages used structured data. In 2022, it’s risen to 44% of desktop pages and 45% of mobile pages that have structured data within their HTML.
This reflects 2 percentage point increases on both desktop and mobile pages. Two possible explanations for greater adoption could be that a number of Content Management Systems have added automatic structured data markup to their pages, as well as the aforementioned prominence that structured data has played in Google SERPs.
There has also been a great reduction in both mobile and desktop pages that have structured data added via JavaScript where it was not contained within the initial HTML response. In 2021, 1.7% of mobile pages and 1.4% of desktop pages had structured data added via JavaScript where it was not contained within the initial HTML response. It’s now just .15% on desktop and .13% on mobile.
Most popular Structured Data formats
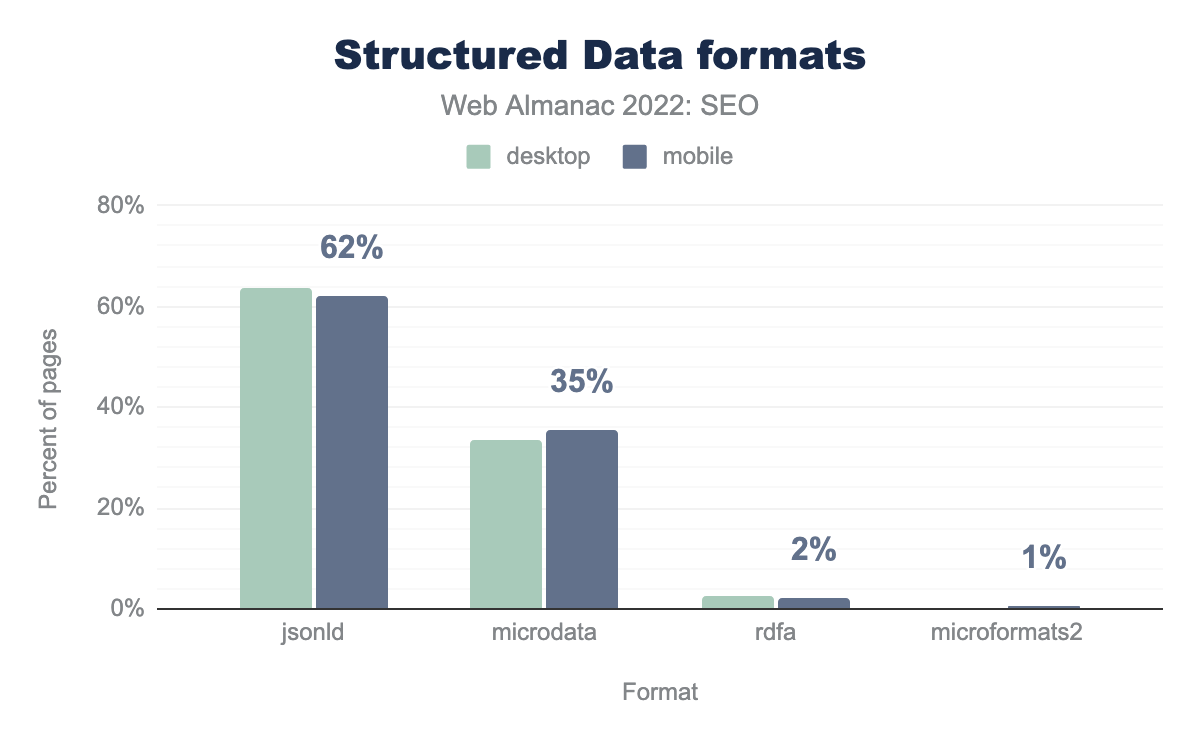
Structured data can be implemented through various ways on a given page. However, JSON-LD, which aligns with Google’s own recommendation for implementation, is by far the most popular format.
Compared to 2021’s figures, 2022’s data shows a nominal increase in implementation via JSON-LD and a slight decrease when implementing structured data with microdata. These numbers bear out in particular on mobile. In 2021, 60.5% of mobile pages used JSON-LD to implement structured data. The number of mobile pages in 2022 using JSON-LD for adding structured data is up 2.3% to 61.9%. Conversely, 36.9% of mobile pages in 2021 utilized structured data with microdata. That number fell 4.3% in 2022 to 35.3%.
Most popular schema types
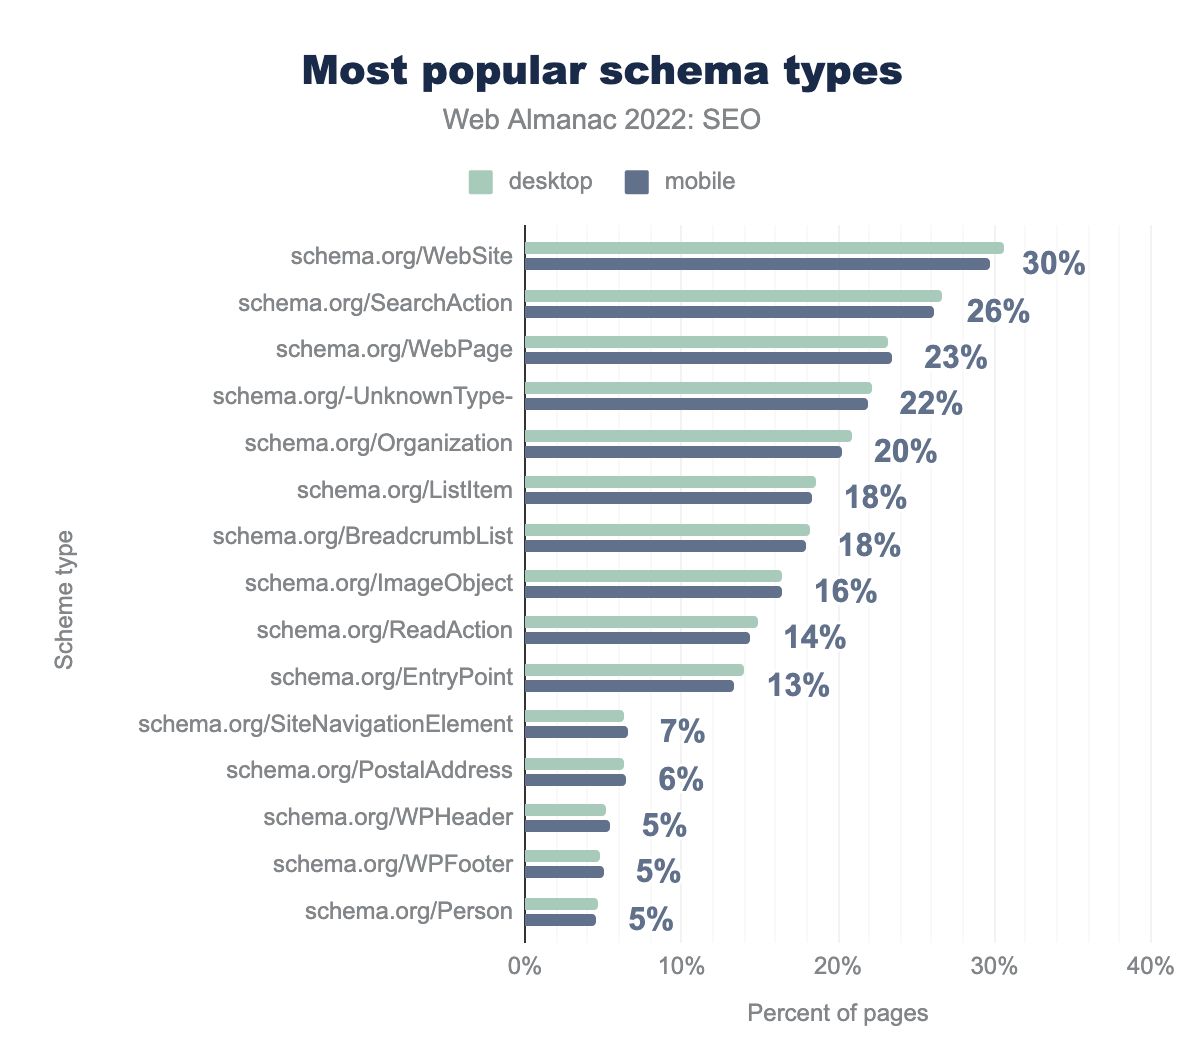
schema.org/WebSite is used on 31% of desktop pages, schema.org/SearchAction on 27%, schema.org/WebPage on 23%, schema.org/-UnknownType- on 22%, schema.org/Organization on 21%, schema.org/ListItem on 19%, schema.org/BreadcrumbList on 18%, schema.org/ImageObject on 16%, schema.org/ReadAction on 15%, schema.org/EntryPoint on 14%, schema.org/SiteNavigationElement on 6%, schema.org/PostalAddress on 6%, schema.org/WPHeader on 5%, schema.org/WPFooter on 5%, and finally schema.org/Person on 5% of desktop pages. Mobile is almost identical with 30%, 26%, 23%, 22%, 20%, 18%, 18%, 16%, 14%, 13%, 7%, 6%, 5%, 5%, and 5% respectively.There is strong correlation between the most popular types of schema found on home pages in 2021 and 2022.
As noted in previous editions of the Web Almanac, WebSite, SearchAction, WebPage, SearchAction is what powers the Sitelinks Search Box [see chart above].
When comparing 2021 to 2022, there has been a significant increase in the adoption of the most popular schemas across the board. In fact, every noted schema type has experienced an increase in adoption in 2022. Among the most notable are the schema for BreadcrumbsList, which has risen 22.8% since 2021 and ImageObject, which is up 12.3%.
In terms of implementing the most popular schemas, there are relatively tiny differences between the percentages of mobile versus desktop pages.
You can read more about structured data in our dedicated chapter.
Links
Search engines utilize links to discover new pages and to pass PageRank, which helps determine the importance of pages. Links also act as a reference from one page to another (presumably relevant) page.
Non-descriptive link text
Anchor text, which is the clickable text used in a link, helps search engines to understand the content of the linked page. Lighthouse has a test to check if the anchor text used is useful and/or contextual, or if it’s generic and/or non-descriptive such as “learn more” or “click here.” In 2022, 15% and 17% of the tested links on mobile and desktop, respectively, did not have descriptive anchor text, a missed opportunity from an SEO perspective and bad for accessibility.
Outgoing links
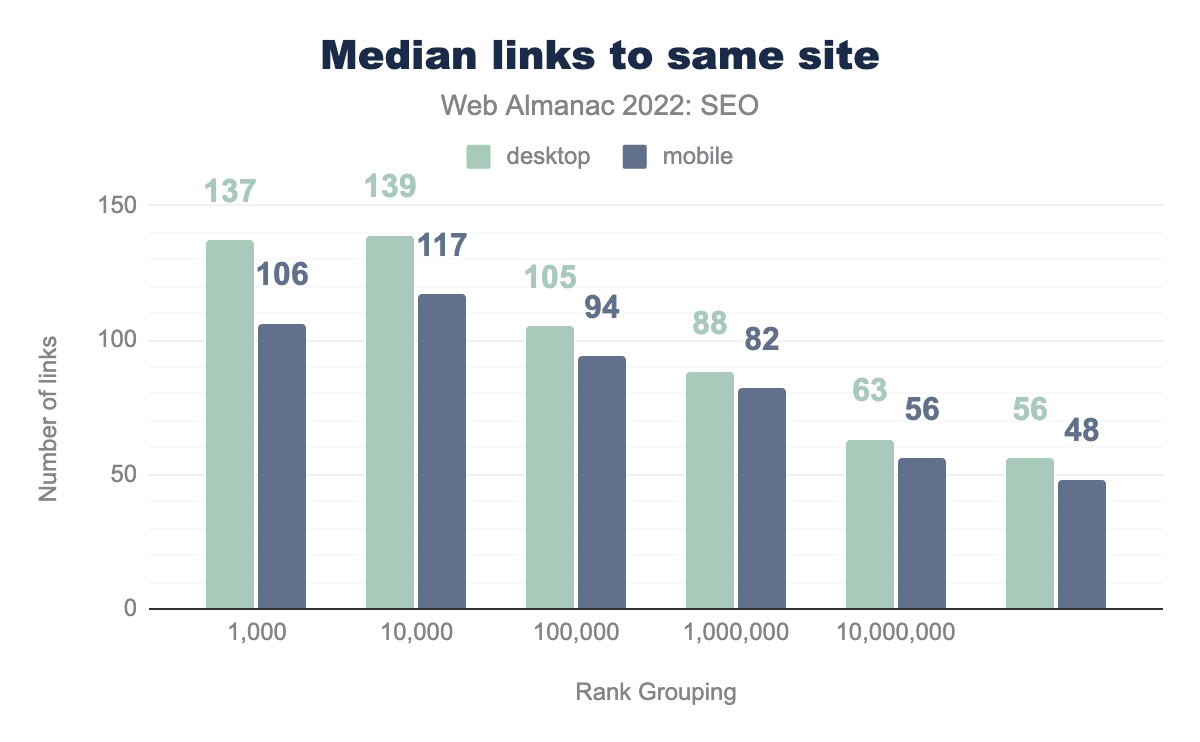
Internal links are links to other pages on the same website. Much like last year, 2022’s figures suggest pages had fewer links on their mobile versions compared to their desktop counterparts.
The median number of internal links is now 16% higher on desktop than mobile at 56% and 48%, respectively. It’s likely a result of developers minimizing the navigation menus and footers on mobile for ease of use on smaller screens.
According to CrUX data, the 1,000 most popular websites have more outgoing internal links than less popular sites, a total of 137 links on desktop versus 106 on mobile. That’s more than two times higher than the median. This may be attributed to the use of mega-menus on larger sites that generally have more pages.
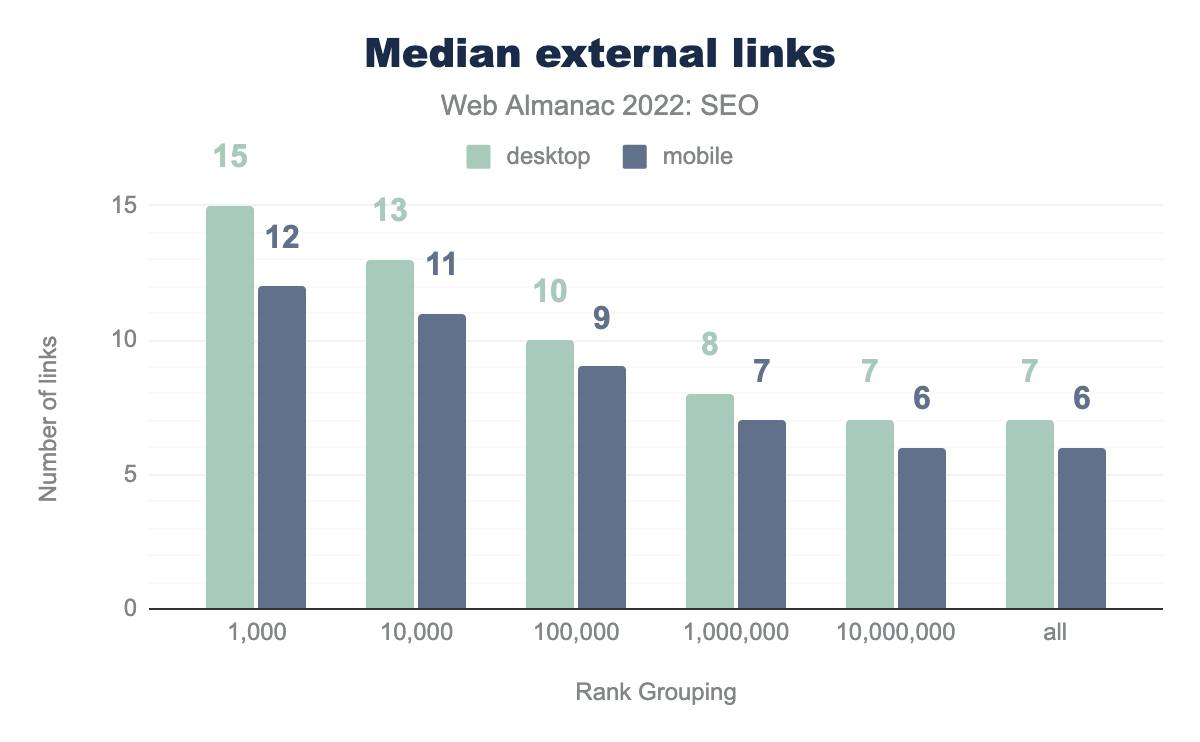
External links are links to other pages on a different website. The data, which has been consistent for the past few years, points to there being fewer external links on the mobile versions of pages compared to the desktop versions. Despite Google rolling out mobile-first indexing a few years ago, websites have not brought their mobile versions to parity with their desktop counterparts.
Anchor rel attribute use
In September of 2019, Google introduced attributes that allow publishers to classify links as being sponsored or user-generated content. These attributes are in addition to rel=nofollow, which was previously introduced in 2005. The newer attributes, rel=ugc and rel=sponsored, add additional information to the links.

rel noopener, nofollow, noreferrer, dofollow, sponsored, ugc, and follow. On desktop noopener is used on 34.3% of sites, nofollow on 28.8%, noreferrer on 18.8%, dofollow on 0.4%, sponsored on 0.5%, ugc on 0.4%, and finally follow is used on 0.3% of sites. Mobile is almost identical with 32.6%, 29.5%, 17.3%, 0.6%, 0.4%, 0.4%, and 0.3% respectively.rel attribute usage.
Not much has changed in terms of the adoption of the newer attributes, with rel=ugc appearing on 0.4% of desktop and mobile pages, and rel=sponsored appearing on 0.5% of desktop and 0.4% of mobile pages in 2022.
rel="dofollow" once again appeared on more pages than rel="ugc" and rel="sponsored". While this is technically not a problem, Google ignores rel="follow" and rel="dofollow" because, despite their inclusion, they are not actually official attributes.
rel="nofollow", which is a real attribute, was found in 2022 on 29.5% of mobile pages, which is 1.2% less than last year. Google treats nofollow as a hint, meaning the search engine can choose whether or not they respect the attribute.
AMP
AMP has been a controversial topic since its launch in 2015, with SEOs debating whether or not it had a direct impact on rankings. Google later released this statement (below) in its documentation for additional clarification:
While AMP itself isn’t a ranking factor, speed is a ranking factor for Google Search. Google Search applies the same standard to all pages, regardless of the technology used to build the page.
The future of AMP appears to be changing ever since the launch of Core Web Vitals. A main reason for previously implementing AMP, aside from improving page speed, was that it was necessary for inclusion in Top Carousels. In 2021, Google updated its requirements and outlined that any page is now eligible to appear in Top Carousels with or without AMP.
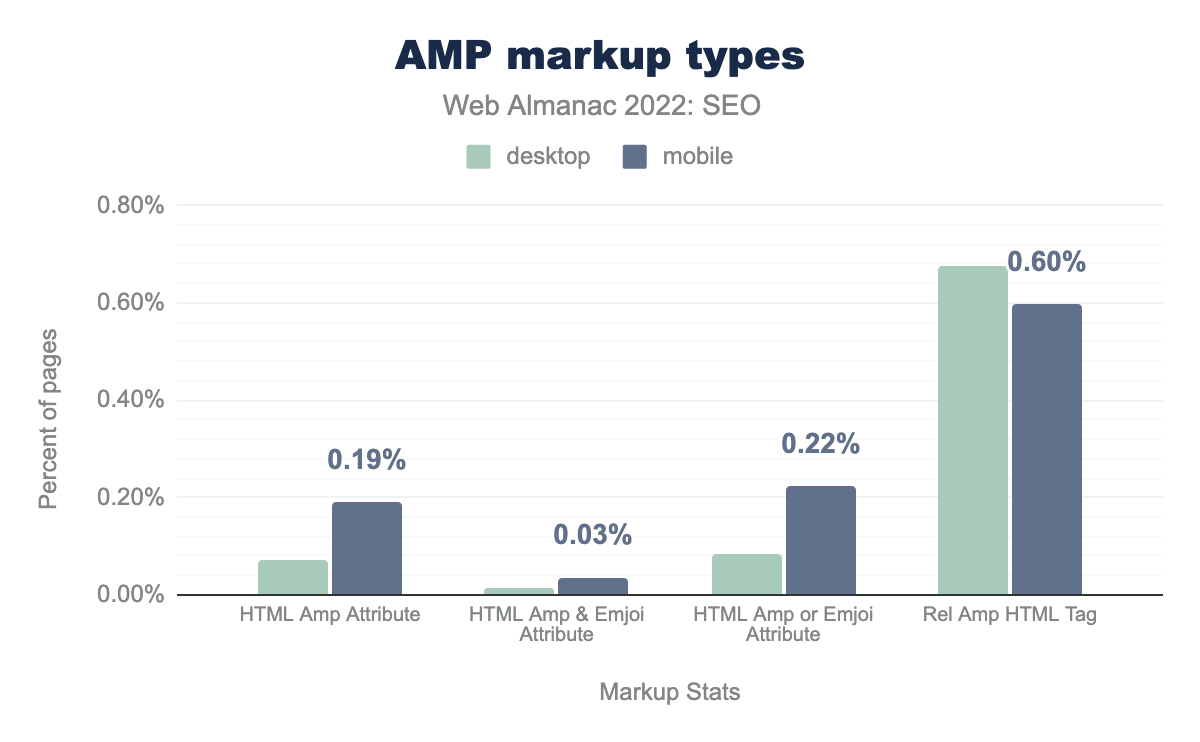
Desktop usage has dipped in 2022 from 0.09% to 0.07% compared to 2021 while mobile usage is down from 0.22% to 0.19% over the same time period.
Internationalization
Internationalization in SEO is the process of optimizing a website in line with best practices when targeting multiple countries and multiple languages, to ensure that it can be properly crawled and indexed by search engines.
Hreflang usage
Hreflang tags help Google and other search engines, such as Bing and Yandex, understand what the main language is on a given page. It is primarily used in international SEO campaigns when several different languages are used across different versions of a website.
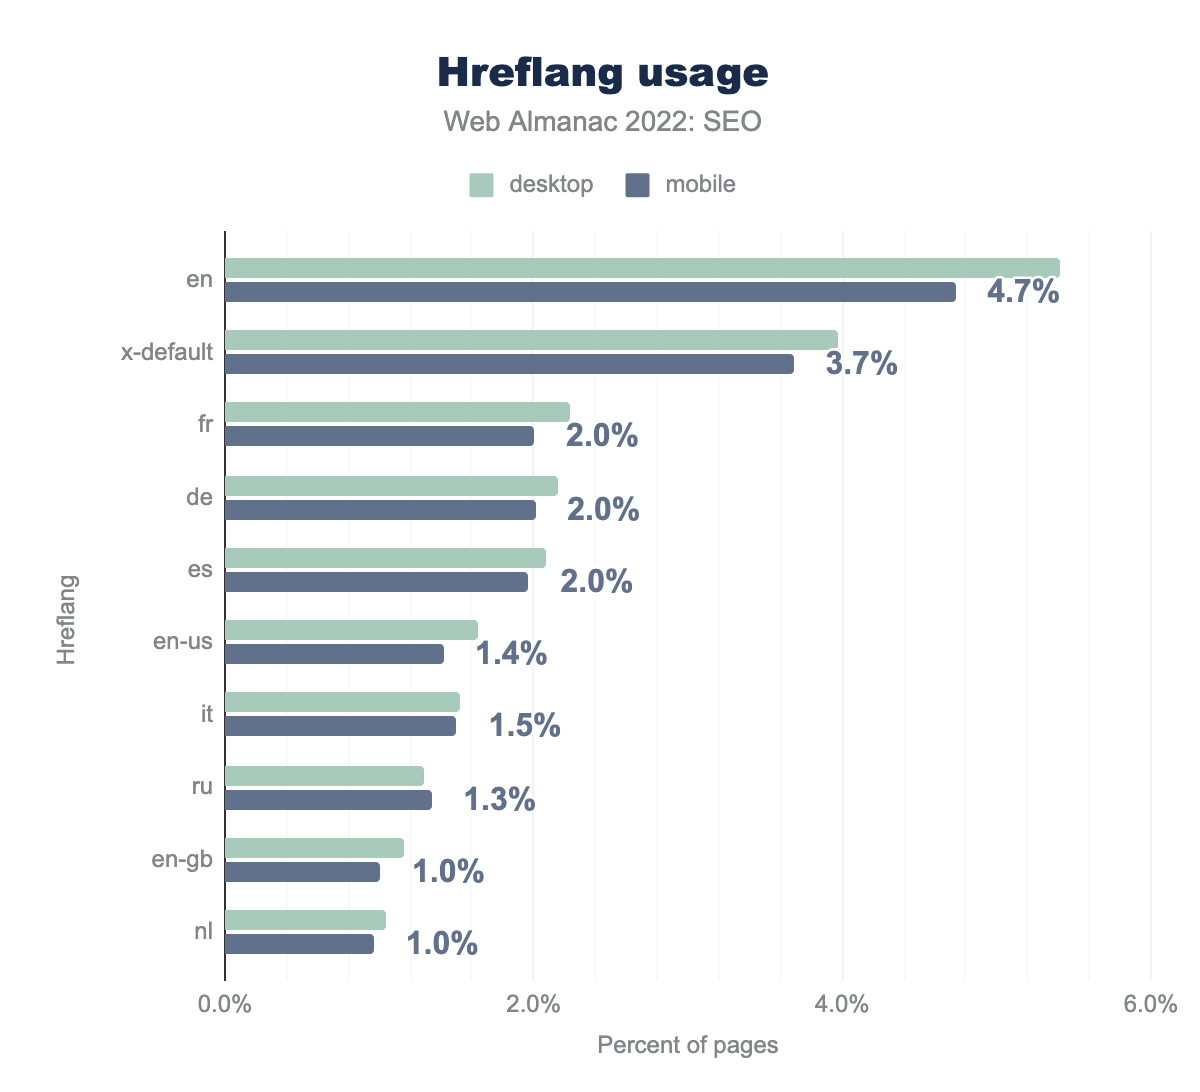
en is used on 5.4% of the pages in our dataset. x-default on 4.0%, fr on 2.2%, de on 2.2%, es on 2.1%, en-us on 1.6%, it on 1.5%, ru on 1.3%, en-gb on 1.2%, and finally nl on 1.0%. For mobile it’s almost identical with 4.7%, 3.7%, 2.0%, 2.0%, 2.0%, 1.4%, 1.5%, 1.3%, 1.0%, 1.0% respectively.Currently, 9.6% of sites use hreflang tags on desktop while 8.9% use them on mobile. This is a slight increase from 2021 when 9.0% of sites used hreflangs tags on desktop and 8.4% implemented them on mobile.
The most popular hreflang tag in 2022 is en [English], which accounts for 5.4% usage on desktop and 4.7% on mobile. Those percentages are approximately the same as the year before.
After x-default, which is the “fallback” version (and the second most common to be adopted), the hreflang tags for French, German and Spanish are the next most frequently used.
The three different ways to implement hreflang tags are via the <head>, link headers, or XML sitemaps. Note: As this data is looking solely at home pages, XML sitemaps are not included.
Content language usage
While Google tends to use hreflang tags, other search engines such as Bing prefer the content-language attribute. This can be implemented using two methods:
- HTML
- HTTP Header
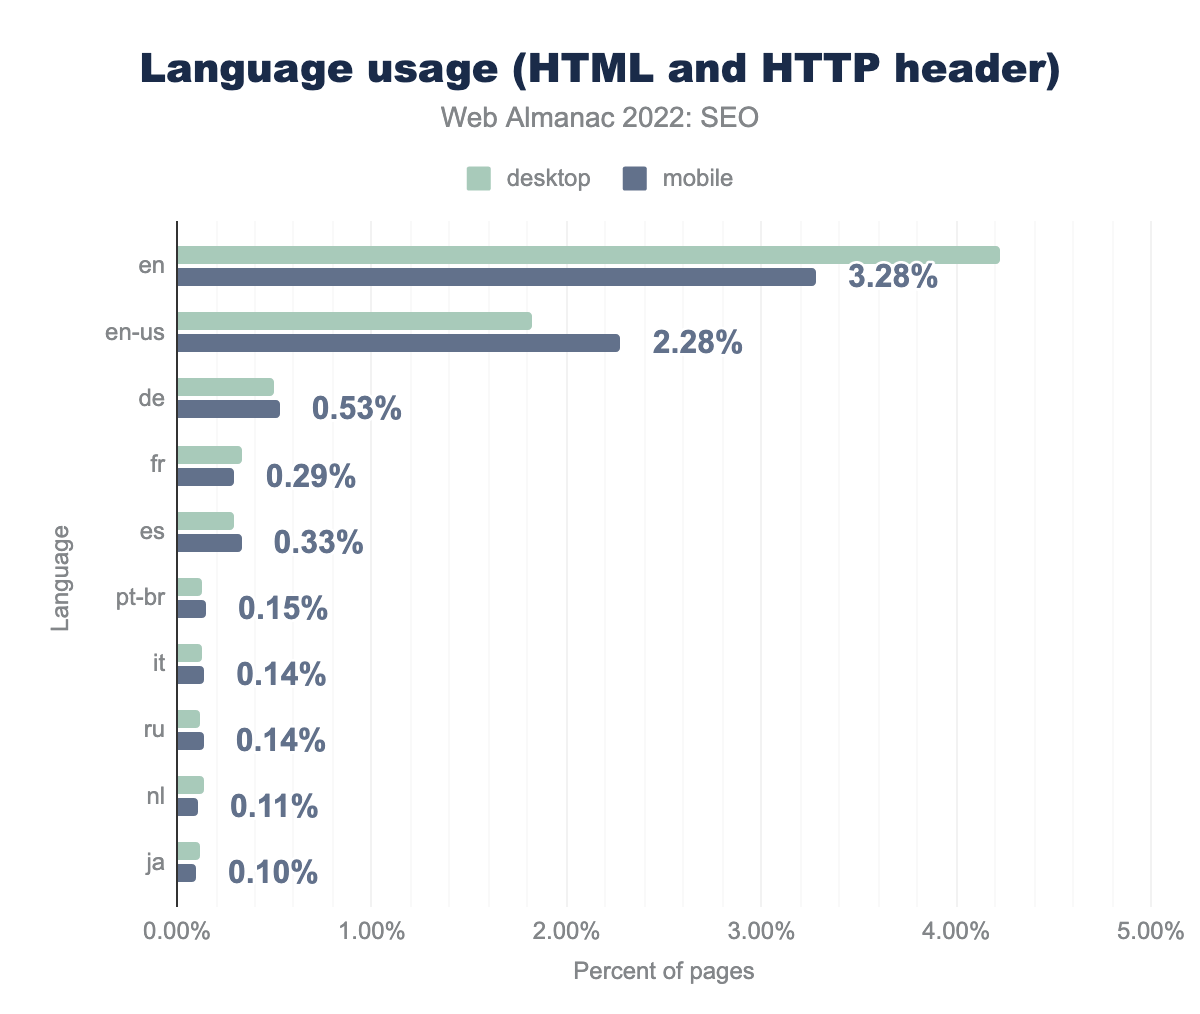
en is used on 4.22% of pages in our dataset, en-us on 1.83%, de on 0.50%, fr on 0.33%, es on 0.29%, pt-br on 0.12%, it on 0.13%, ru on 0.12%, nl on 0.14%, and finally ja on 0.11%. For mobile it’s very similar at 3.28%, 2.28%, 0.53%, 0.29%, 0.33%, 0.15%, 0.14%, 0.14%, 0.11%, and 0.10% respectively.In 2022, HTTP server response is the most popular implementation method of content-language, with 8.27% of mobile sites using this and 8.82% of desktop sites. However this has seen a decline in adoption on mobile compared to 2021 when 9.3% of mobile sites used it. Conversely, desktop has seen a slight increase compared to 2021 when 8.7% of sites used it.
HTML, on the other hand, has 2.98% adoption on desktop in 2022 and 3.01% adoption on mobile. But again there’s a decline in mobile usage compared to 2021 when 3.3% of mobile sites used the HTML tag.
Conclusion
Much like patterns in our data from 2021, 2020, and 2019, the majority of sites analyzed are showing small, yet consistent, improvement when it comes to various fundamentals of SEO, including having indexable and crawlable pages.
We have also seen an increasing focus on performance elements such as Core Web Vitals, with 39% of sites now having passing scores compared to just 20% in 2020 when the update was first announced. This seems to indicate sites are now taking Google’s guidance more to heart. Still, more work needs to be done across the web.
Newer introductions, such as the indexifembedded tag, are seeing slow pick-up. This underscores the continuous need for adoption of best practices and how much opportunity for growth there is in SEO, search engine friendliness, and the state of the web in general.


