SEO

Introduction
SEO (Search Engine Optimization) is the practice of optimizing a website or web page to increase the quantity and quality of its traffic from a search engine’s organic results.
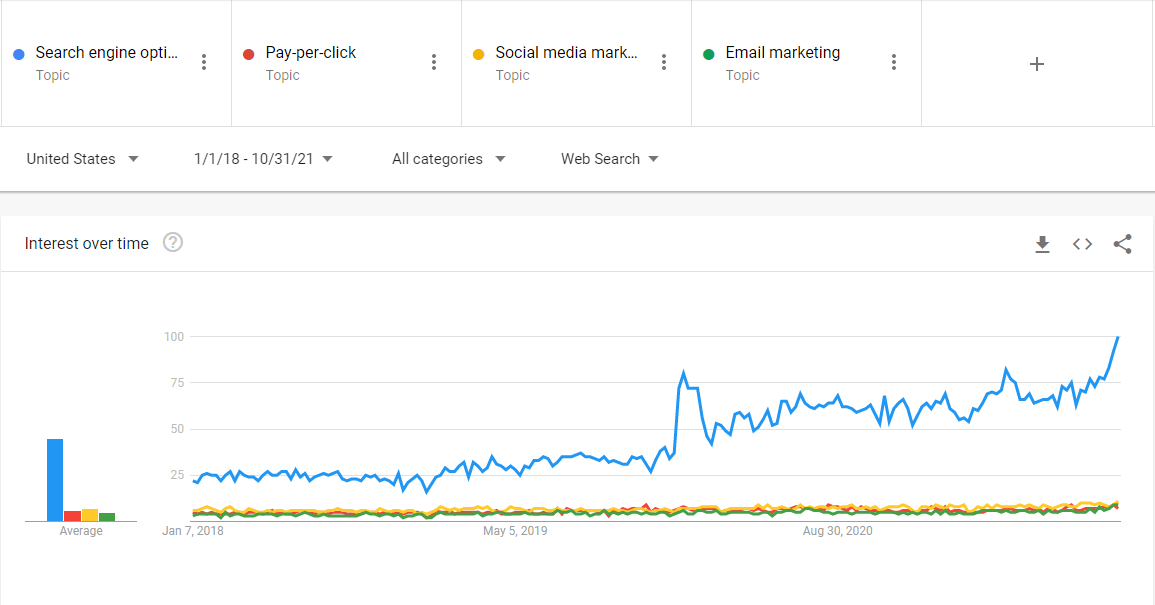
SEO is more popular than ever and has seen huge growth over the last couple years as companies sought new ways to reach customers. SEO’s popularity has far outpaced other digital channels.
The purpose of the SEO chapter of the Web Almanac is to analyze various elements related to optimizing a website. In this chapter, we’ll check if websites are providing a great experience for users and search engines.
Many sources of data were used for our analysis including Lighthouse, the Chrome User Experience Report (CrUX), as well as raw and rendered HTML elements from the HTTP Archive on mobile and desktop. In the case of the HTTP Archive and Lighthouse, the data is limited to the data identified from websites’ home pages only, not site-wide crawls. Keep that in mind when drawing conclusions from our results. You can learn more about the analysis on our Methodology page.
Read on to find out more about the current state of the web and its search engine friendliness.
Crawlability and Indexability
To return relevant results to these user queries, search engines have to create an index of the web. The process for that involves:
- Crawling - search engines use web crawlers, or spiders, to visit pages on the internet. They find new pages through sources such as sitemaps or links between pages.
- Processing - in this step search engines may render the content of the pages. They will extract information they need like content and links that they will use to build and update their index, rank pages, and discover new content.
- Indexing - Pages that meet certain indexability requirements around content quality and uniqueness will typically be indexed. These indexed pages are eligible to be returned for user queries.
Let’s look at some issues that may impact crawlability and indexability.
robots.txt
robots.txt is a file located in the root folder of each subdomain on a website that tells robots such as search engine crawlers where they can and can’t go.
81.9% of websites make use of the robots.txt file (mobile). Compared with previous years (72.2% in 2019 and 80.5% in 2020), that’s a slight improvement.
Having a robots.txt is not a requirement. If it’s returning a 404 not found, Google assumes that every page on a website can be crawled. Other search engines may treat this differently.
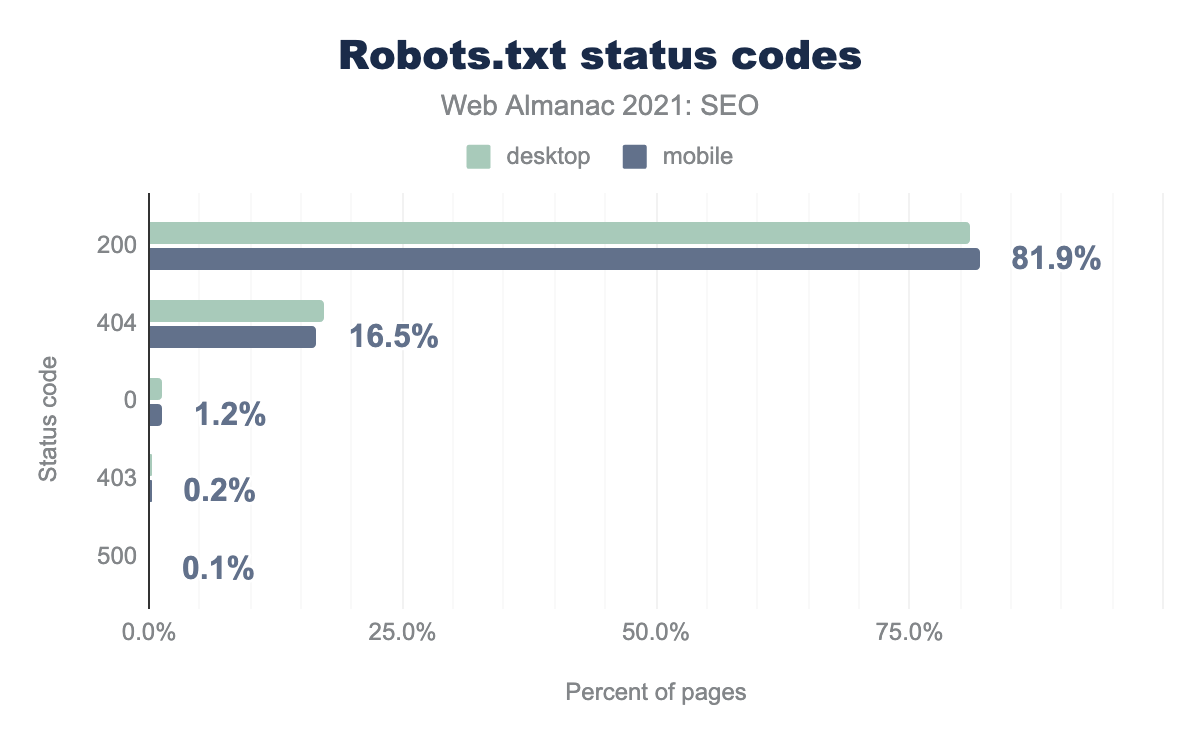
Using robots.txt allows website owners to control search engine robots. However, the data showed that as many as 16.5% of websites have no robots.txt file.
Websites may have misconfigured robots.txt files. For example, some popular websites were (presumably mistakenly) blocking search engines. Google may keep these websites indexed for a period of time, but eventually their visibility in search results will be lessened.
Another category of errors related to robots.txt is accessibility and/or network errors, meaning the robots.txt exists but cannot be accessed. If Google requests a robots.txt file and gets such an error, the bot may stop requesting pages for a while. The logic behind this is that search engines are unsure if a given page can or cannot be crawled, so it waits until robots.txt becomes accessible.
~0.3% of websites in our dataset returned either 403 Forbidden or 5xx. Different bots may handle these errors differently, so we don’t know exactly what Googlebot may have seen.
The latest information available from Google, from 2019 is that as many as 5% of websites were temporarily returning 5xx on robots.txt, while as many as 26% were unreachable.
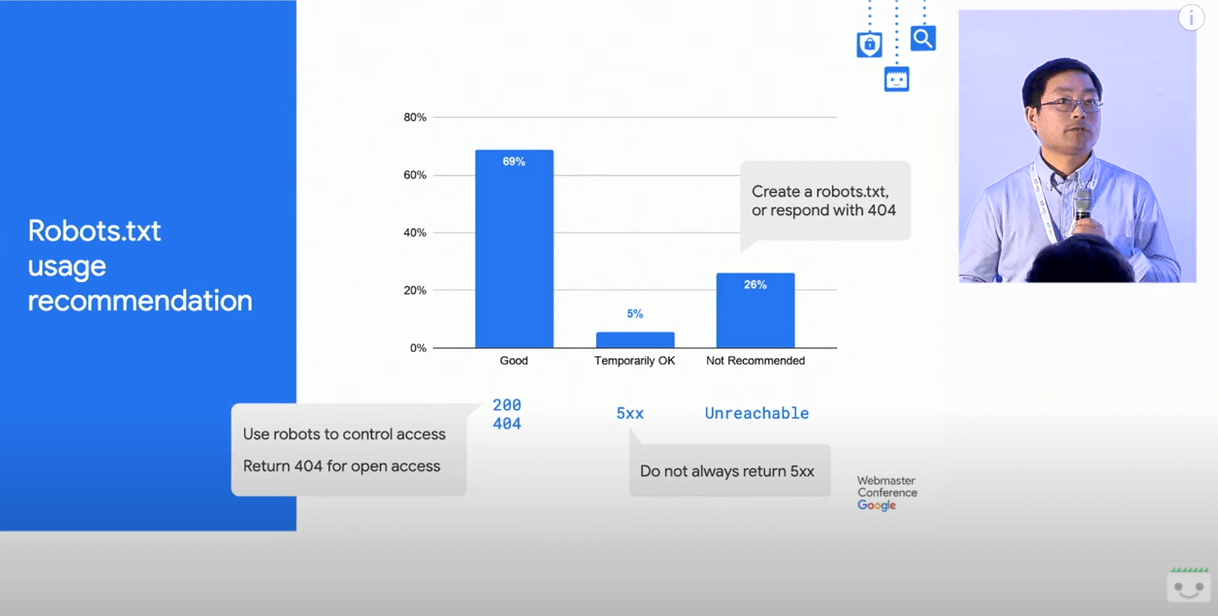
robots.txt. As much as 26% of sites were Unreachable.Two things may cause the discrepancy between the HTTP Archive and Google data:
Google presents data from 2 years back while the HTTP Archive is based on recent information, or
The HTTP Archive focuses on websites that are popular enough to be included in the CrUX data, while Google tries to visit all known websites.
robots.txt size
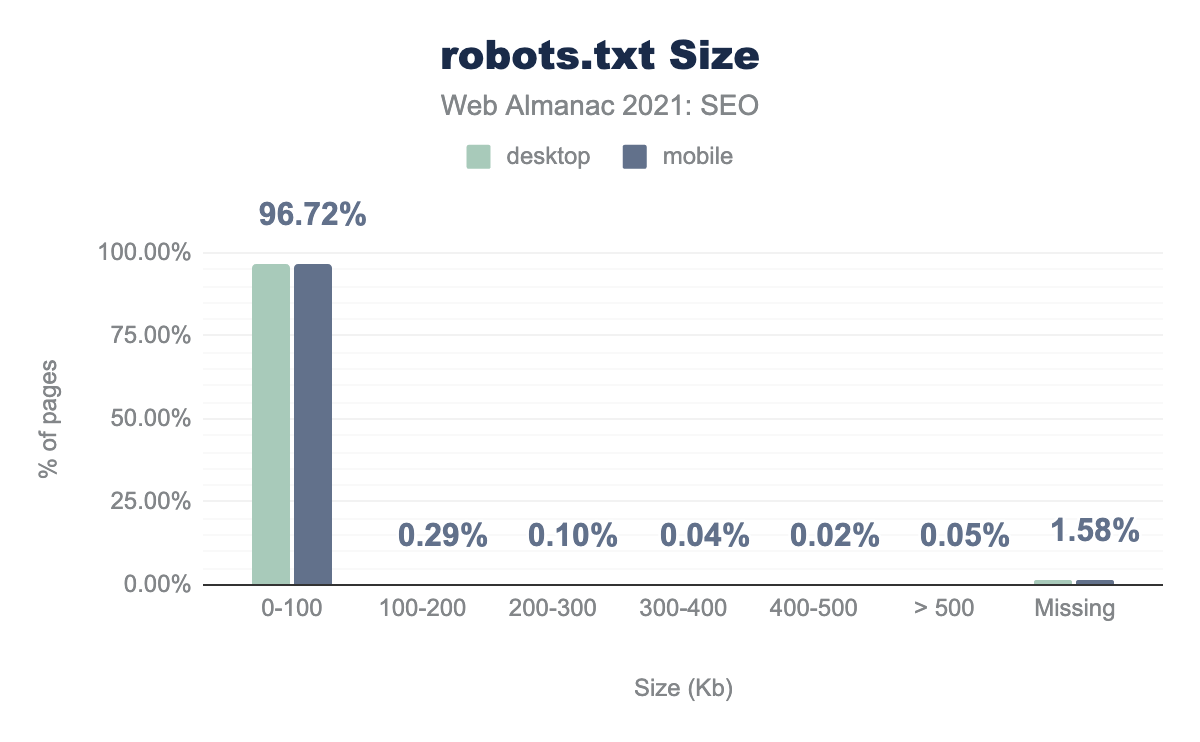
robots.txt size distribution.
Most robots.txt files are fairly small, weighing between 0-100 kb. However, we did find over 3,000 domains that have a robots.txt file size over 500 KiB which is beyond Google’s max limit. Rules after this size limit will be ignored.
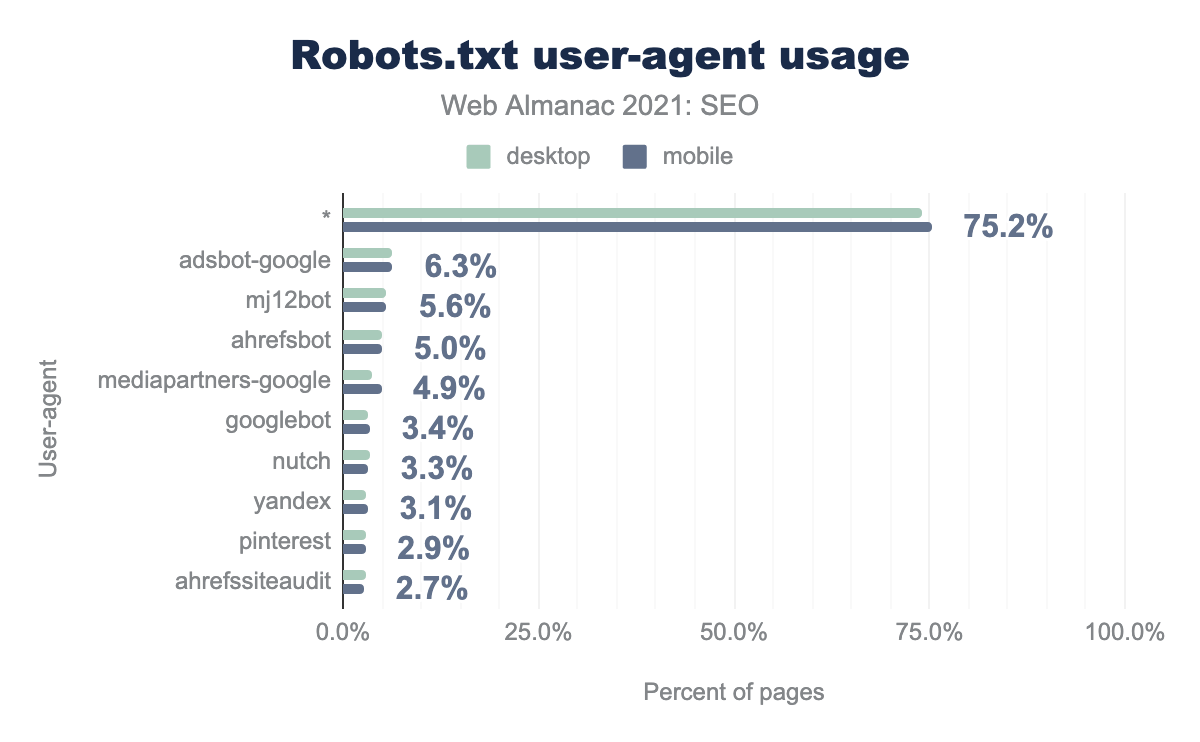
adsbot-google, 5.6% for mj12bot, 5.0% for ahrefsbot, 4.9% for mediapartners-google, 3.4% for googlebot, 3.3% for nutch, 3.1% for yandex, 2.9% for pinterest, 2.7% for ahrefssiteaudit.robots.txt user-agent usage.
You can declare a rule for all robots or specify a rule for specific robots. Bots usually try to follow the most specific rule for their user-agents. User-agent: Googlebot will refer to Googlebot only, while User-agent: * will refer to all bots that don’t have a more specific rule.
We saw two popular SEO-related robots: mj12bot (Majestic) and ahrefsbot (Ahrefs) in the top 5 most specified user agents.
robots.txt search engine breakdown
| User-agent | Desktop | Mobile |
|---|---|---|
| Googlebot | 3.3% | 3.4% |
| Bingbot | 2.5% | 3.4% |
| Baiduspider | 1.9% | 1.9% |
| Yandexbot | 0.5% | 0.5% |
robots.txt search engine breakdown.
When looking at rules applying to particular search engines, Googlebot was the most referenced appearing on 3.3% of crawled websites.
Robots rules related to other search engines, such as Bing, Baidu, and Yandex, are less popular (respectively 2.5%, 1.9%, and 0.5%). We did not look at what rules were applied to these bots.
Canonical tags
The web is a massive set of documents, some of which are duplicates. To prevent duplicate content issues, webmasters can use canonical tags to tell search engines which version they prefer to be indexed. Canonicals also help to consolidate signals such as links to the ranking page.
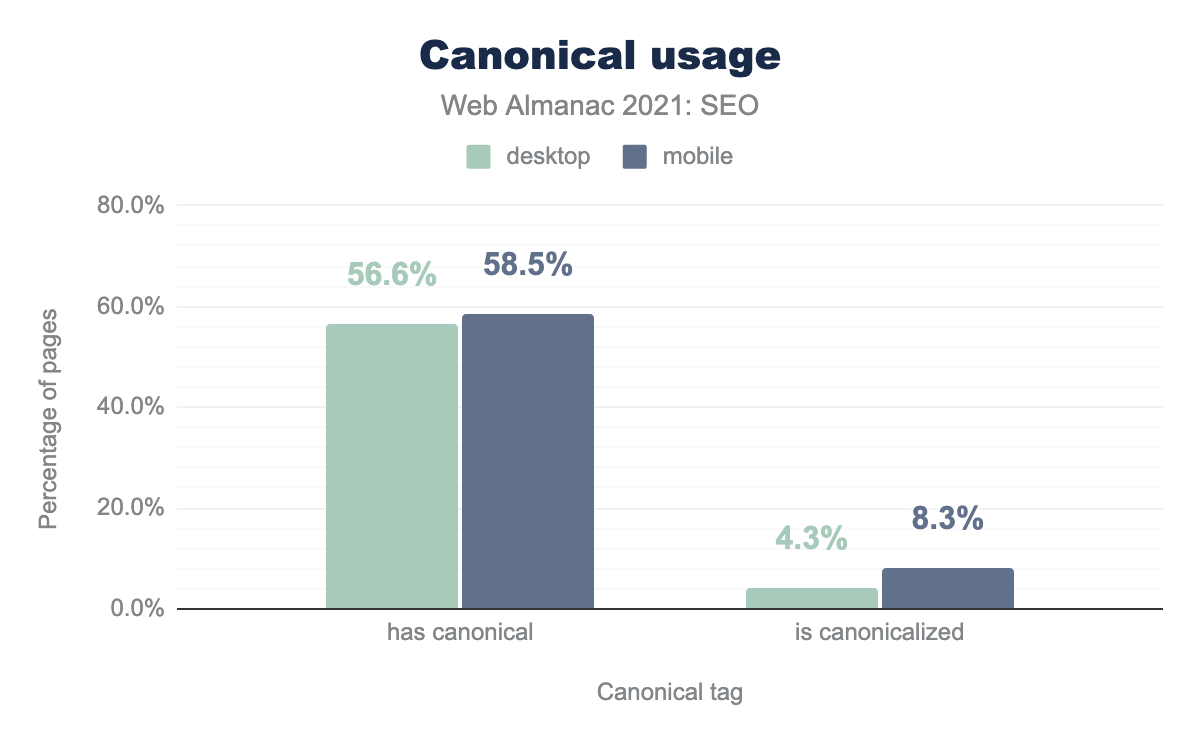
The data shows increased adoption of canonical tags over the years. For example, 2019’s edition shows that 48.3% of mobile pages were using a canonical tag. In 2020’s edition, the percentage grew to 53.6%, and in 2021 we see 58.5%.
More mobile pages have canonicals set than their desktop counterparts. In addition, 8.3% of mobile pages and 4.3% of desktop pages are canonicalized to another page so that they provide a clear hint to Google and other search engines that the page indicated in the canonical tag is the one that should be indexed.
A higher number of canonicalized pages on mobile seems to be related to websites using separate mobile URLs. In these cases, Google recommends placing a rel="canonical" tag pointing to the corresponding desktop URLs.
Our dataset and analysis are limited to home pages of websites; the data is likely to be different when considering all URLs on the tested websites.
Two methods of implementing canonical tags
When implementing canonicals, there are two methods to specify canonical tags:
- In the HTML’s
<head>section of a page - In the HTTP headers (via the
LinkHTTP header)
Implementing canonical tags in the <head> of a HTML page is much more popular than using the Link header method. Implementing the tag in the head section is generally considered easier, which is why that usage so much higher.
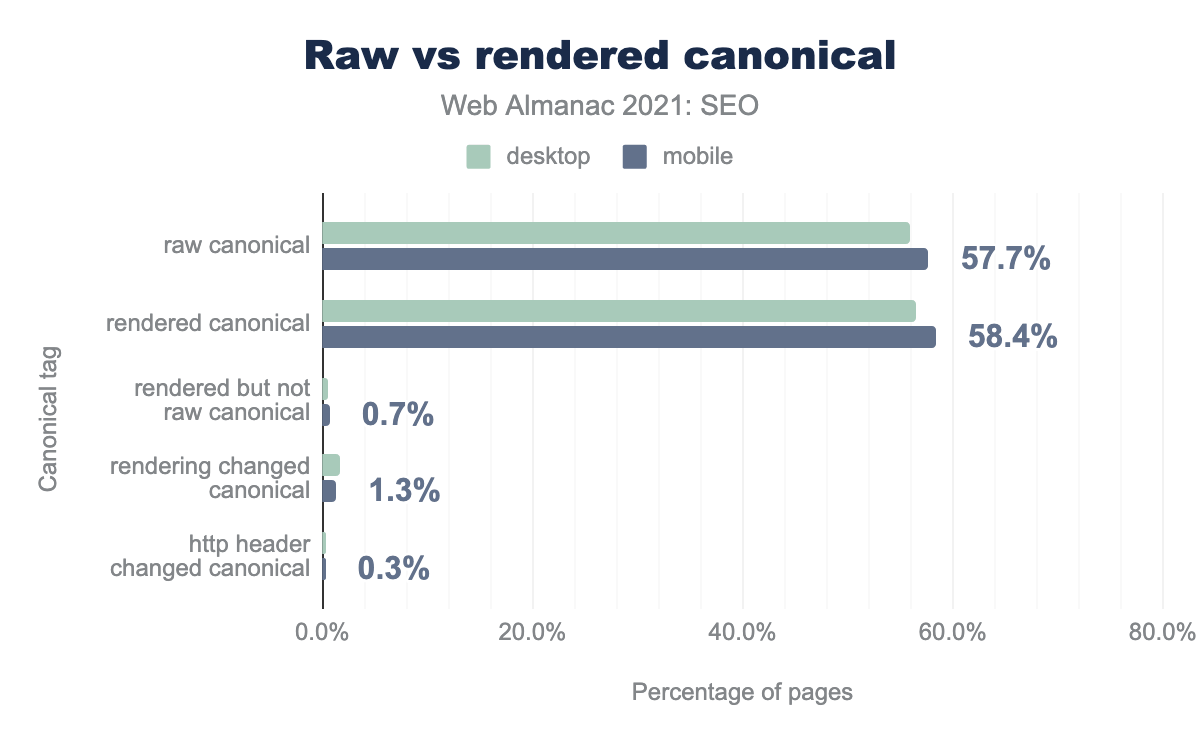
We also saw a slight change (< 1%) in canonical between the raw HTML delivered, and the rendered HTML after JavaScript has been applied.
Conflicting canonical tags
Sometimes pages contain more than one canonical tag. When there are conflicting signals like this, search engines will have to figure it out. One of Google’s Search Advocates, Martin Splitt, once said it causes undefined behavior on Google’s end.
The previous figure shows as many as 1.3% of mobile pages have different canonical tags in the initial HTML and the rendered version.
Last year’s chapter noted that “A similar conflict can be found with the different implementation methods, with 0.15% of the mobile pages and 0.17% of the desktop ones showing conflicts between the canonical tags implemented via their HTTP headers and HTML head.”
This year’s data on that conflict is even more worrisome. Pages are sending conflicting signals in 0.4% of cases on desktop and 0.3% of cases on mobile.
As the Web Almanac data only looks on home pages, there may be additional problems with pages located deeper in the architecture, which are pages more likely to be in need of canonical signals.
Page Experience
2021 saw an increased focus on user experience. Google launched the Page Experience Update which included existing signals, such as HTTPS and mobile-friendliness, and new speed metrics called Core Web Vitals.
HTTPS
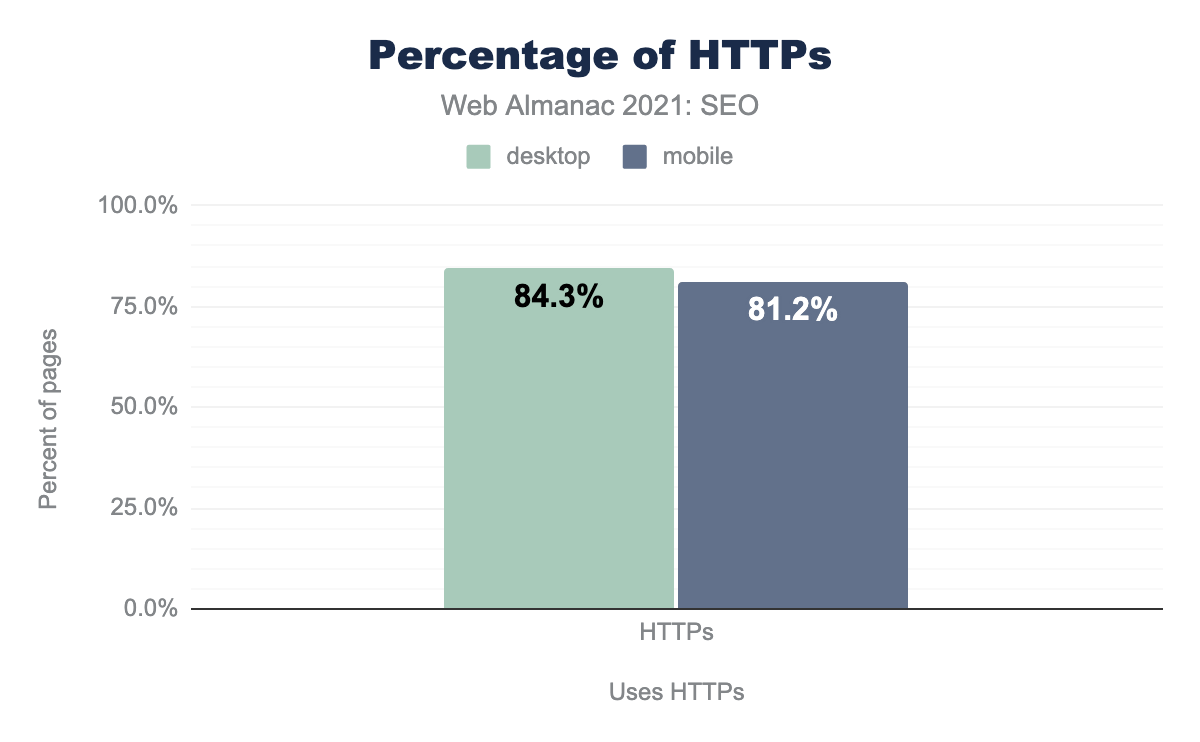
Adoption of HTTPS is still increasing. HTTPS was the default on 81.2% of mobile pages and 84.3% of desktop pages. That’s up nearly 8% on mobile websites and 7% on Desktop websites year over year.
Mobile-friendliness
There’s a slight uptick in mobile-friendliness this year. Responsive design implementations have increased while dynamic serving has remained relatively flat.
Responsive design sends the same code and adjusts how the website is displayed based on the screen size, while dynamic serving will send different code depending on the device. The viewport meta tag was used to identify responsive websites vs the Vary: User-Agent header to identify websites using dynamic serving.
viewport meta tag—a signal of mobile friendliness.
91.1% of mobile pages include the viewport meta tag, up from 89.2% in 2020. 86.4% of desktop pages also included the viewport meta tag, up from 83.8% in 2020.
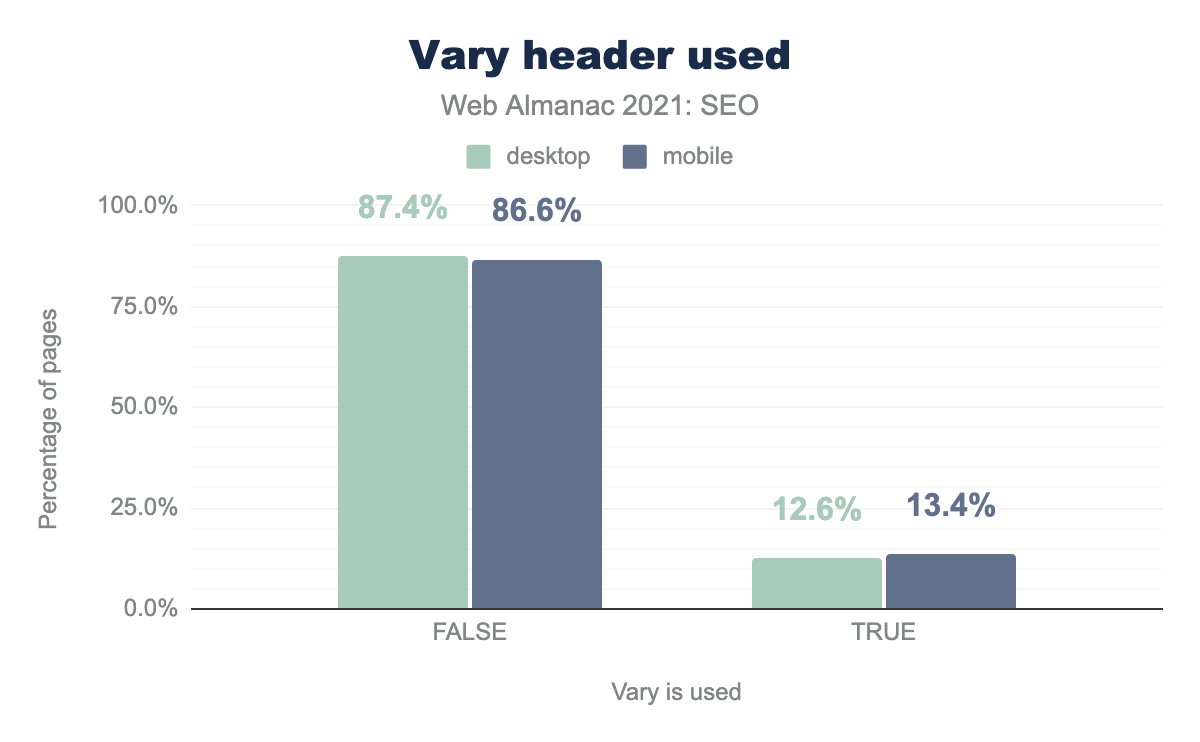
vary header used to identify mobile-friendless. We found that most web pages utilized a response design (87.4% for desktop and 86.6% for mobile), compared to pages that used dynamic serving (12.6% for desktop and 13.4% for mobile).Vary: User-Agent header usage.
For the Vary: User-Agent header, the numbers were pretty much unchanged with 12.6% of desktop pages and 13.4% of mobile pages with this footprint.
One of the biggest reasons for failing mobile-friendliness was that 13.5% of pages did not use a legible font size. Meaning 60% or more of the text had a font size smaller than 12px which can be hard to read on mobile.
Core Web Vitals
Core Web Vitals are the new speed metrics that are part of Google’s Page Experience signals. The metrics measure visual load with Largest Contentful Paint (LCP), visual stability with Cumulative Layout Shift (CLS), and interactivity with First Input Delay (FID).
The data comes from the Chrome User Experience Report (CrUX), which records real-world data from opted-in Chrome users.
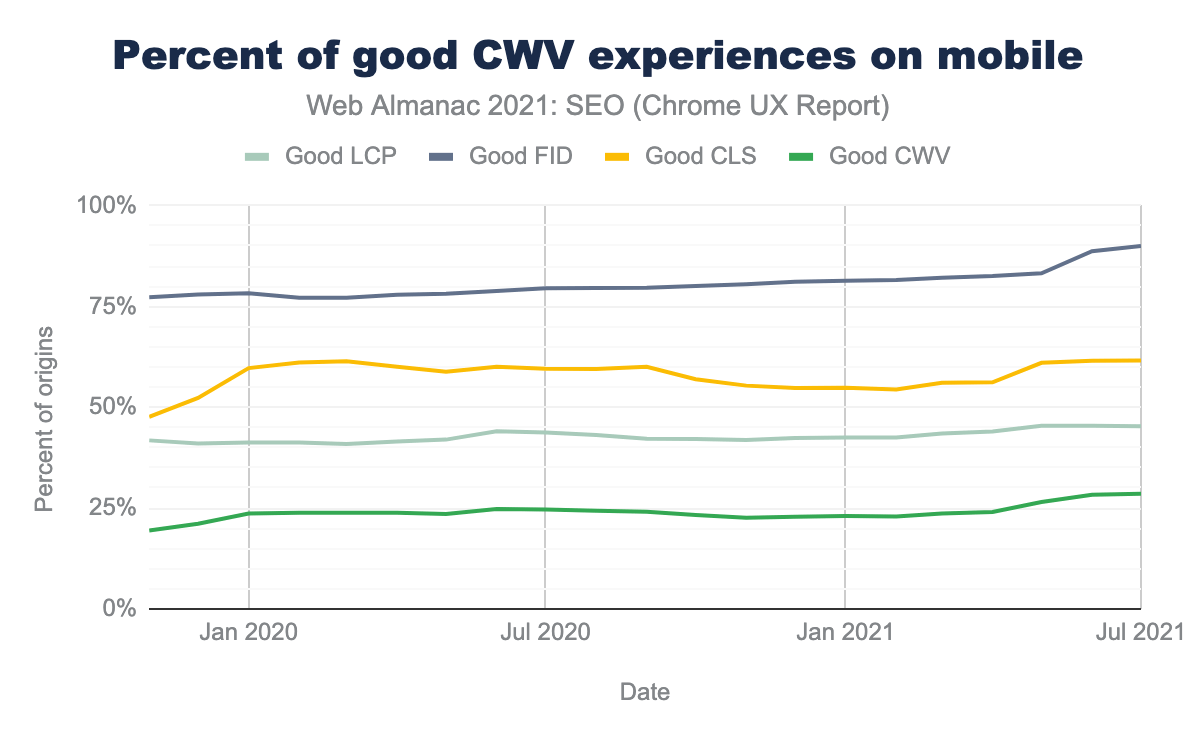
29% of mobile websites are now passing Core Web Vitals thresholds, up from 20% last year. Most websites are passing FID, but website owners seem to be struggling to improve CLS and LCP. See the Performance chapter for more on this topic.
On-Page
Search engines look at your page’s content to determine whether it’s a relevant result for the search query. Other on-page elements may also impact rankings or appearance on the search engines.
Metadata
Metadata includes <title> elements and <meta name="description"> tags. Metadata can directly and/or indirectly affect SEO performance.
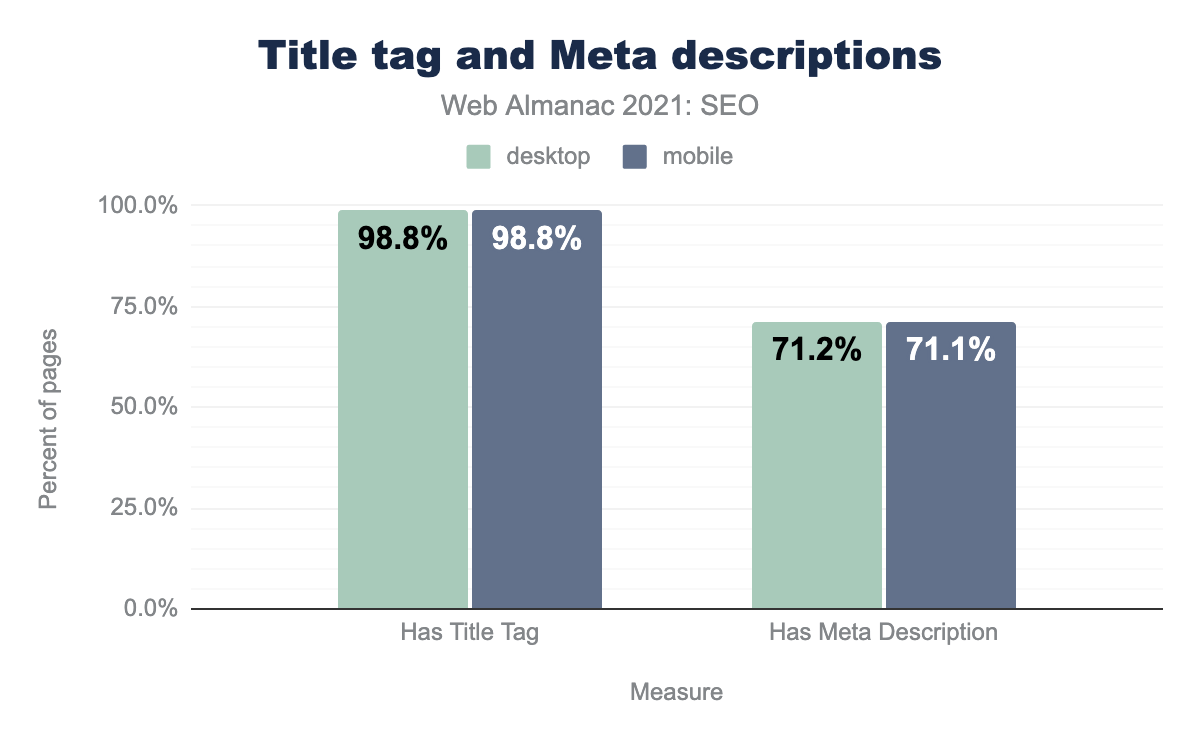
title element and 71.1% of mobile and desktop pages had a meta description.In 2021, 98.8% of desktop and mobile pages had <title> elements. 71.1% of desktop and mobile home pages had <meta name="description"> tags.
<title> Element
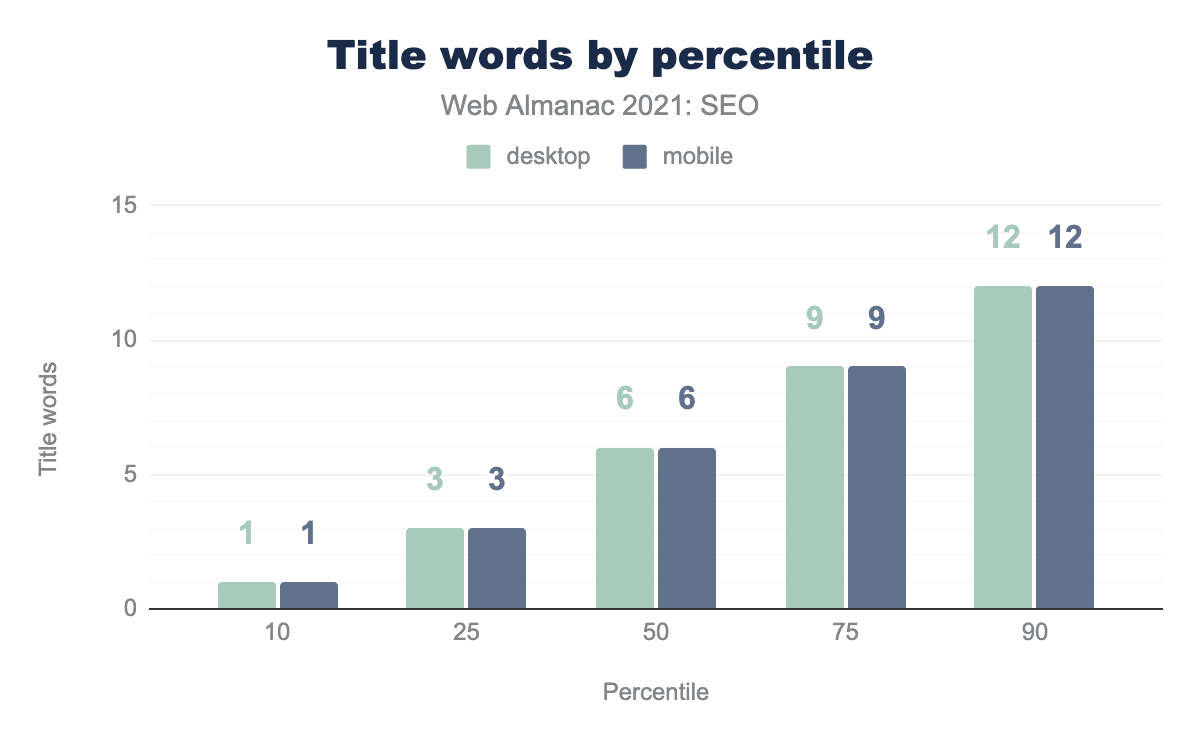
The <title> element is an on-page ranking factor that provides a strong hint regarding page relevance and may appear on the Search Engine Results Page (SERP). In August 2021 Google started re-writing more titles in their search results.
In 2021:
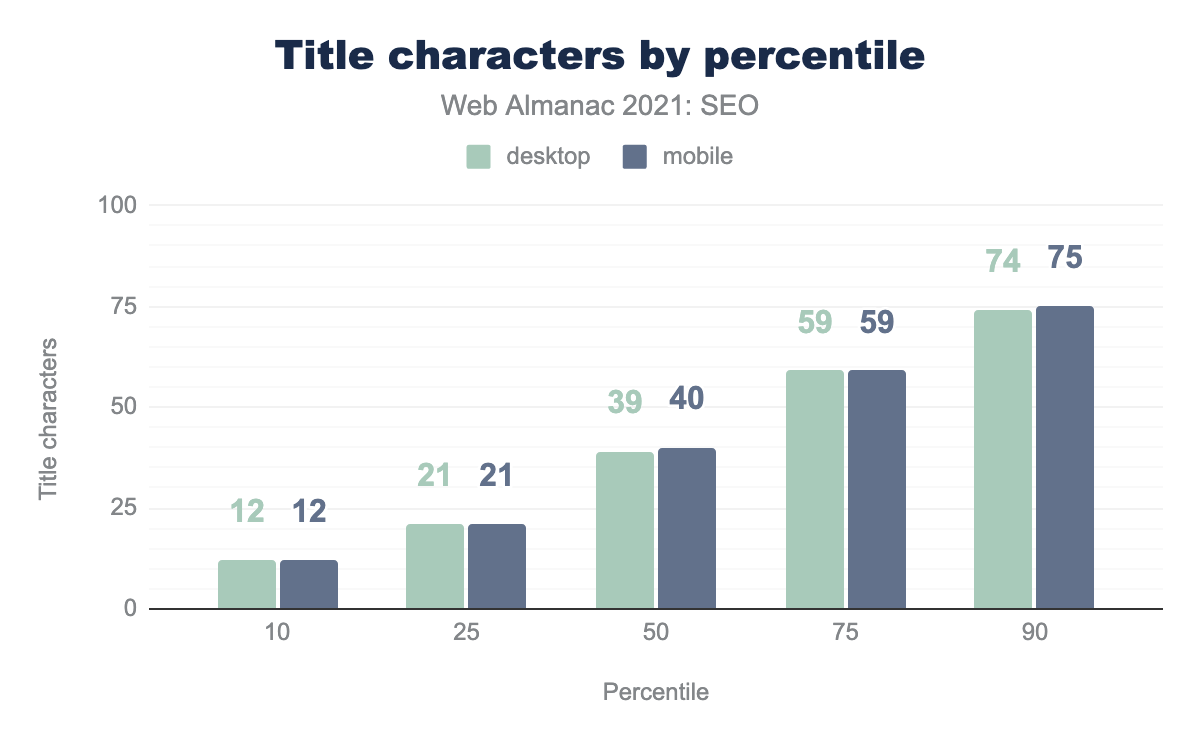
- The median page
<title>contained 6 words. - The median page
<title>contained 39 and 40 characters on desktop and mobile, respectively. - 10% of pages had
<title>elements containing 12 words. - 10% of desktop and mobile pages had
<title>elements containing 74 and 75 characters, respectively.
Most of these stats are relatively unchanged since last year. Reminder that these are titles on home pages which tend to be shorter than those used on deeper pages.
Meta description tag
The <meta name="description> tag does not directly impact rankings. However, it may appear as the page description on the SERP.
In 2021:
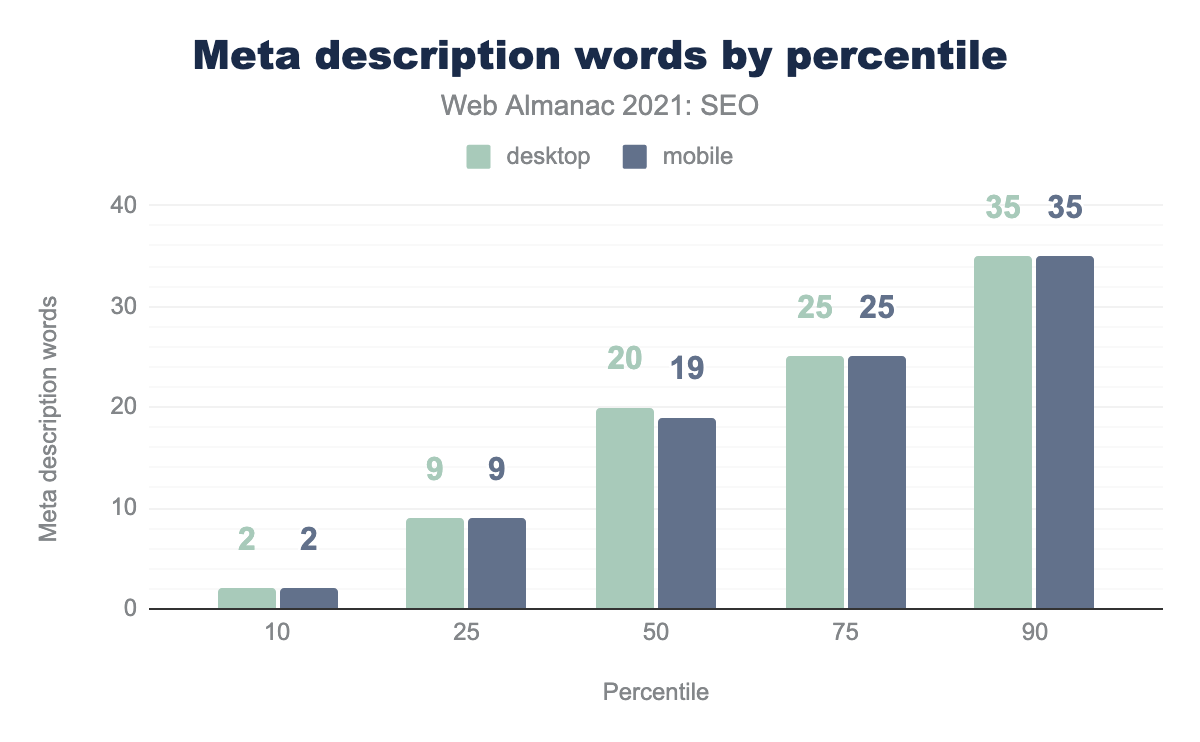
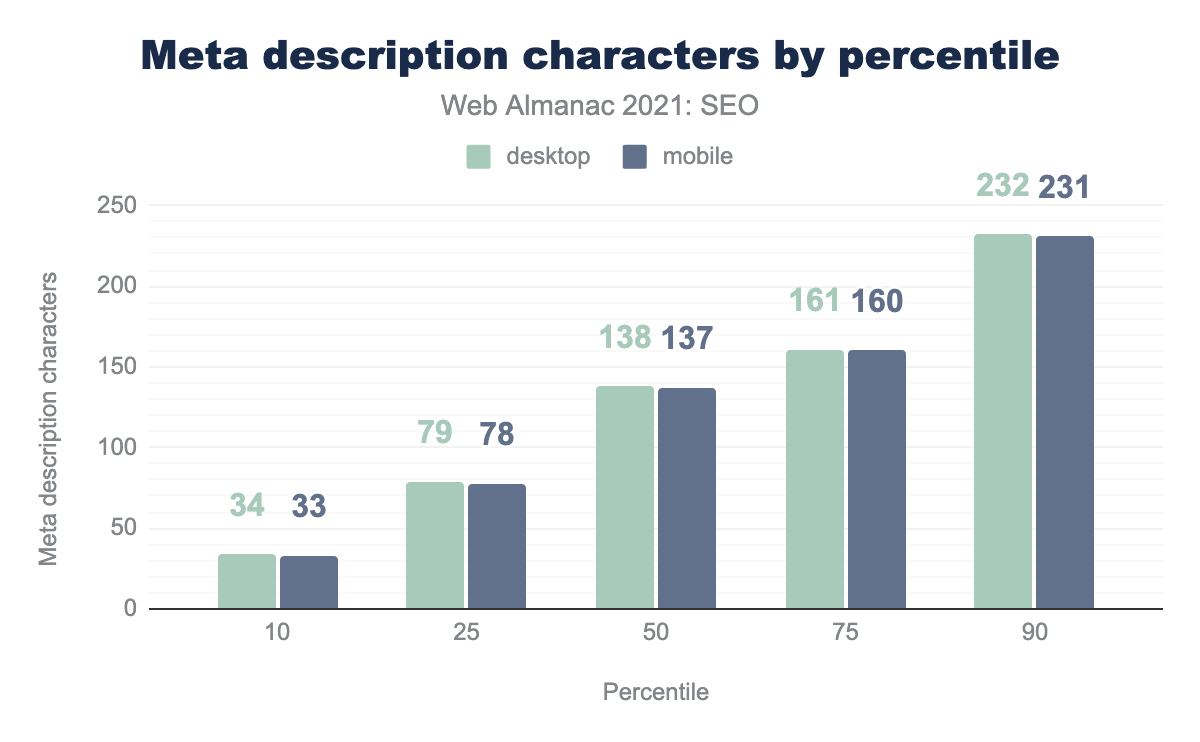
- The median desktop and mobile page
<meta name="description>tag contained 20 and 19 words, respectively. - The median desktop and mobile page
<meta name="description>tag contained 138 and 127 characters, respectively. - 10% of desktop and mobile pages had
<meta name="description>tags containing 35 words. - 10% of desktop and mobile pages had
<meta name="description>tags containing 232 and 231 characters, respectively.
These numbers are relatively unchanged from last year.
Images

<img> elements per page per percentile (10, 25, 50, 75, and 90). The median desktop page featured 21 <img> elements and the median mobile page featured 19 <img> elements.Images can directly and indirectly impact SEO as they impact image search rankings and page performance.
- 10% of pages have two or fewer
<img>tags. That’s true of both desktop and mobile. - The median desktop page has 21
<img>tags while the median mobile page has 19<img>tags. - 10% of desktop pages have 83 or more
<img>tags. 10% of mobile pages have 73 or more<img>tags.
These numbers have changed very little since 2020.
Image alt attributes
The alt attribute on the <img> element helps explain image content and impacts accessibility.
Note that missing alt attributes may not indicate a problem. Pages may include extremely small or blank images which don’t require an alt attribute for SEO (nor accessibility) reasons.
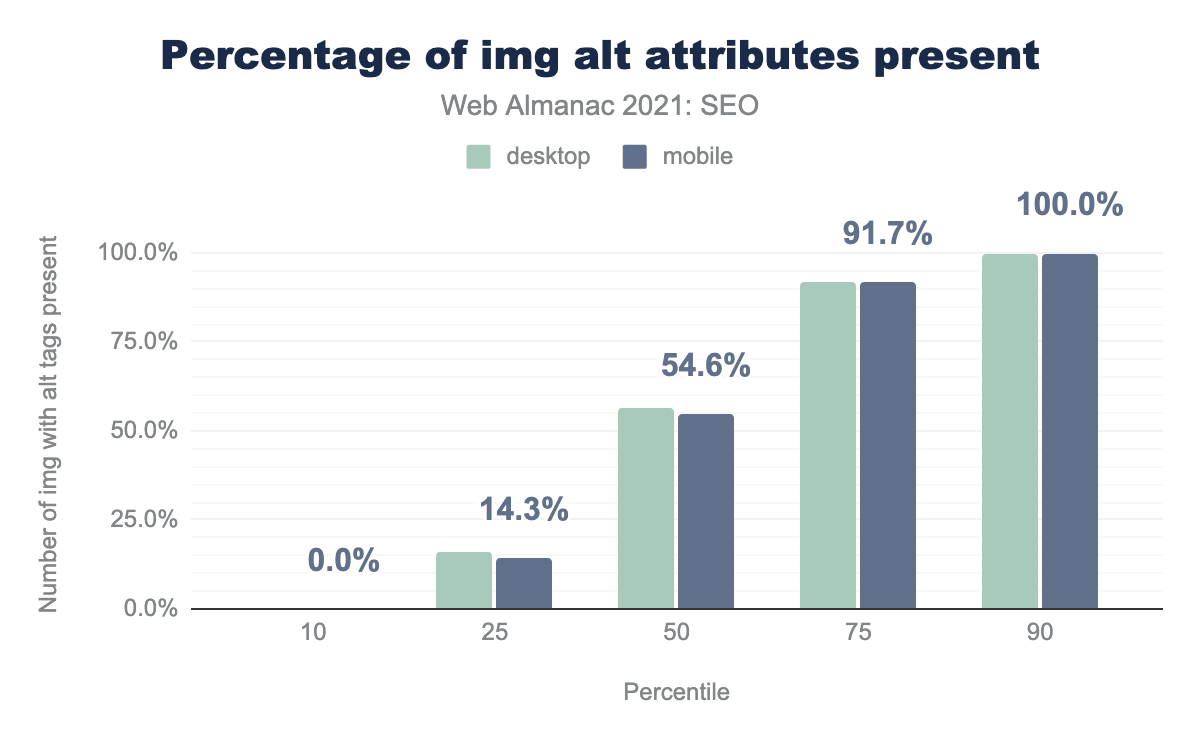
alt attributes present per percentile (10, 25, 50, 75, and 90). Our data found the median web page contained 54.6% of images with an alt attribute on mobile pages and 56.5% on desktop pages.alt attributes.
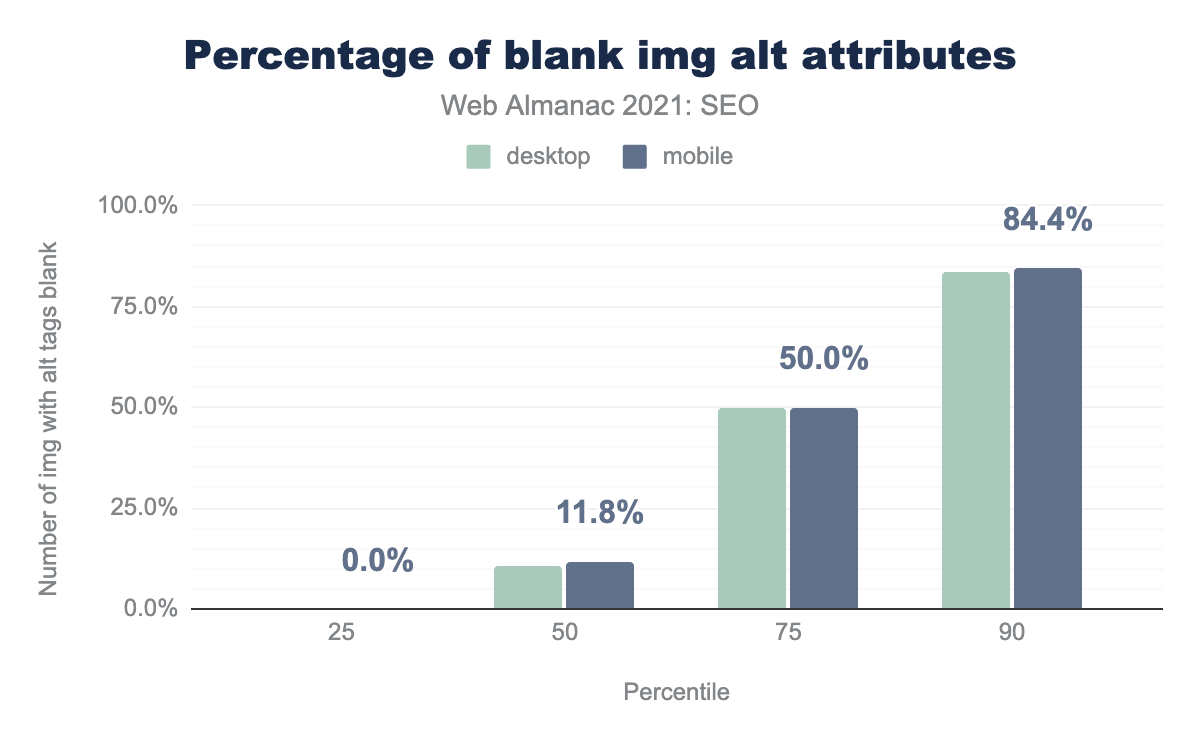
alt attributes on desktop and 11.8% blank alt attributes on mobile.alt attributes that were blank.
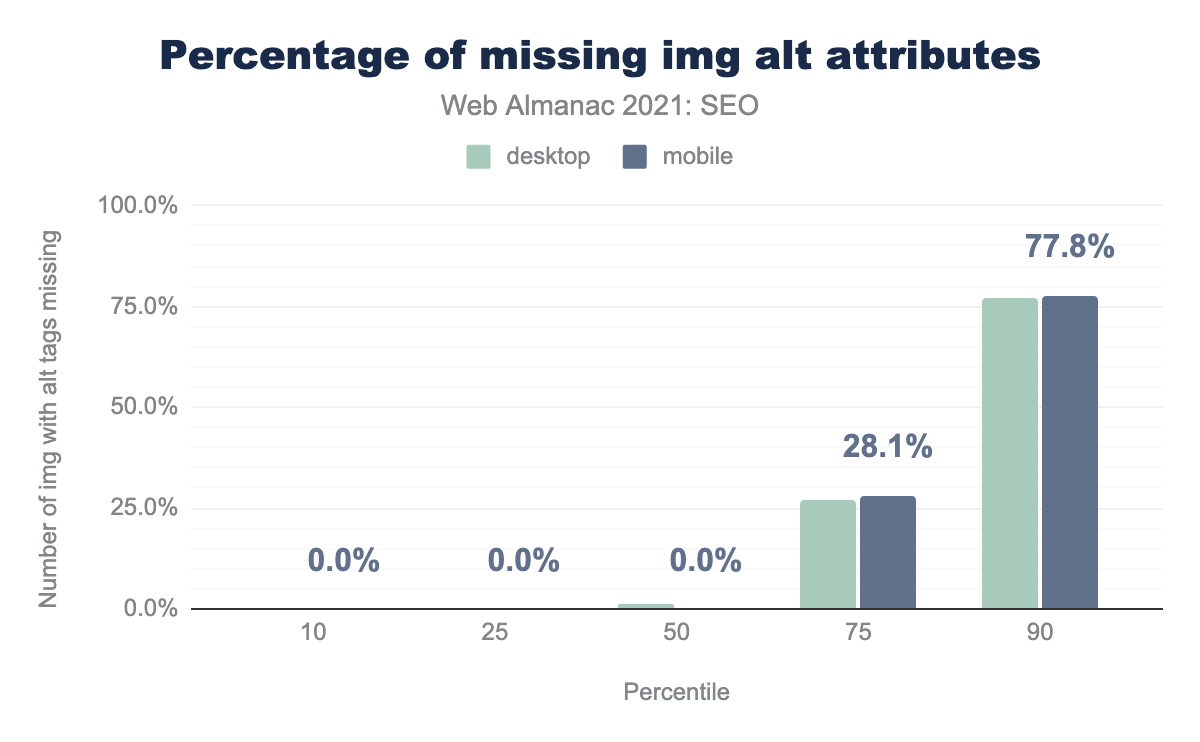
alt attributes missing per percentile (10, 25, 50, 75, and 90). The median web page had 1.4% of images with alt attributes missing on desktop on zero alt attributes missing on mobile.alt attributes.
We found that:
- On the median desktop page, 56.5% of
<img>tags have analtattribute. This is a slight increase versus 2020. - On the median mobile page, 54.6% of
<img>tags have analtattribute. This is a slight increase versus 2020. - However, on the median desktop and mobile pages 10.5% and 11.8% of
<img>tags have blankaltattributes (respectively). This is effectively the same as 2020. - On the median desktop and mobile pages there are zero or close to zero
<img>tags missingaltattributes. This is an improvement over 2020, when 2-3% of<img>tags on median pages were missingaltattributes.
Image loading attributes
The loading attribute on <img> elements affects how user agents prioritize rendering and display of images on the page. It may impact user experience and page load performance, both of which impact SEO success.
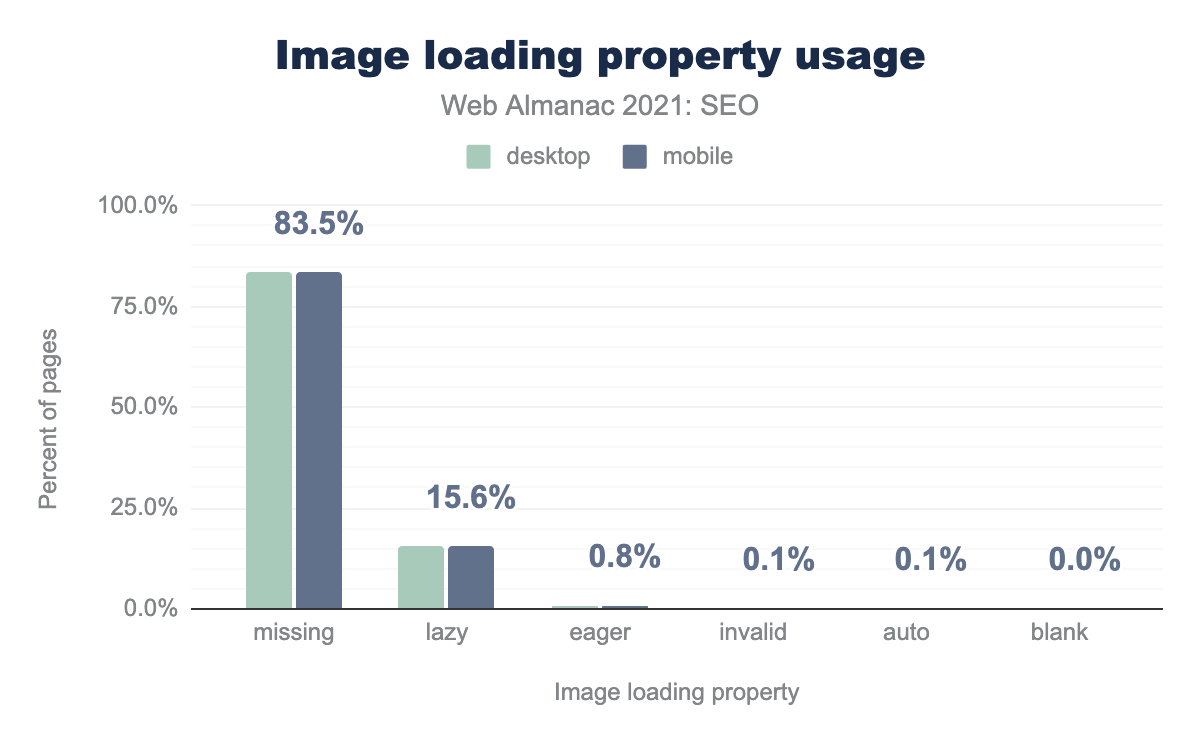
loading="lazy" while only .8% of desktop and mobile pages use loading="eager". The number of other cases is less than 1% on desktop and mobile pages, this includes cases with an invalid or blank property or with loading="auto".We saw that:
- 85.5% of pages don’t use any image
loadingproperty. - 15.6% of pages use
loading="lazy"which delays loading an image until it is close to being in the viewport. - 0.8% of pages use
loading="eager"which loads the image as soon as the browser loads the code. - 0.1% of pages use invalid loading properties.
- 0.1% of pages use
loading="auto"which uses the default browser loading method.
Word count
The number of words on a page isn’t a ranking factor, but the way pages deliver words can profoundly impact rankings. Words can be in the raw page code or the rendered content.
Rendered word count
First, we look at rendered page content. Rendered is the content of the page after the browser has executed all JavaScript and any other code that modifies the DOM or CSSOM.
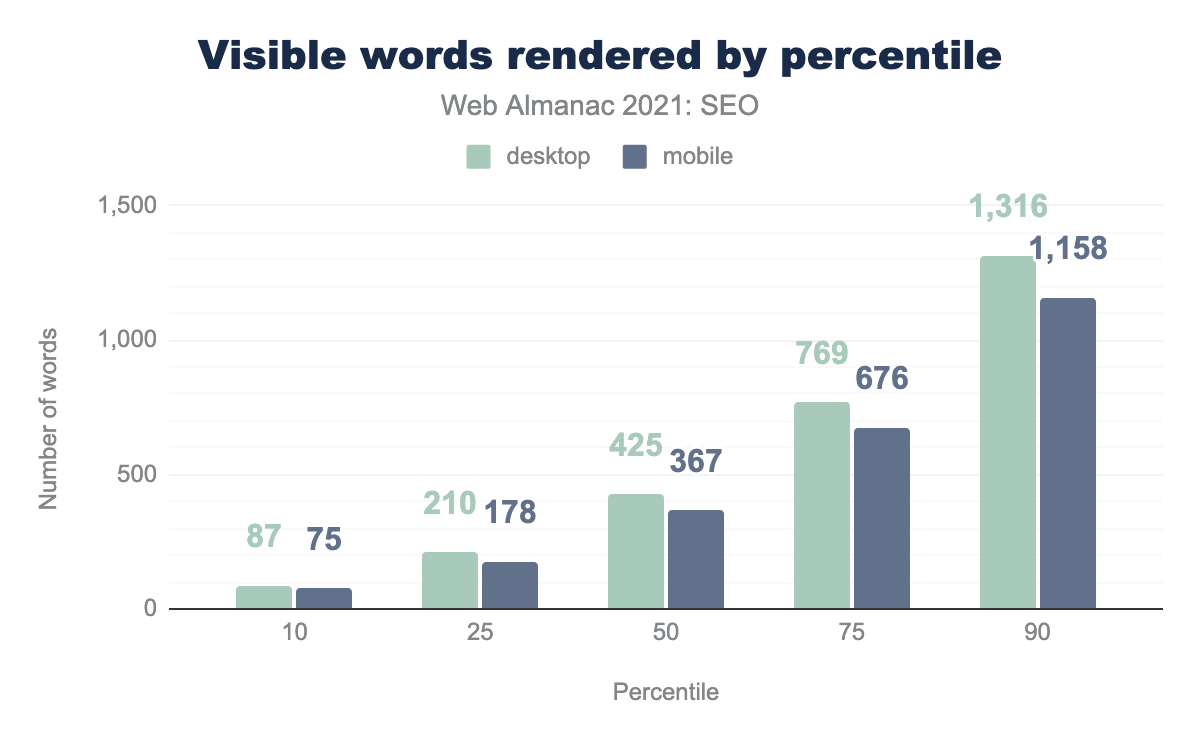
- The median rendered desktop page contains 425 words, versus 402 words in 2020.
- The median rendered mobile page contains 367 words, versus 348 words in 2020.
- Rendered mobile pages contain 13.6% fewer words than rendered desktop pages. Note that Google is a mobile-only index. Content not on the mobile version may not get indexed.
Raw word count
Next, we look at the raw page content Raw is the content of the page before the browser has executed JavaScript or any other code that modified the DOM or CSSOM. It’s the “raw” content delivered and visible in the source code.
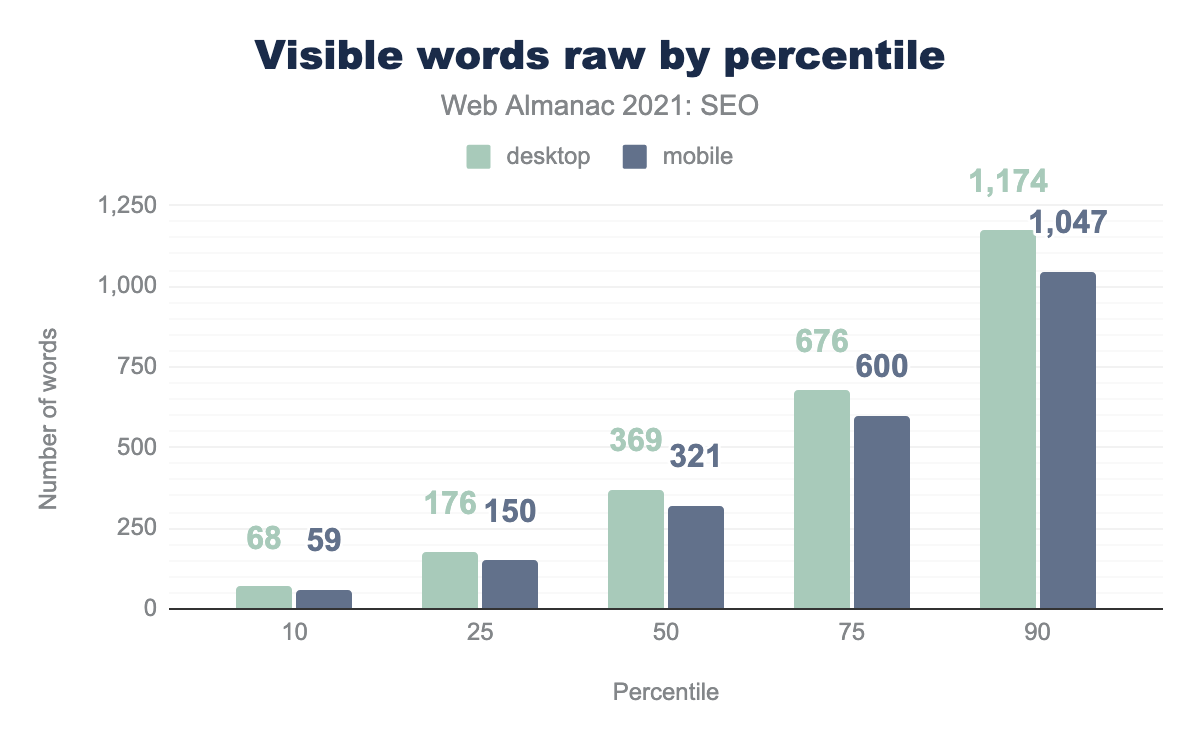
- The median raw desktop page contains 369 words, versus 360 words in 2020.
- The median raw mobile page contains 321 words, versus 312 words in 2020.
- Raw mobile pages contain 13.1% fewer words than raw desktop pages. Note that Google is a mobile-only index. Content not on the mobile HTML version may not get indexed.
Overall, 15% of written content on desktop devices is generated by JavaScript and 14.3% on mobile versions.
Structured Data
Historically, search engines have worked with unstructured data: the piles of words, paragraphs and other content that comprise the text on a page.
Schema markup and other types of structured data provide search engines another way to parse and organize content. Structured data powers many of Google’s search features.
Like words on the page, structured data can be modified with JavaScript.
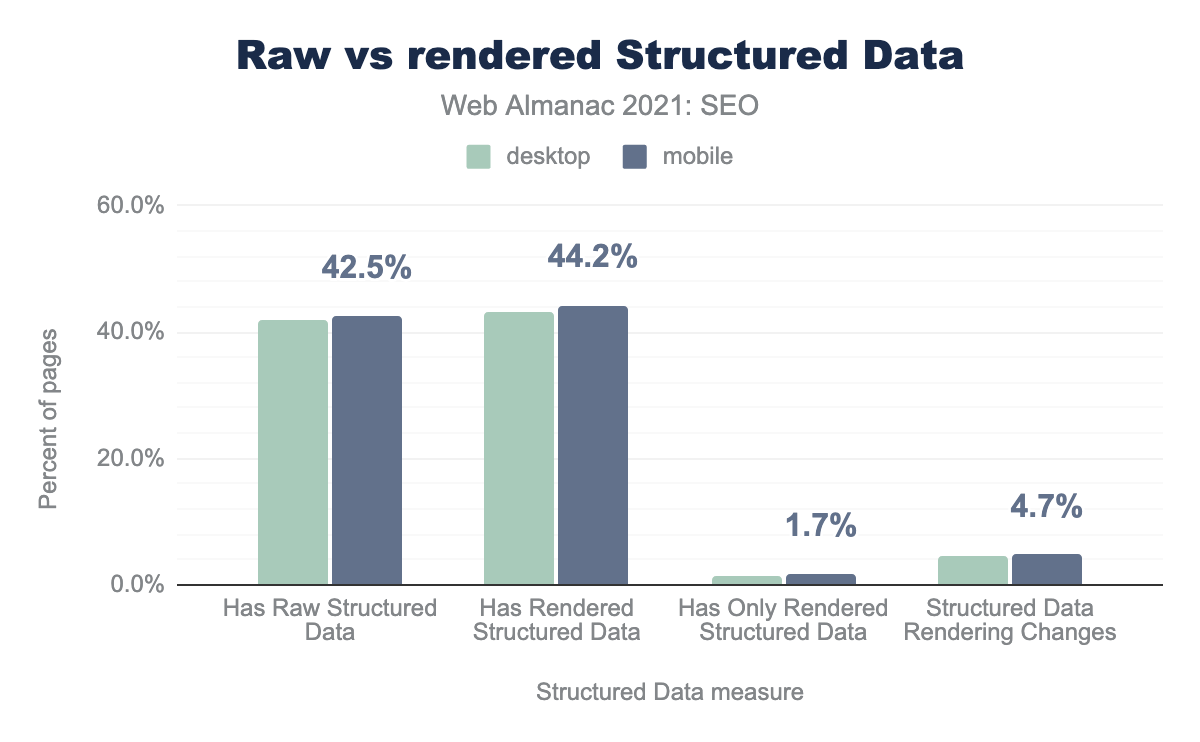
42.5% of mobile pages and 41.8% of desktop pages have structured data in the HTML. JavaScript modifies the structured data on 4.7% of mobile pages and 4.5% of desktop pages.
On 1.7% of mobile pages and 1.4% of desktop pages structured data is added by JavaScript where it didn’t exist in the initial HTML response.
Most popular structured data formats
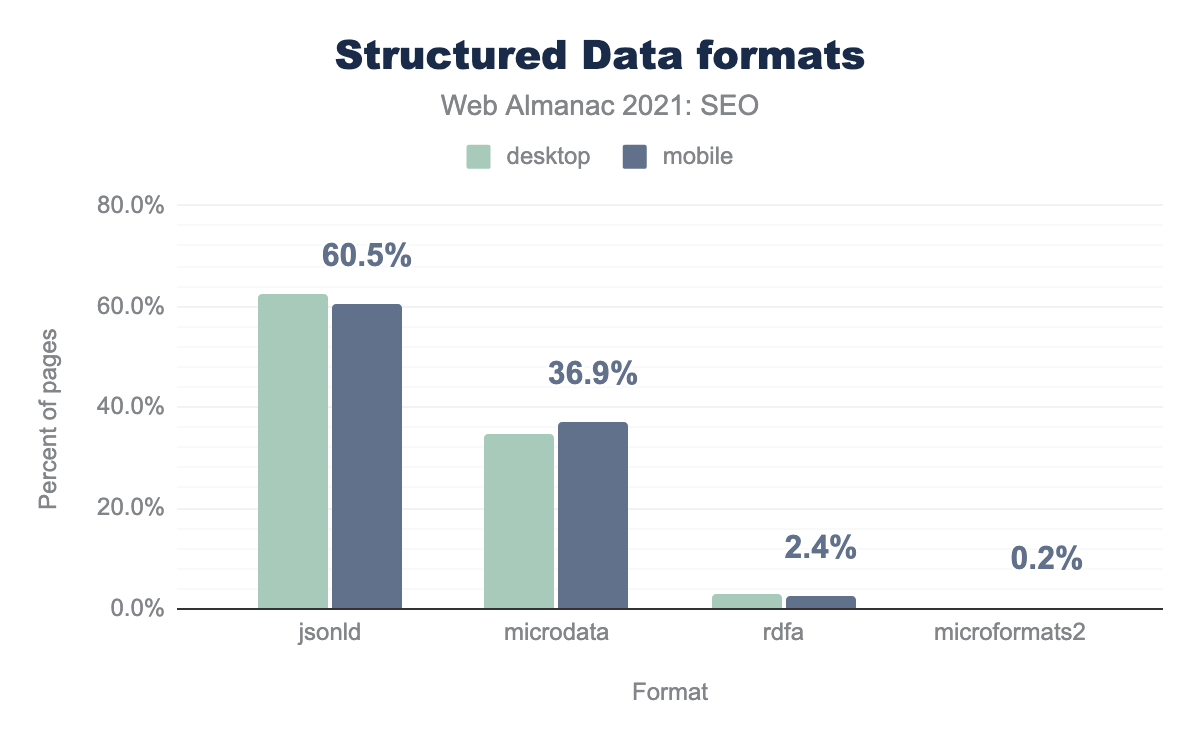
There are several ways to include structured data on a page: JSON-LD, microdata, RDFa, and microformats2. JSON-LD is the most popular implementation method. Over 60% of desktop and mobile pages that have structured data implement it with JSON-LD.
Among websites implementing structured data, over 36% of desktop and mobile pages use microdata and less than 3% of pages use RDFa or microformats2.
Structured data adoption is up a bit since last year. It’s used on 33.2% of pages in 2021 vs 30.6% in 2020.
Most popular schema types
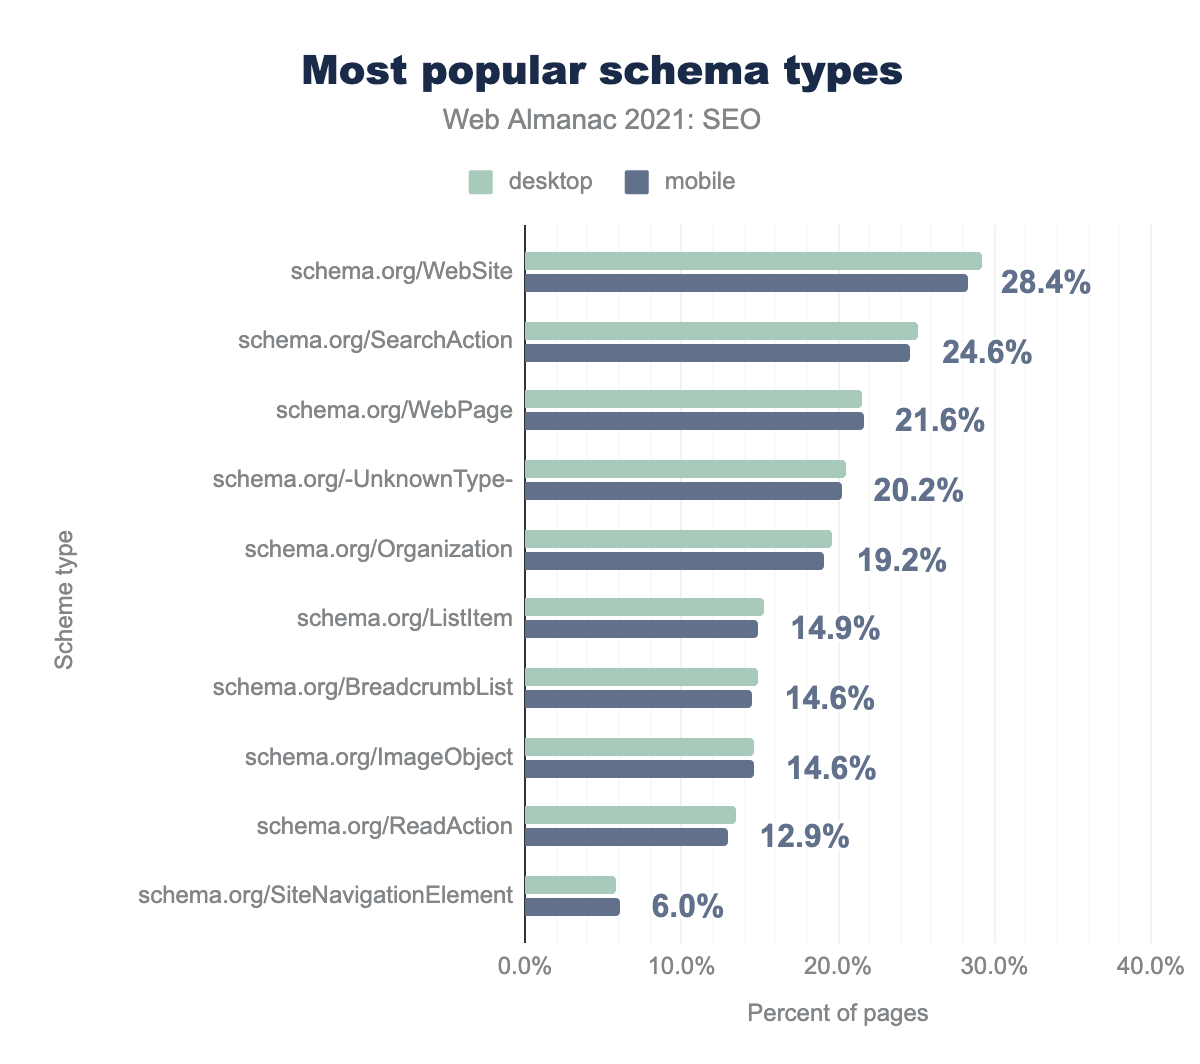
The most popular schema types found on home pages are WebSite, SearchAction, WebPage. SearchAction is what powers the Sitelinks Search Box, which Google can choose to show in the Search Results Page.
<h> elements (headings)
Heading elements (<h1>, <h2>, etc.) are an important structural element. While they don’t directly impact rankings, they do help Google to better understand the content on the page.
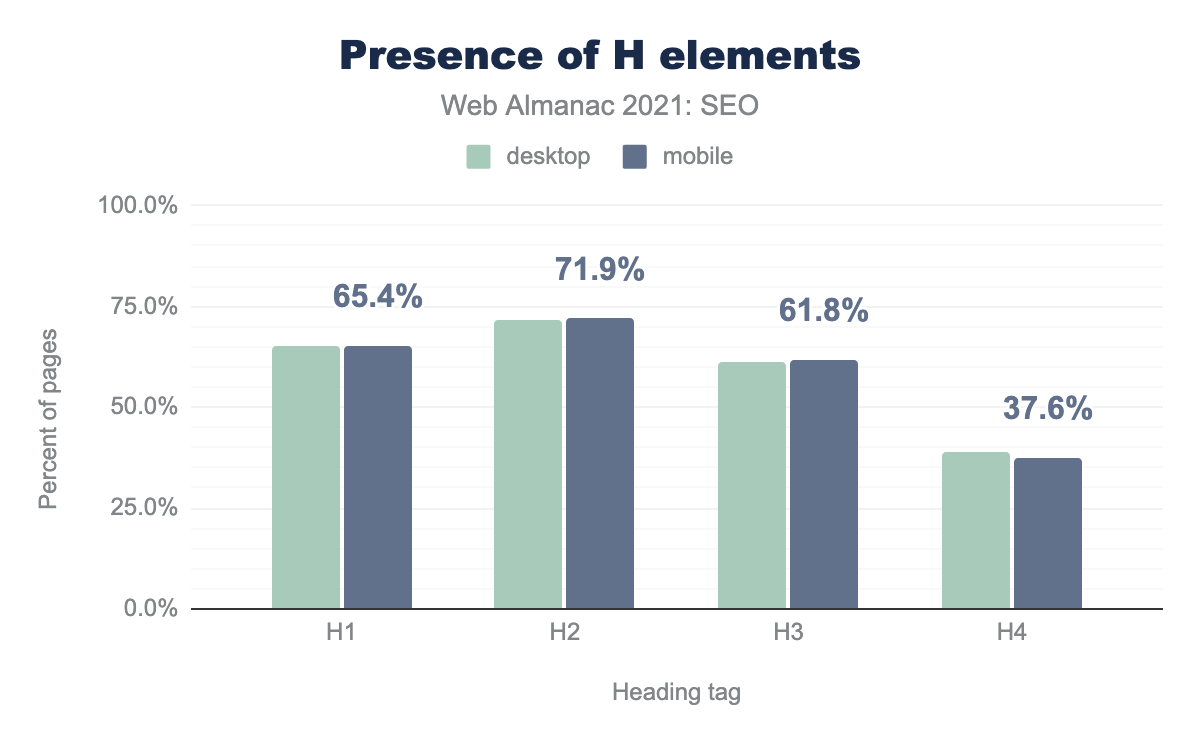
h1 headings were found on 65.4% of pages, h2s were found the most frequently on 71.9% of pages, h3s were found on 61.8% of pages and h4 headings were found on 37.6% of pages.For main headings, more pages (71.9%) have h2s than have h1s (65.4%). There’s no obvious explanation for the discrepancy. 61.4% of desktop and mobile pages use h3s and less than 39% use h4s.
There was very little difference between desktop and mobile heading usage, nor was there a major change versus 2020.

<h> elements by heading tag (level 1, 2, 3, 4). There was little to no difference between desktop and mobile results. h1 headings were found on 58.1% of pages, h2s were found the most frequently on 70.5% of pages, h3s on 60.3% of pages and h4 headings were found on 36.5% of pages.However, a lower percentage of pages include non-empty<h> elements, particularly h1. Websites often wrap logo-images in <h1> elements on home pages, and this may explain the discrepancy.
Links
Search engines use links to discover new pages and to pass PageRank which helps determine the importance of pages.
On top of PageRank, the text used as a link anchor helps search engines to understand what a linked page is about. Lighthouse has a test to check if the anchor text used is useful text or if it’s generic anchor text like “learn more” or “click here” which aren’t very descriptive. 16% of the tested links did not have descriptive anchor text, which is a missed opportunity from an SEO perspective and also bad for accessibility.
Internal and external links
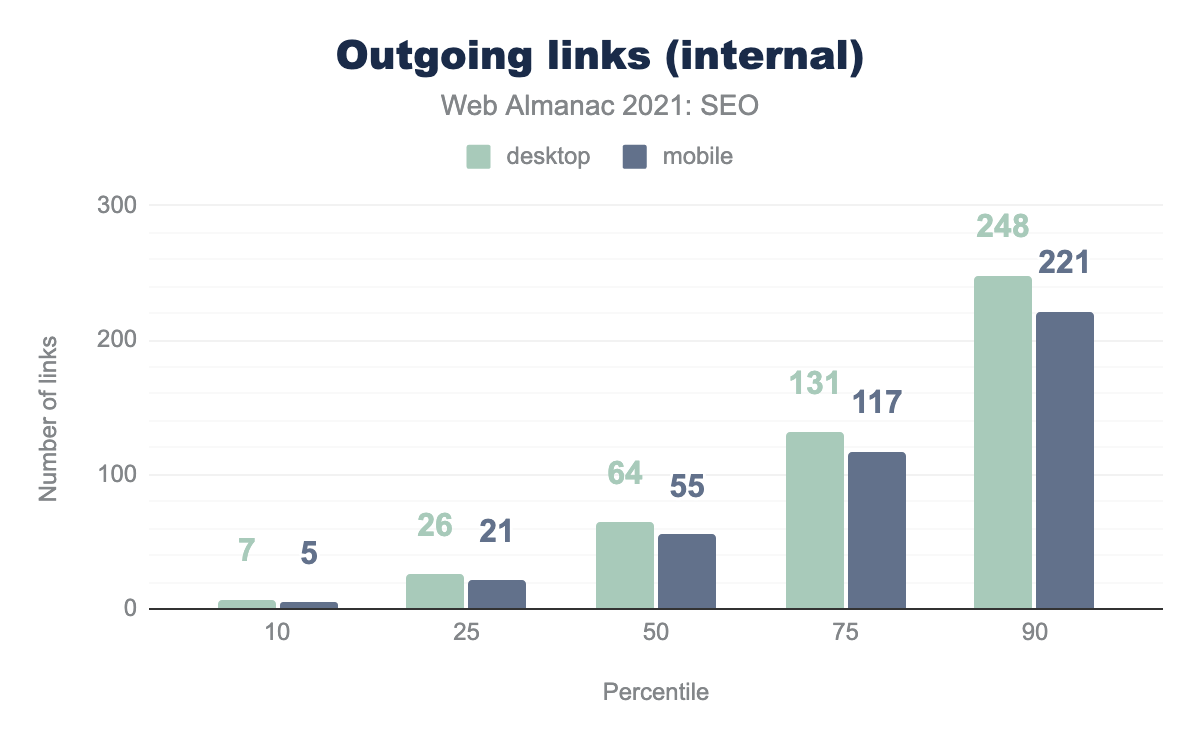
Internal links are links to other pages on the same site. Pages had less links on the mobile versions compared to the desktop versions.
The data shows that the median number of internal links on desktop is 16% higher than mobile, 64 vs 55 respectively. It’s likely this is because developers tend to minimize the navigation menus and footers on mobile to make them easier to use on smaller screens.
The most popular websites (the top 1,000 according to CrUX data) have more outgoing internal links than less popular websites. 144 on desktop vs. 110 on mobile, over two times higher than the median! This may be because of the use of mega-menus on larger sites that generally have more pages.
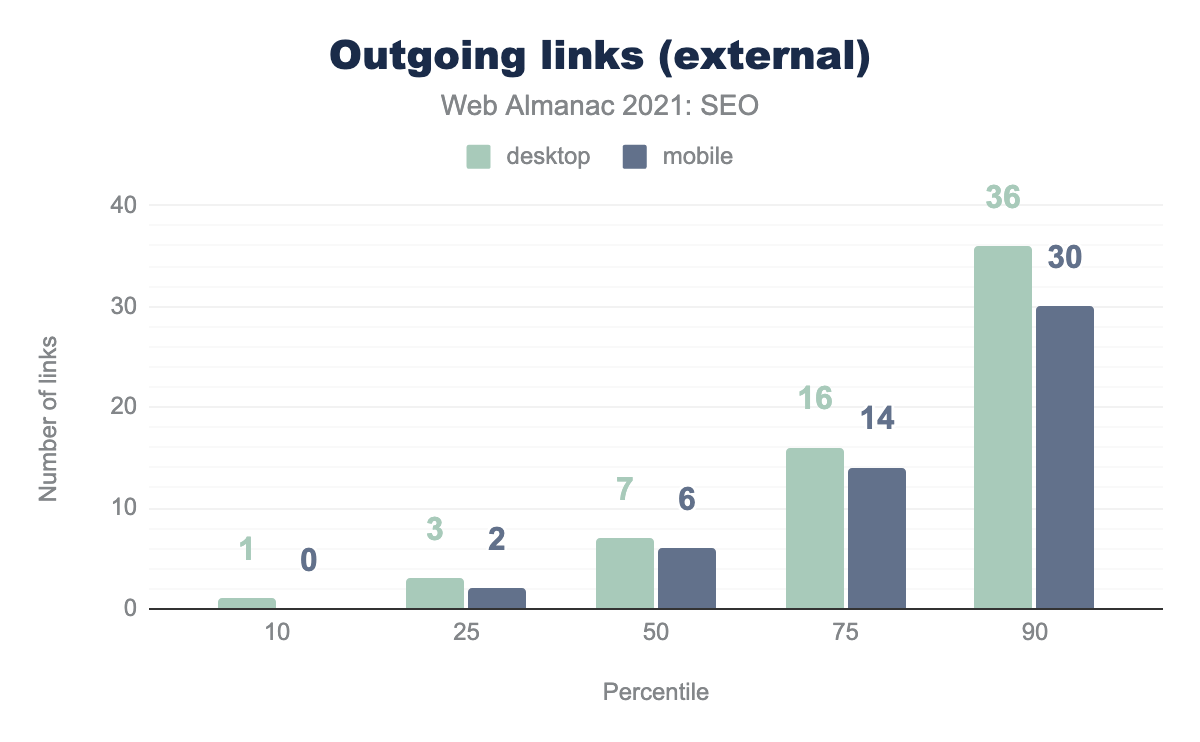
External links are links from one website to a different site. The data again shows fewer external links on the mobile versions of the pages.
The numbers are nearly identical to 2020. Despite Google rolling out mobile first indexing this year, websites have not brought their mobile versions to parity with their desktop versions.
Text and image links

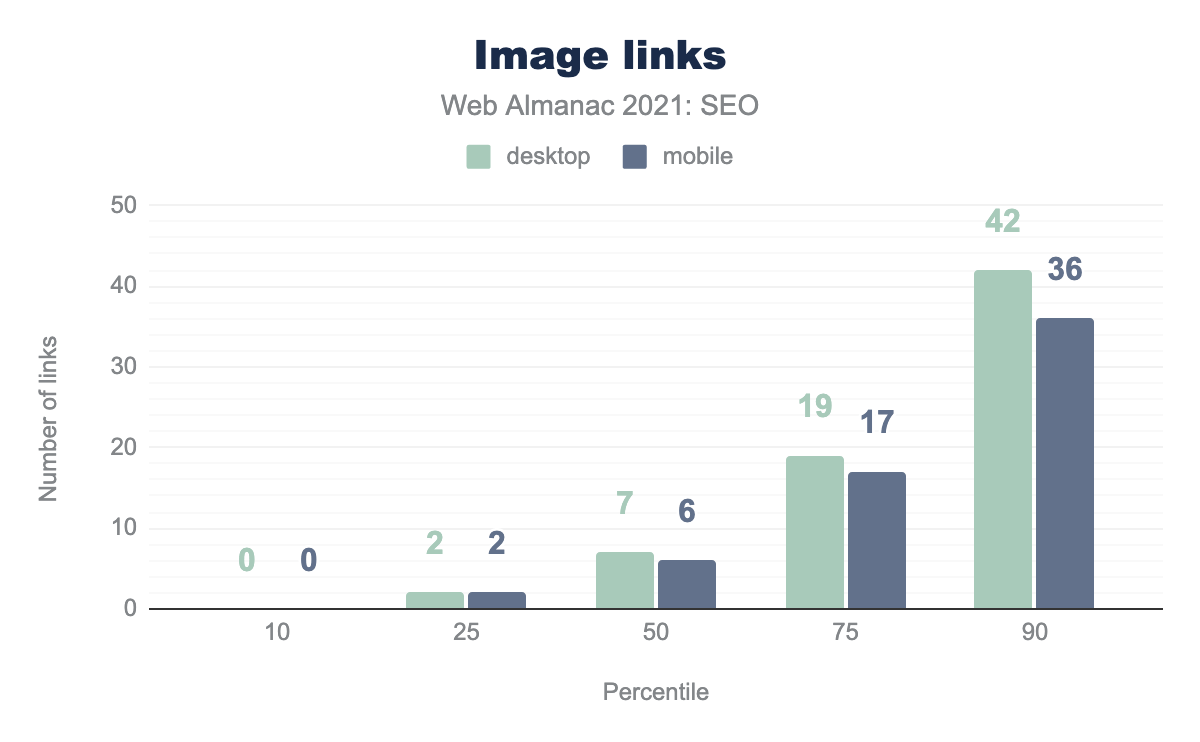
While a significant portion of links on the web are text based, a portion also link images to other pages. 9.2% of links on desktop pages and 8.7% of links on mobile pages are image links. With image links, the alt attributes set for the image act as anchor text to provide additional context on what the pages are about.
Link attributes
In September of 2019, Google introduced attributes that allow publishers to classify links as being sponsored or user-generated content. These attributes are in addition to rel=nofollow which was previously introduced in 2005. The new attributes, rel=ugc and rel=sponsored, add additional information to the links.
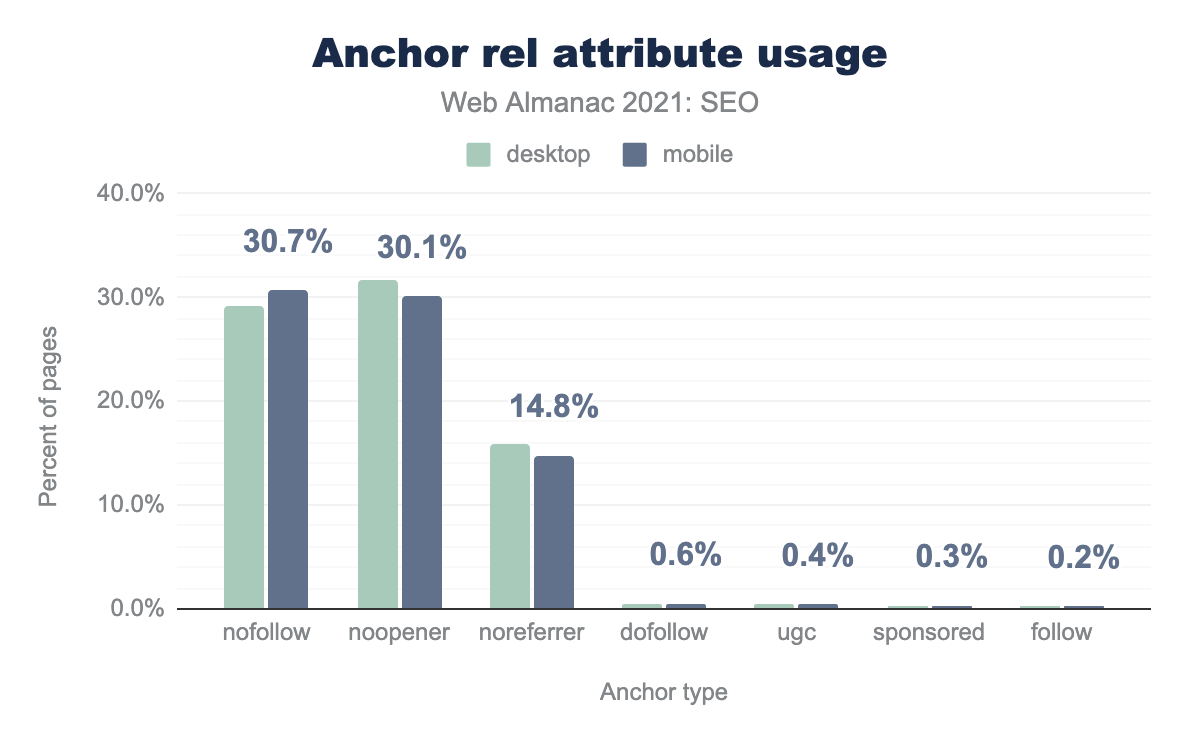
rel="noopener" was featured on 31.6% of desktop pages and 30.1% on mobile. rel="noreferrer" was featured on 15.8% of desktop pages and 14.8% of mobile. rel="dofollow", rel="ugc", rel="sponsored", and rel="follow" were all featured on fewer than 1% of desktop and mobile pages.The new attributes are still fairly rare, at least on home pages, with rel="ugc" appearing on 0.4% of mobile pages and rel="sponsored" appearing on 0.3% of mobile pages. It’s likely these attributes are seeing more adoption on pages that aren’t home pages.
rel="follow" and rel=dofollow appear on more pages than rel="ugc" and rel="sponsored". While this is not a problem, Google ignores rel="follow" and rel="dofollow" because they aren’t official attributes.
rel="nofollow" was found on 30.7% of mobile pages, similar to last year. With the attribute used so much, it’s no surprise that Google has changed nofollow to a hint—which means they can choose whether or not they respect it.
Accelerated Mobile Pages (AMP)
2021 saw major changes in the Accelerated Mobile Pages (AMP) ecosystem. AMP is no longer required for the Top Pages carousel, no longer required for the Google News app, and Google will no longer show the AMP logo next to AMP results in the SERP.
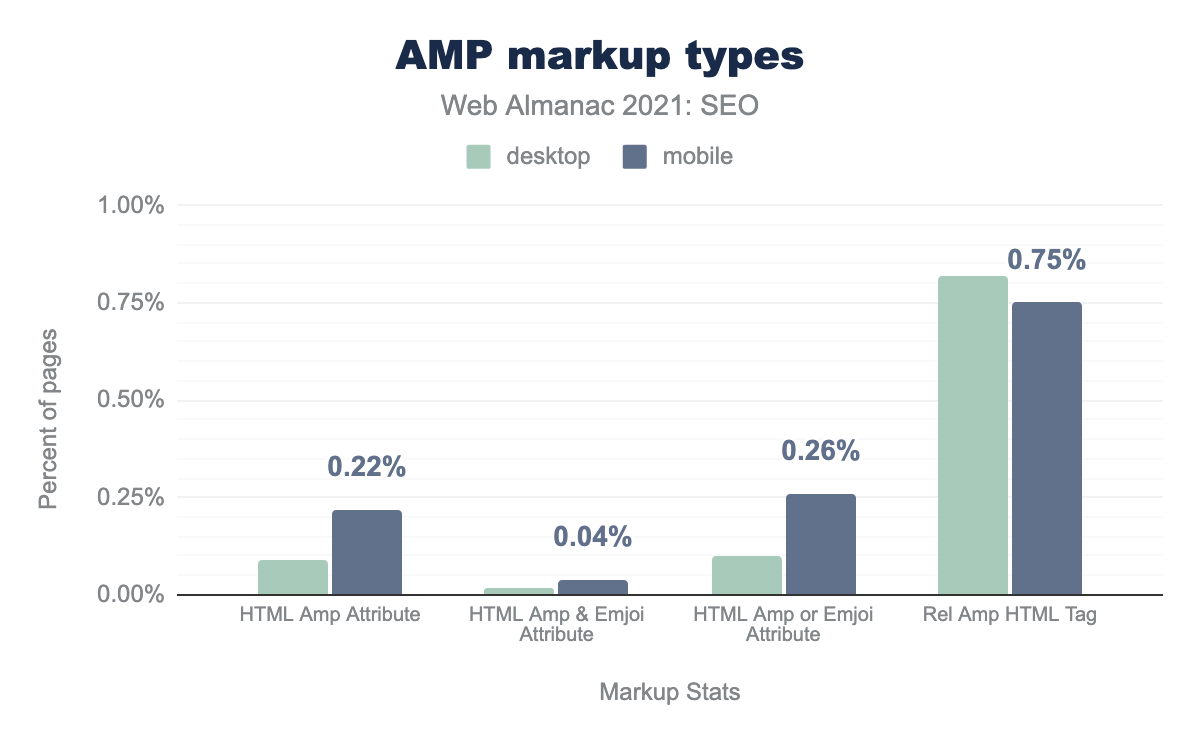
However, AMP adoption continued to increase in 2021. 0.09% of desktop pages now include the AMP attribute vs 0.22% for mobile pages. This is up from 0.06% on desktop pages and 0.15% on mobile pages in 2020.
Internationalization
If you have multiple versions of a page for different languages or regions, tell Google about these different variations. Doing so will help Google Search point users to the most appropriate version of your page by language or region.
To let search engines know about localized versions of your pages, use hreflang tags. hreflang attributes are also used by Yandex and Bing (to some extent).
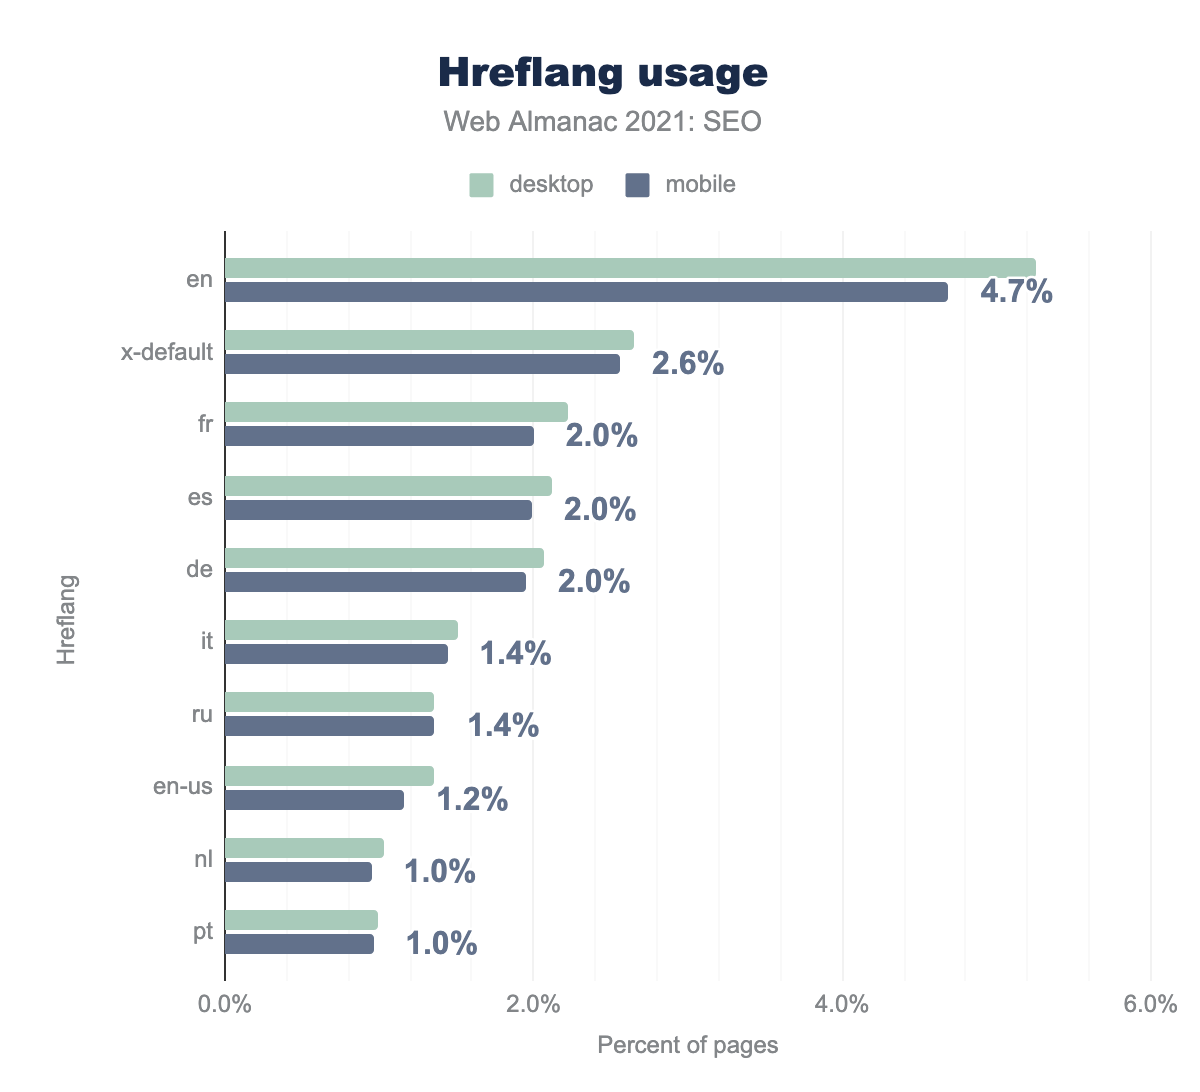
en (English version) and hreflang attributes (across all languages) were implemented on less than 5% of desktop and mobile pages.9.0% of desktop pages and 8.4% of mobile pages use the hreflang attribute.
There are three ways of implementing hreflang information: in HTML <head> elements, Link headers, and with XML sitemaps. This data does not include data for XML sitemaps.
The most popular hreflang attribute is "en" (English version). 4.75% of mobile home pages use it and 5.32% of desktop home pages.
x-default (also called the fallback version) is used in 2.56% of cases on mobile. Other popular languages addressed by hreflang attributes are French and Spanish.
For Bing, hreflang is a “far weaker signal” than the content-language header.
As with many other SEO parameters, content-language has multiple implementation methods including:
- HTTP server response
- HTML tag
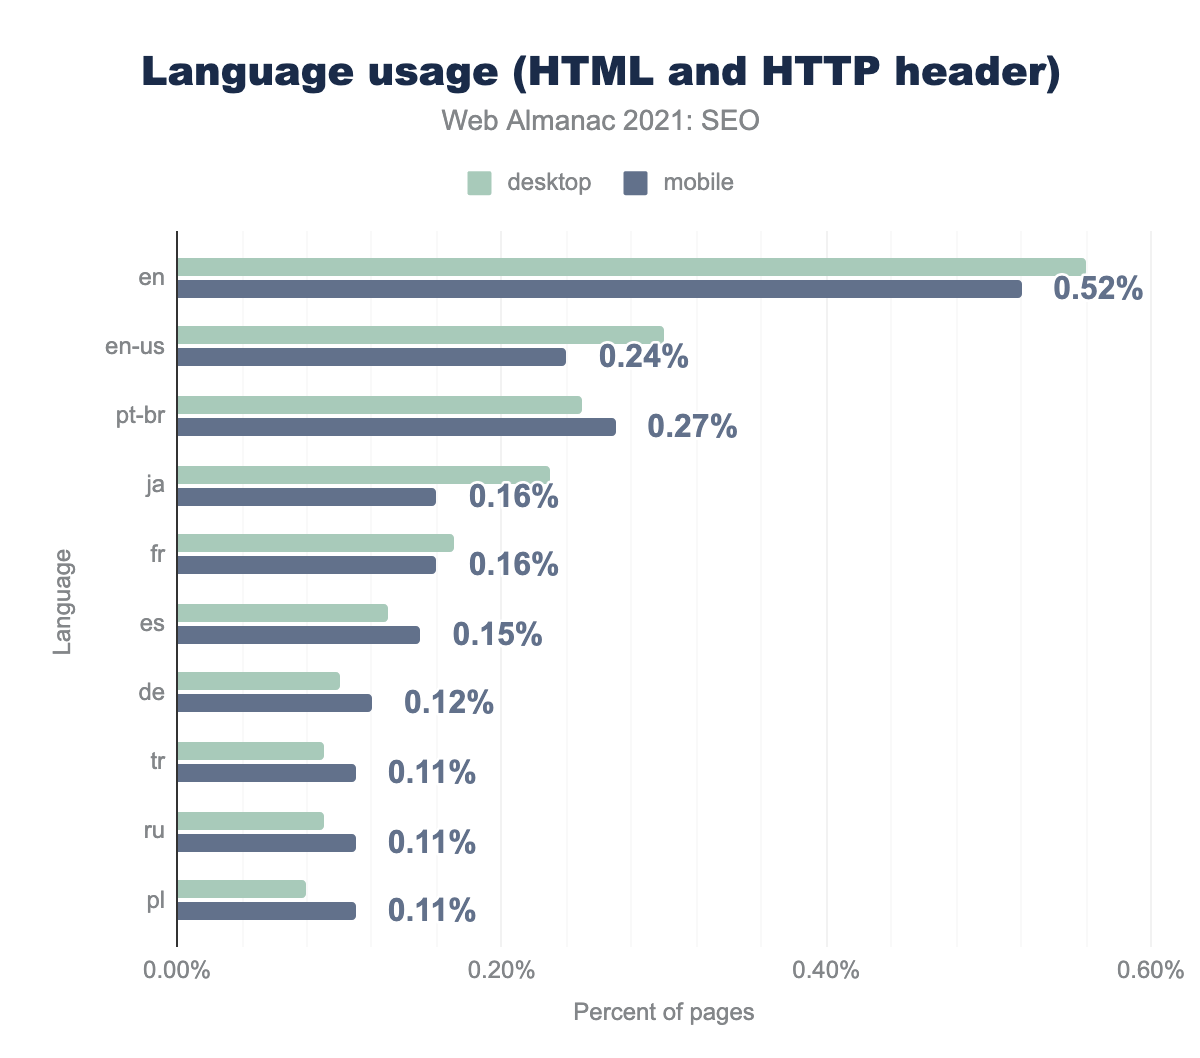
Using an HTTP server response is the most popular way of implementing content-language. 8.7% of websites use it on desktop while 9.3% on mobile.
Using the HTML tag is less popular, with content-language appearing on just 3.3% of mobile websites.
Conclusion
Websites are slowly improving from an SEO perspective. Likely due to a combination of websites improving their SEO and the platforms hosting websites also improving. The web is a big and messy place so there’s still a lot to do, but it’s nice to see consistent progress.


