Jamstack

Introduction
Jamstack has revolutionized the way we think about building for the web by providing a simpler developer experience, better performance, lower cost and greater scalability.
Jamstack stands on JavaScript, API, and Markup architecture. These 3 foundations are decoupled, and the Jamstack site can be built purely using markup. Using pure HTML is “kinda” Jamstack, but it’s really hard to scale. Lucky for us, there’s a huge ecosystem of Static Site Generators (SSGs).
JavaScript based SSGs:
- Next.js
- Gatsby
- Nuxt.js
- etc
Traditional:
- Eleventy
- Hugo
- Jekyll
- Hexo
- etc
And there are many more SSGs beyond these. They allow building sites converted to “pure” HTML and JavaScript goodness if needed.
For more complex sites, data has to be structured. There are several ways to store and manage data using headless CMSs via APIs.
Moreover, Jamstack sites need support for server interactions such as form submissions or user input processing. Services like Netlify provide serverless functions support to address this need.
The goal of this chapter is to identify what are the main SSGs used on Jamstack and look at the adoption of Jamstack technology year over year. We looked at how they are distributed around the world, the level of performance of Jamstack sites, and how it is growing. We also explored data of different CDN providers for Jamstack sites. Additionally we dived into results of resources used for Jamstack sites and their impact on user experience.
It’s worth mentioning some data disclaimers to consider when reading this chapter:
- HTTP Archive data of detected SSGs is based on Wappalyzer technology, which has some limitations. It can’t detect whether the site was built with certain SSGs such as Eleventy. Also, it can’t detect if the site was generated by Next.js Static Rendering or Server Side Rendering.
- In our analysis, we can’t get any info related to headless CMSs, hence we will not cover this either.
- We visualize SSG data using top 5 used SSGs based on number of sites built with these SSGs.
More information can be found in the methodology selection.
Adoption of SSGs
SSG adoption is growing in general by 2x in year over year. In 2019 it was just 0.4% mobile and 0.3% desktop sites. In 2020 the number almost doubled, to 0.6% on mobile and 0.7% on desktop sites. In 2021 they have grown again: 1.1% of mobile and 0.9% of desktop sites. That underlines the trend of that technology. For example, this year Vercel raised a $102M in series C round and a further $150M in round D of investment to build a better web with modern technologies like Next.js. Jamstack oriented CDN provider Netlify raised $105M in their series D of investment. Hence, it’s expected that numbers of Jamstack adoption will grow even higher next year.
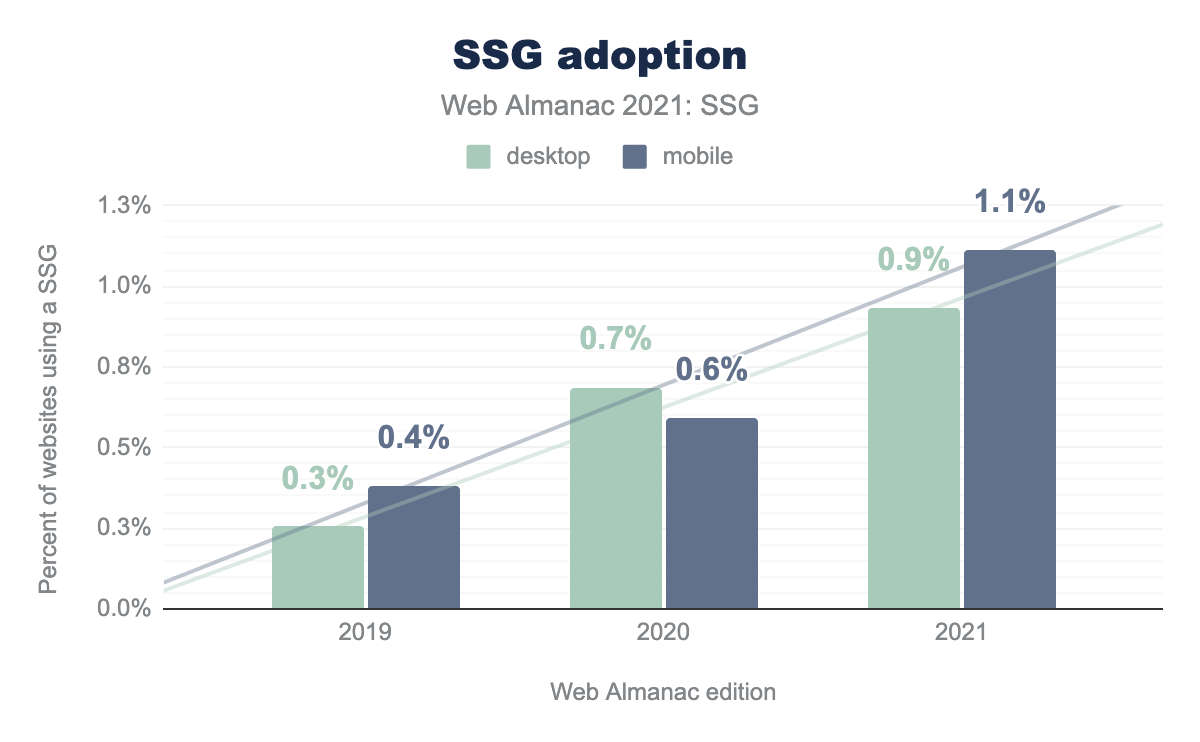
In 2020 the amount of desktop websites increased 2.76 times, while mobile just 1.5 times. In 2021 mobile availability for SSGs built sites became way better than in 2020, and this year there are ~1.9 times more sites than 2020.
Which SSGs are the most popular
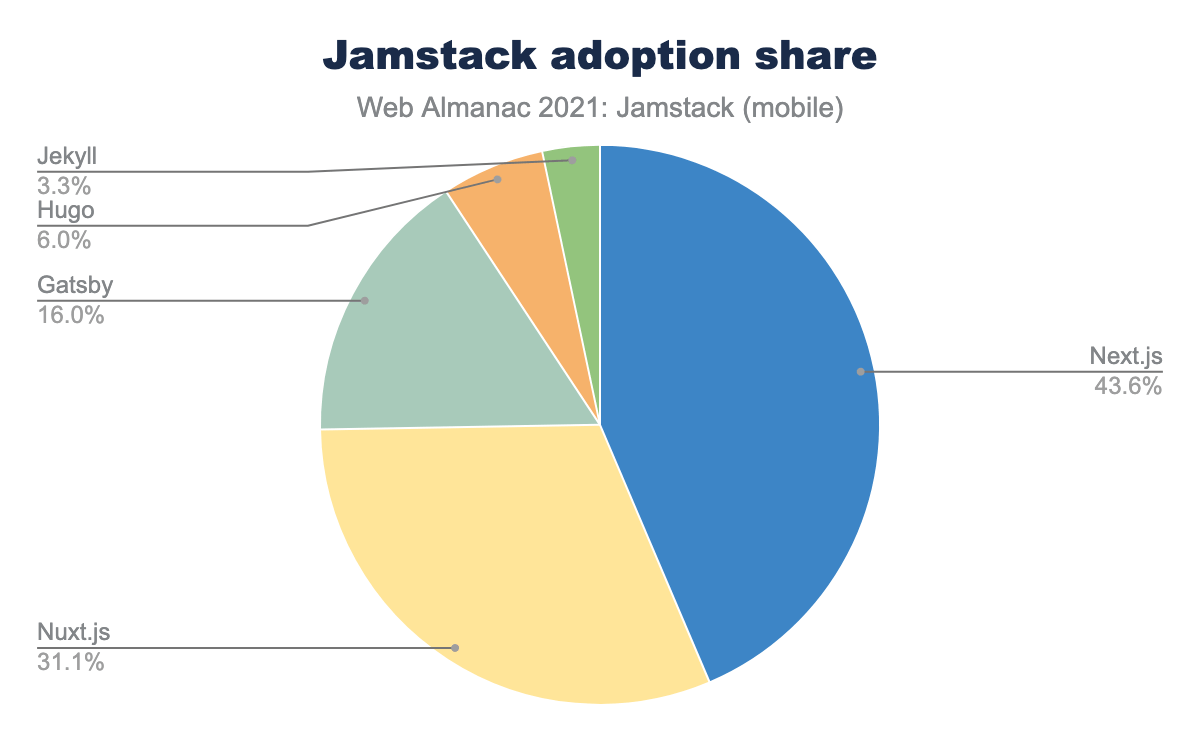
Let’s begin with understanding which SSG is most popular. Next.js covers 43.6% of Jamstack sites. Nuxt.js is in second place with 31.1%, third is Gatsby with 16.0%, followed by Hugo at 6.0%.
All top 3 SSGs are JavaScript based: Next.js and Gatsby use React.js at it’s core and supplements this by adding their own functionality on top of it. Nuxt.js is based on Vue.js. Having these popular front-end frameworks with huge ecosystems out of the box makes development way easier. Node.js allows JavaScript to run on the server as well as the browser where it has traditionally been used, enabling developers stick to one language. That makes adopting these SSGs easier from a server perspective, comparing to Hugo which is based on the Go programming language, and Jekyll based on Ruby.
We will take a look what’s the adoption rate of SSGs among web sites.
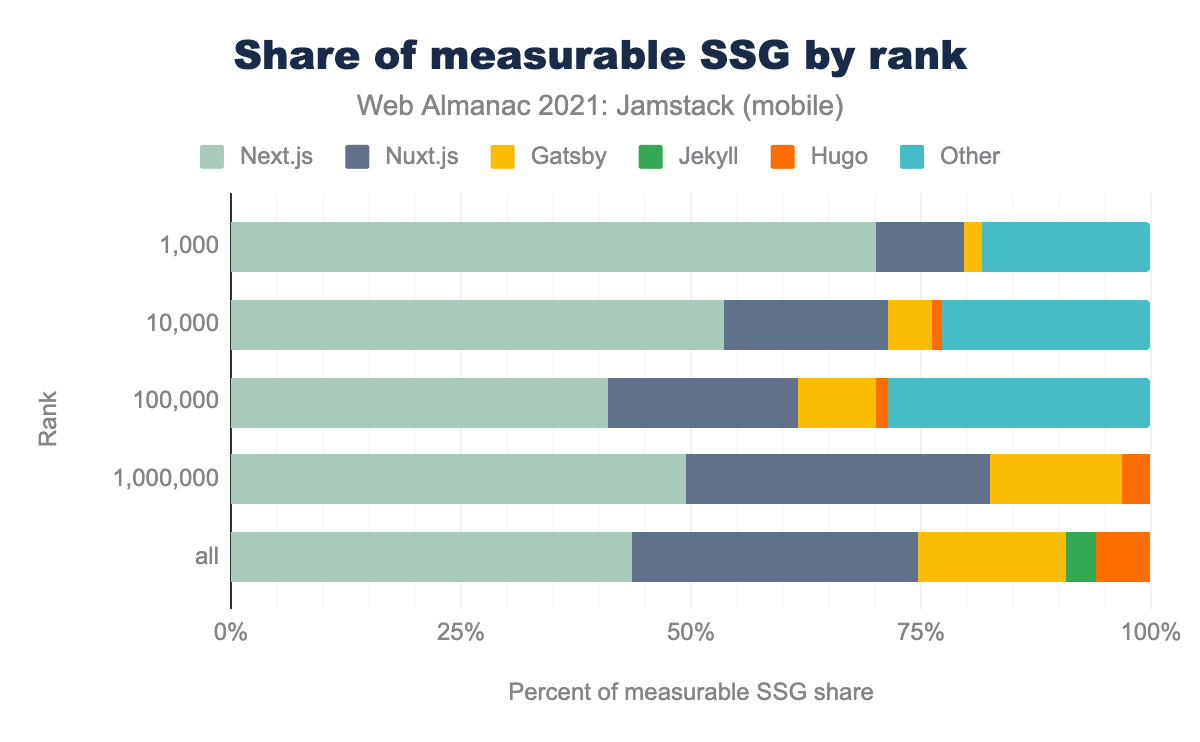
Adoption by rank
Next.js remains a popular SSG across all ranks, but for the top 10k in particular.
Geographic adoption
In this section we will cover geographic adoption for Jamstack and explore distribution over countries and regions.
Adoption by country
SSGs are heavily used around the world. The figure belows shows the top 10 countries with the highest number of sites.
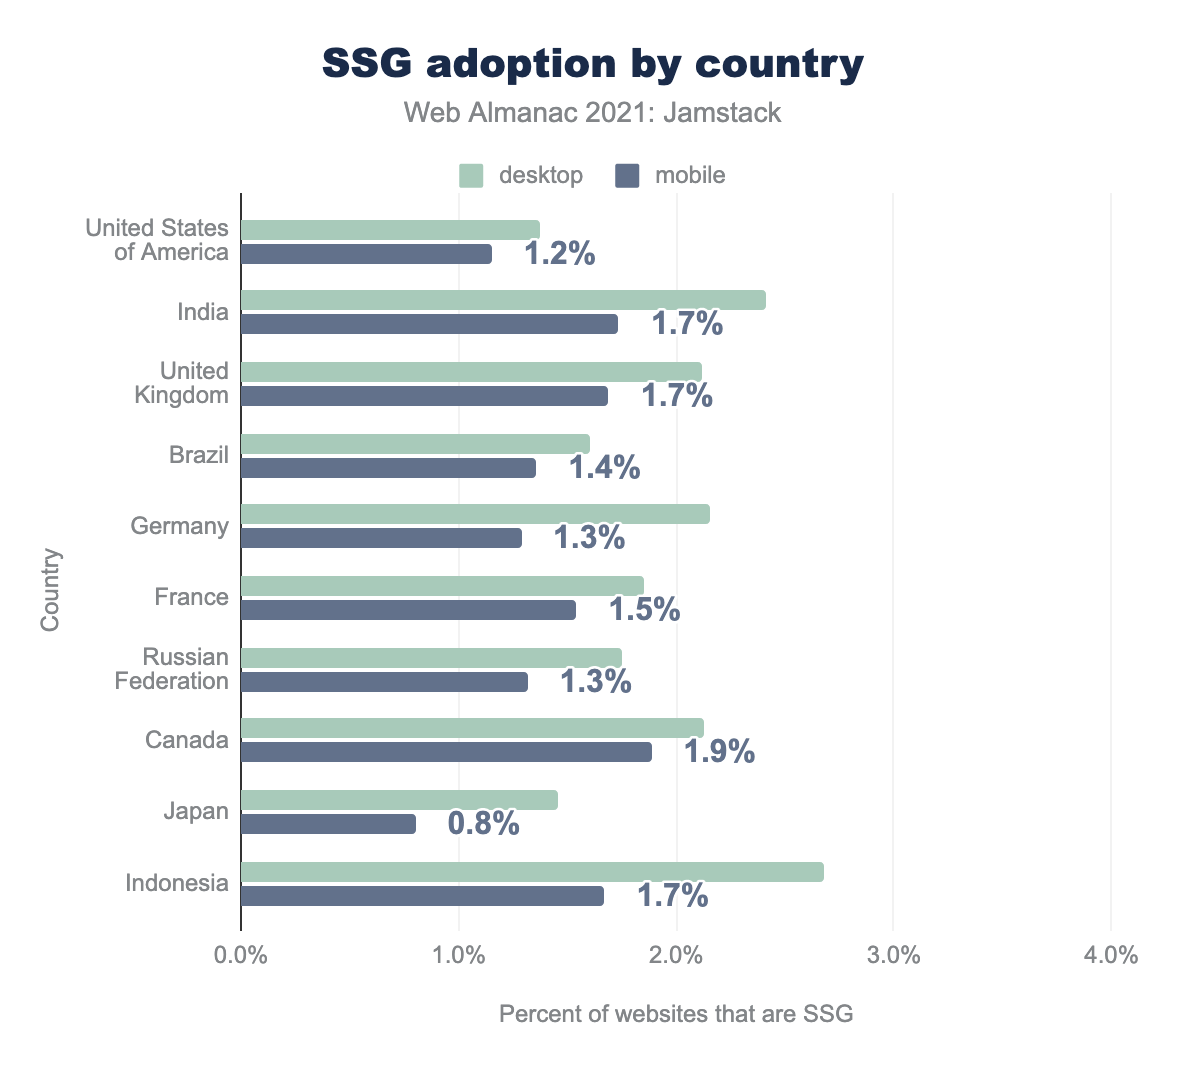
In the USA, between 1.2 and 1.4%% of all sites pages (which is about 22k pages for desktop and 16k for mobile), are created with SSG. India has a lower number of pages, with just 6k for desktop and 7k for mobile, but 1.7% of all pages is covered by Jamstack technologies. In third place is the United Kingdom, which also has 1.7% of pages.
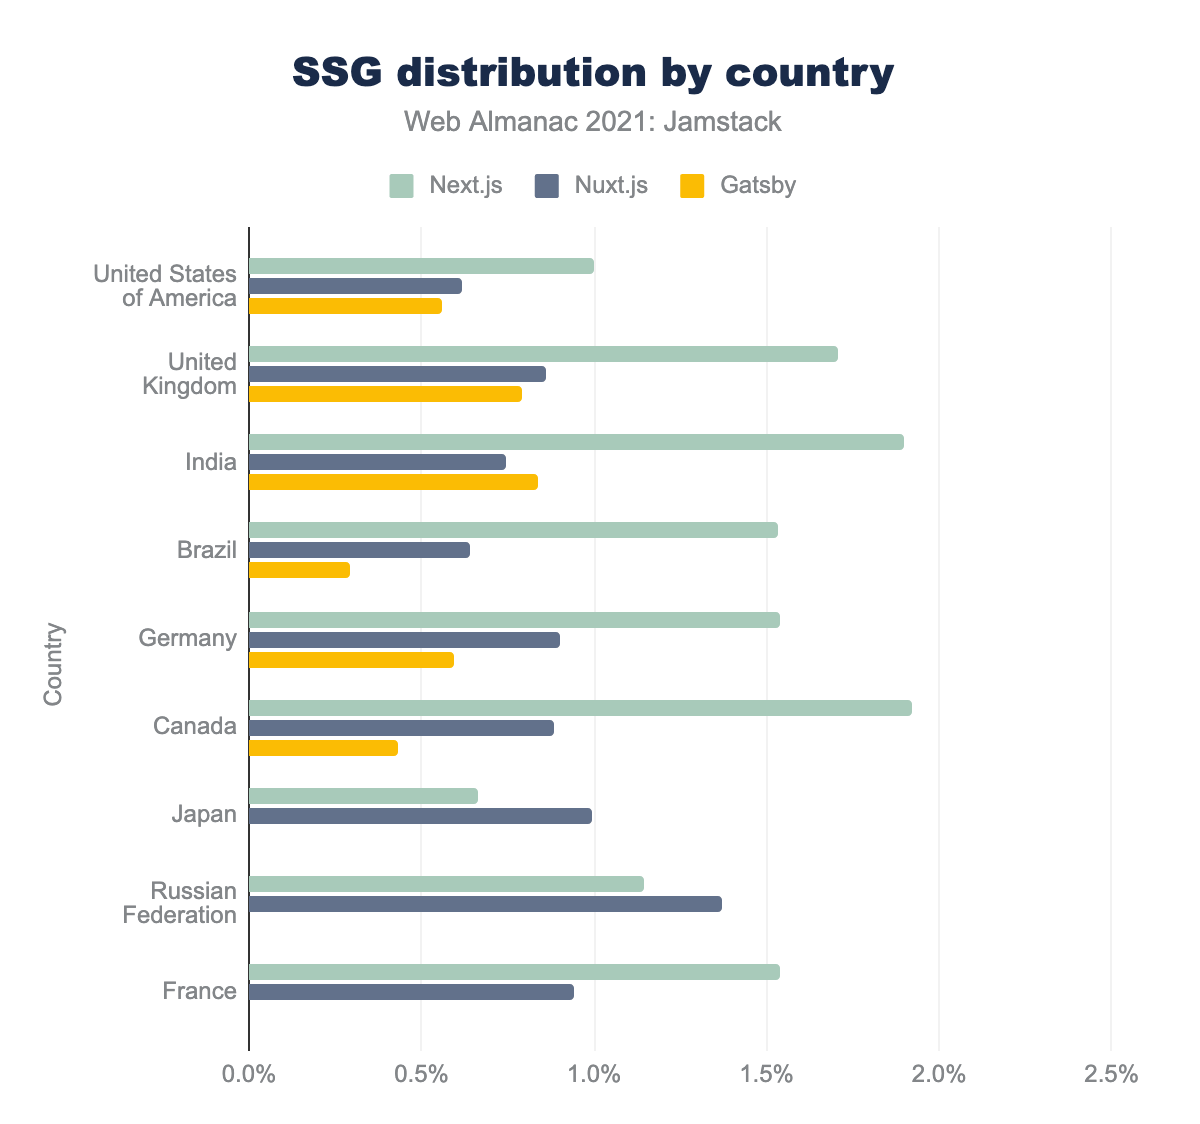
USA has a larger Next.js adoption compared to Nuxt.js and Gatsby. It trends similarly in almost all countries. In most countries, Next.js is a preferable choice. Interestingly Gatsby has no data for 3 of the top 10 countries using Jamstack technologies, but in 2 of them Japan and Russian Federation Nuxt.js is more preferable.
Adoption by region
We also looked at the adoption levels by regions.
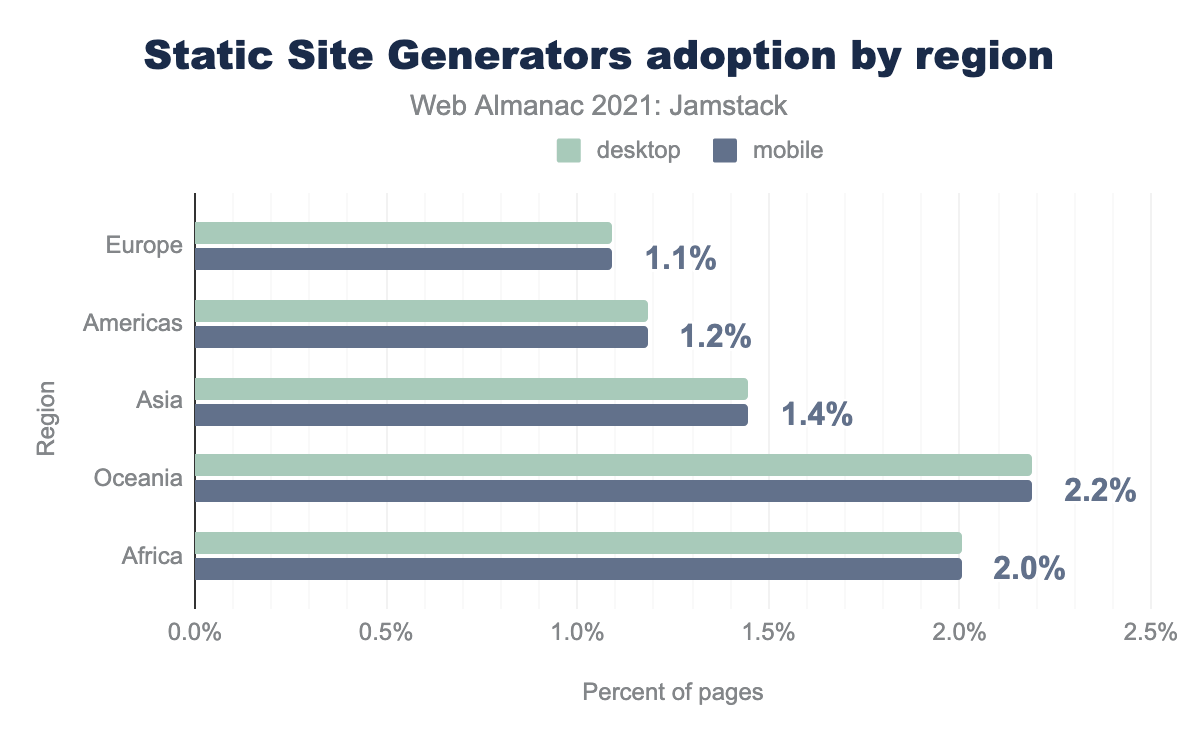
The number of sites in Europe for desktop is 23k versus mobile 26k, which is 1.1% of all web sites in that region. In the Americas, there are 26k desktop sites and 24k mobiles sites (1.2% of sites). Asia has almost the same numbers with 21k desktop and 22k mobile as the leading region with greater Jamstack adoption at 1.45%. Oceania and Africa have way lower overall numbers, but they have way greater Jamstack adoption. Oceania 2.19% and Africa 2%. Overall site adoption is at 1.1%.
Adoption by subregion
We can further break down by subregions to observe additional trends.
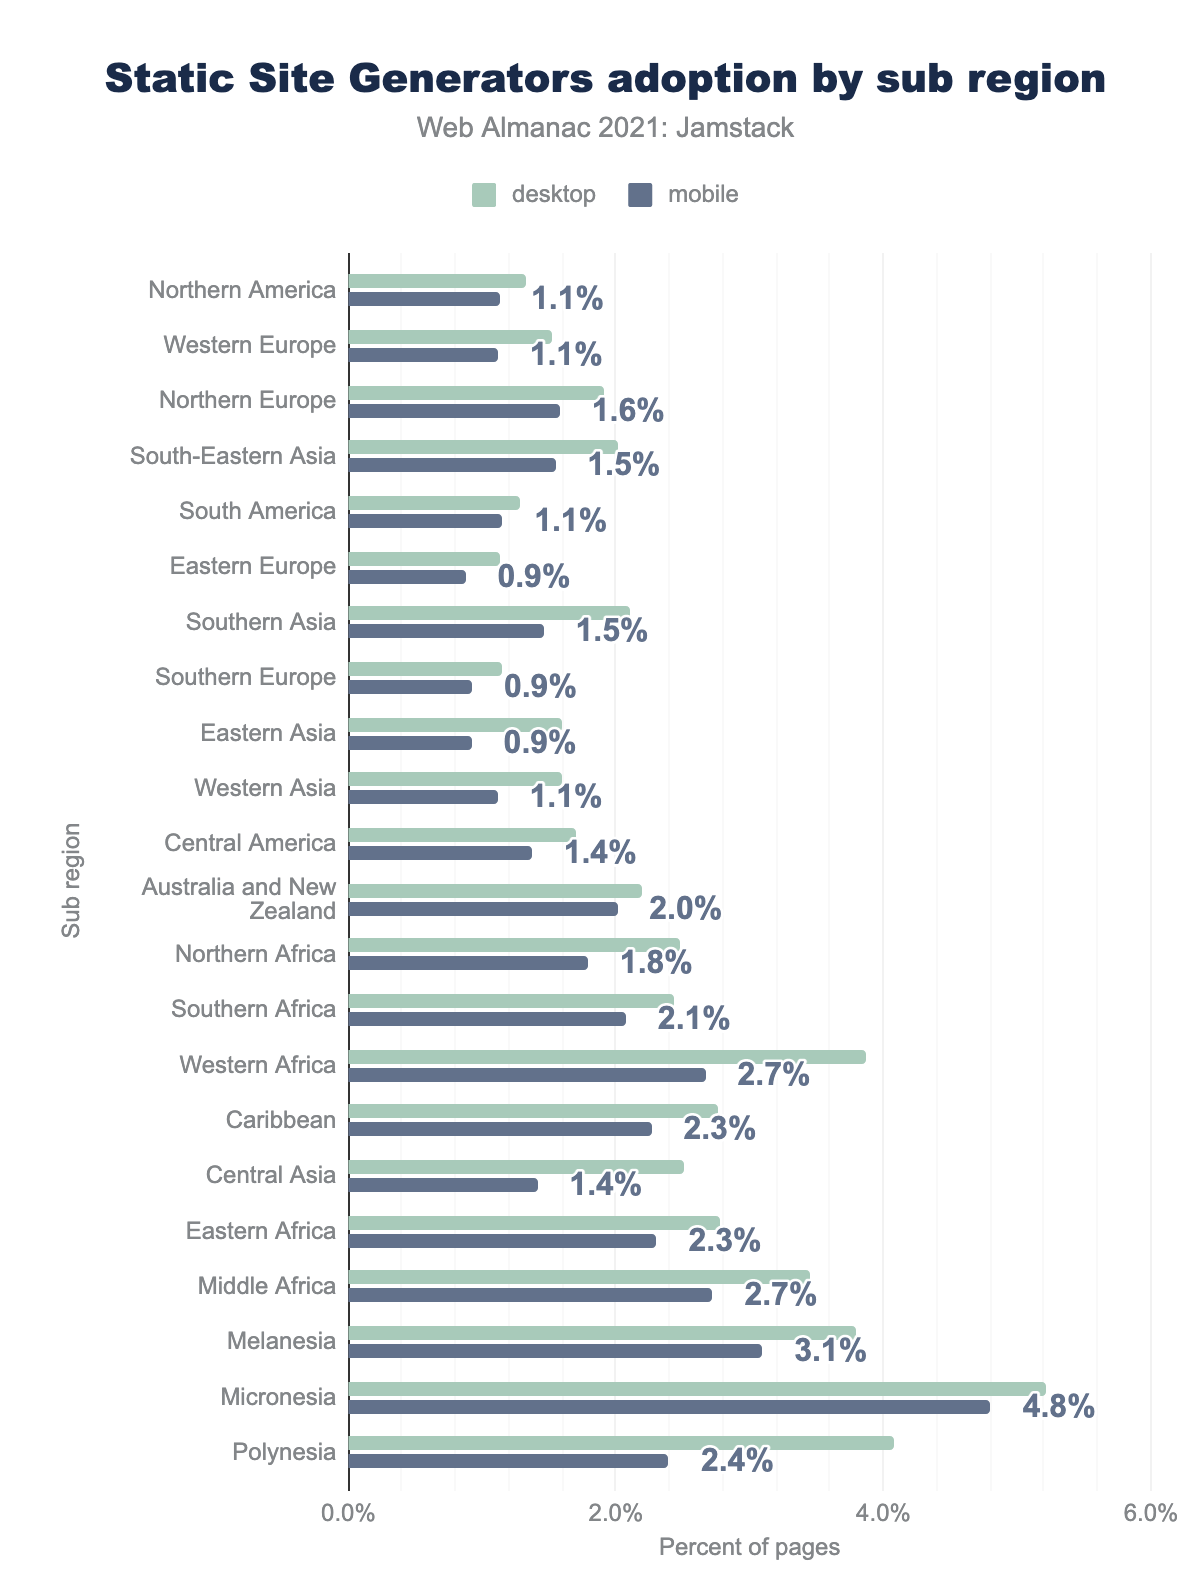
The list is ordered by the total number of SSG sites, but shows those as a percentage of all sites in that region. It’s no surprise that top of the list is Northern America as most companies who invented SSGs are in the USA. However, as a percentage of all sites they are a a lower regions with only 1.1% of sites having adopted Jamstack. But surprisingly, Western Europe is in second place and has a similar low percentage adoption compared to some of the sub regions further down the list.
The tail also shows great results. Subregions with lower number of sites in general adopt technology at a broader based, for example, 4.8% of Micronesia sites.
SSGs distribution among CDN providers
We described how SSGs are adopted in different countries, so let’s analyze which SSG is most popular among different CDN providers.
The 7 most popular CDN providers for SSGs are:
- Netlify
- Vercel
- Cloudflare
- AWS
- Azure
- Akamai
- GitHub
Jamstack CDN services are not just for network delivery. They provide a lot of functionality to allow developers to easy deploy and manage Jamstack sites. For example, Netlify provide easy to use functionality to deploy sites in scope of their service so developers can just update the code and the continuous deployment process is managed for them. Jamstack CDNs provide many other features such as serverless functions, A/B testing etc.
On the other hand, Cloudflare, Akamai, AWS are not only used purely for content deliver either, but can also provide protection service, DNS balancing and more. However, since we can’t detect how exactly Cloudflare, Akamai, and AWS are used, results could be false positives if we look at them as Jamstack enablers. The “Jamstack” part could be handled on origin servers and so not actually on these services.
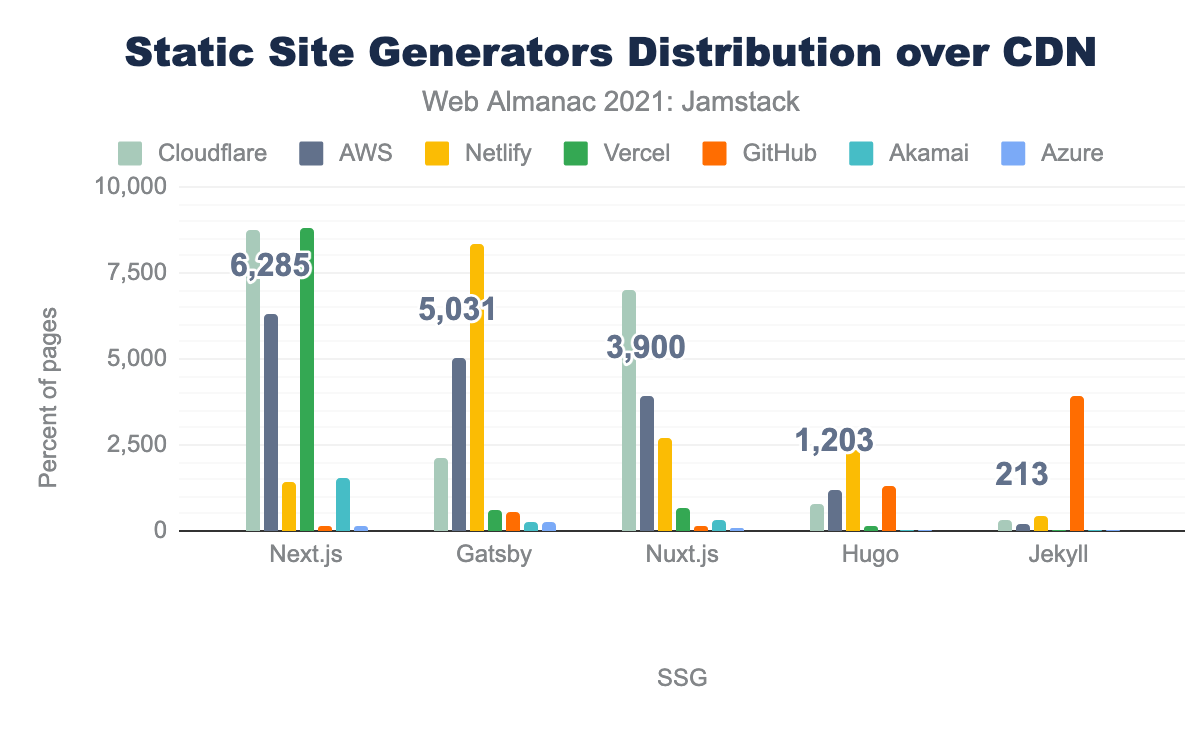
Next.js, is the most popular, mostly served by Cloudflare, Vercel, and AWS. Most of Gatsby’s sites use Netlify, AWS, and Cloudflare. Nuxt.js sites preferred to be served by Cloudflare, AWS, and Netlify. Hugo mostly uses Netlify, and it’s no surprised that Jekyll is used mostly on GitHub.
On the following graph we show the relative split of CDNs used for popular CDNs:
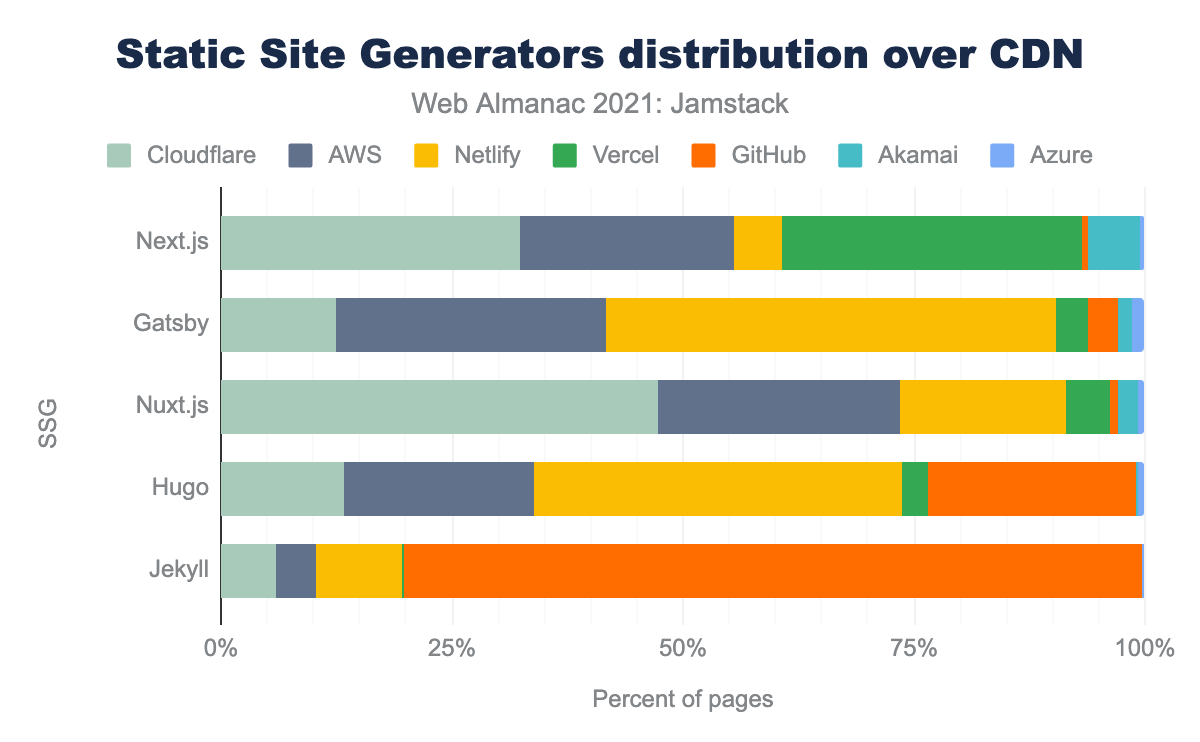
Next.js is mostly served by Vercel (the company that invented Next.js). We can see that more generalized CDNs like AWS are not serving significant percentages of Jamstack sites, as opposed to more Jamstack-focussed services like Netlify and Vercel.
GitHub as CDN provider might seem unusual, but GitHub Pages allow users to deploy sites on github.io subdomains built in Jekyll SSG.
User experience and performance
In our analysis we wanted to explore what the user experience for the 1.1% of sites that have adopted Jamstack technology. We looked at Lighthouse and Core Web Vitals results.
Lighthouse
All Lighthouse scores are simulated testing data from our crawl. Hence, real-user results might be influenced depending on the mobile data providers and devices actually used.
Performance score
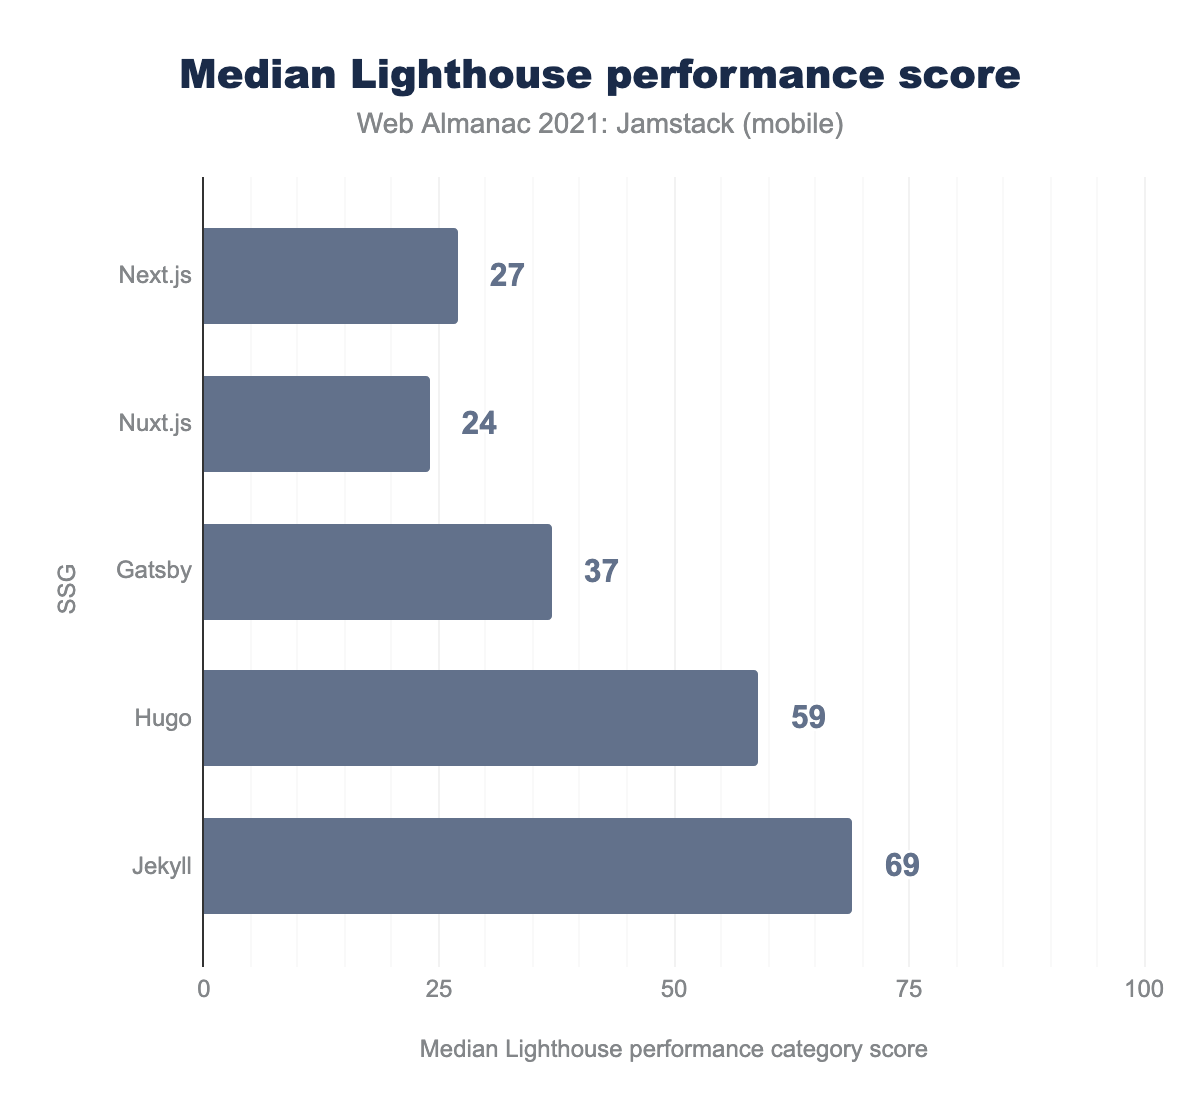
The median performance score for all SSGs across mobile varies. The top 3 SSGs with by popularity can’t even surpass a score of 40. Since they are used in top ranking sites and since users a likely distributed all around the world, we can assumed that they are used across many different devices and networks. We can expect more out-of-the-box improvements like Next.js image component to help performance.
Jekyll is a stand out, achieving a score of almost 70 which is a great result for such a mastodon in the SSG area. Learn more about Lighthouse performance audit to understand exactly what measures are included in this score.
Accessibility score
Lighthouse also runs audits to measure accessibility and here we seem to have better results:
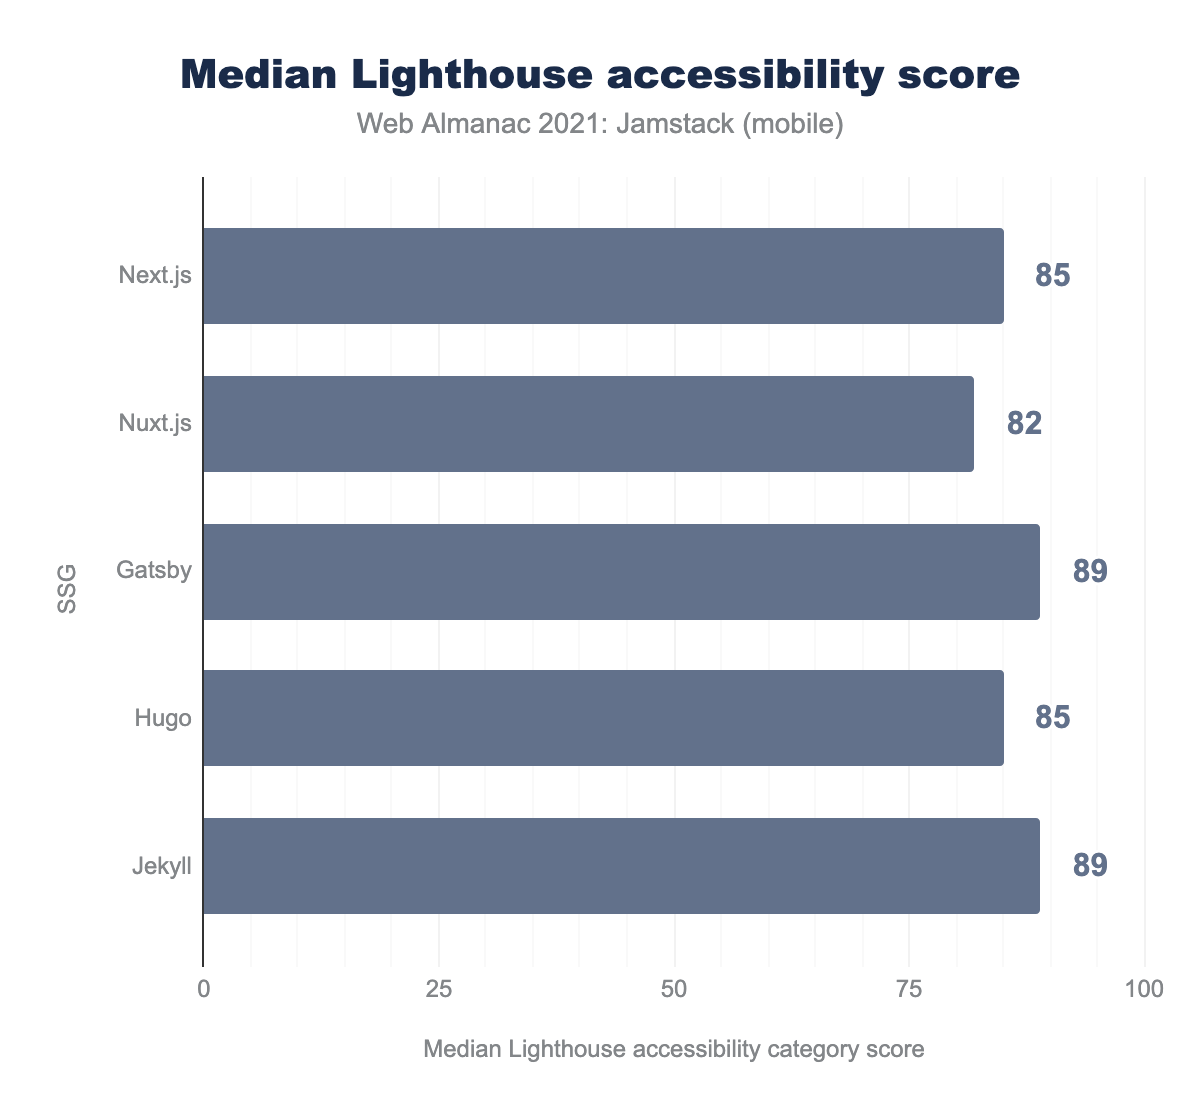
There are limits to what can be checked in an automated accessibility check, but this is still a positive sign. Read the Accessibility chapter for more on this subject.
SEO score
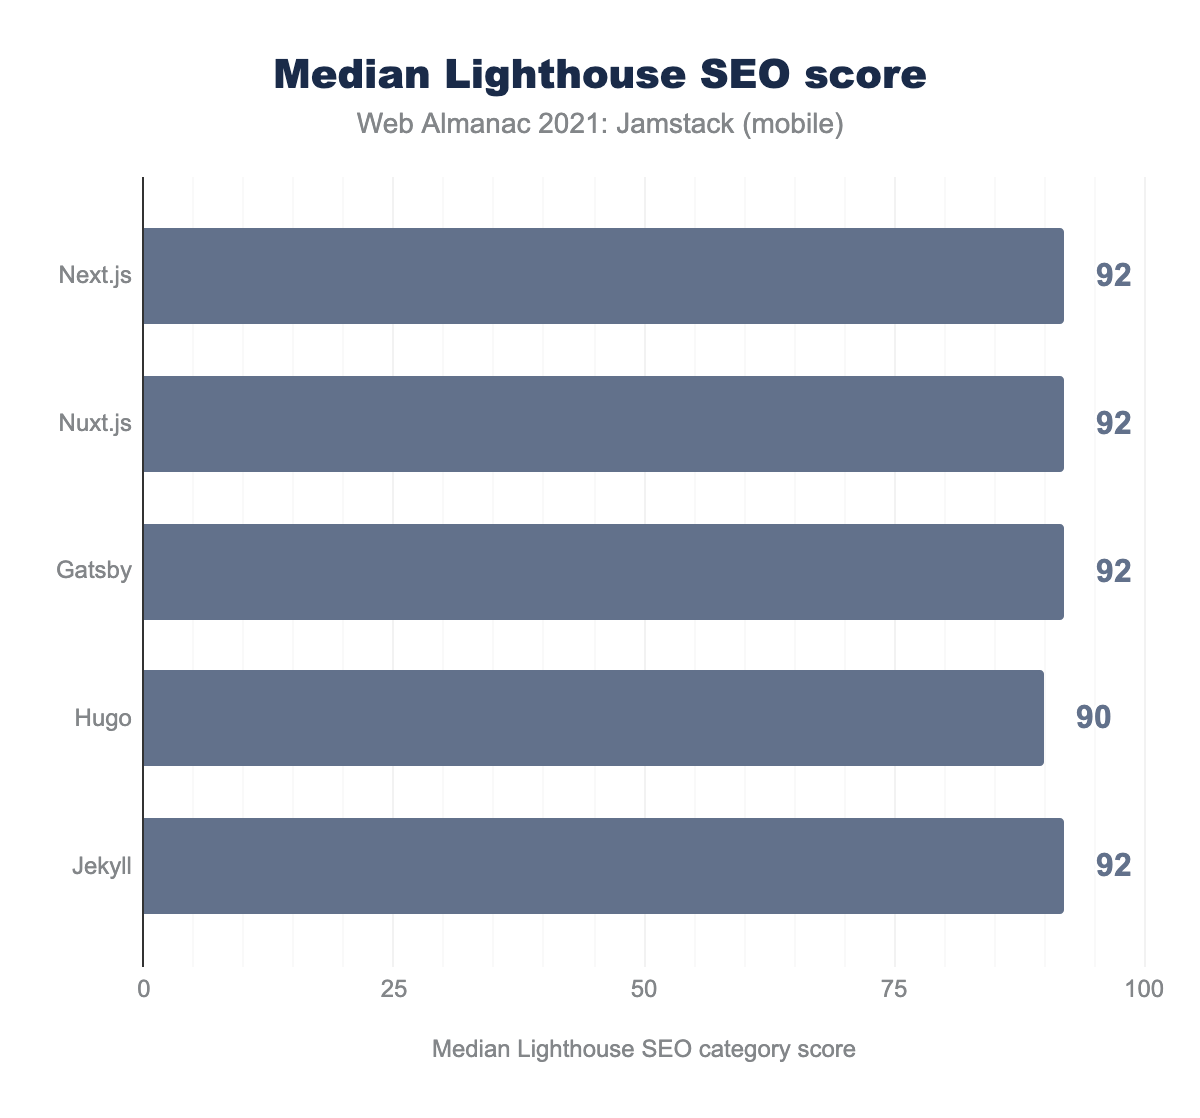
Similarly, all Jamstack sites provide great SEO scores from 90 to 92. Using static content always was SEO-friendly technique by default. Moreover, SSGs allow additional out of the box functionality to optimize sites for search engines.
The bottom line here is that Lighthouse results in general are good, but performance and PWA should be the main target for SSGs, these categories need some work to improve developer experience out of the box, hence the end result of sites performance will be improved.
Core Web Vitals
Core Web Vitals (CWV) is an initiative to provide unified guidance for quality signals that are essential to delivering a great user experience on the web. CWV itself uses 3 performance metrics:
- Largest Contentful Paint (LCP) - which measures the load time of the presumed main content of the page.
- First Input Delay (FID) - which measure interaction delays.
- Cumulative Layout Shift (CLS) - which measures visual stability so content is not moving around as the page loads and the user reads the content.
We used the Chrome UX Experience Report (CrUX) which gathers real-user data of these values and so is a better measure of actual user experience than the lab-based performance metric that Lighthouse provides.
We analyzed data for the SSGs, but this also reflects how those are delivered. As we saw above some sites are used more or less on different CDNs which may have a better (or worse!) impact on performance because of that so we also look at that data.
In the overall assessment for SSGs we can understand the basic performance level of Jamstack sites. CWV assessment contains data of 75% percentile of page loads which have a good score of CWV across all metrics.
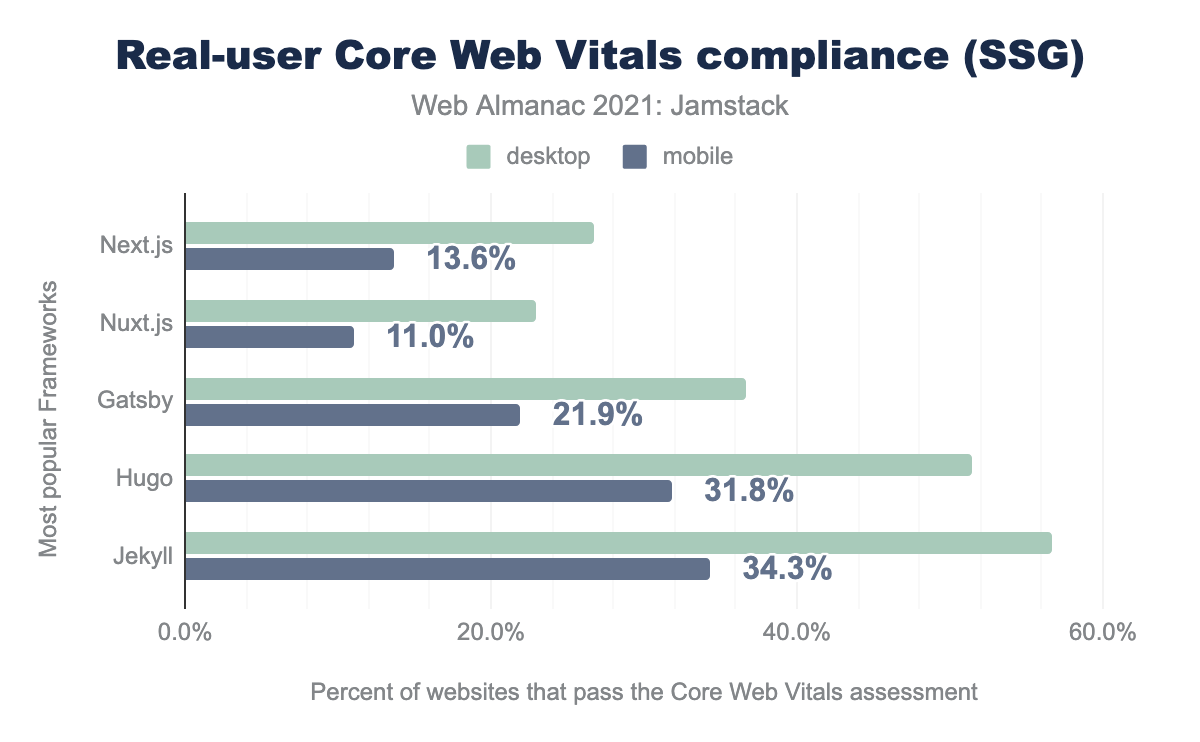
Looking at mobile results, Jekyll and Hugo have the best results over SSGs—34.3% and 31.8% of all sites scored good. Gatsby is third with 21.9%, but it’s the first of the JavaScript-based SSGs. Next.js with 13.6% of good performance pages and Nuxt.js has 11.0%.
Largest Contentful Paint
The Largest Contentful Paint (LCP) metric reports the render time of the largest image or text block visible within the viewport, relative to when the page first started loading.
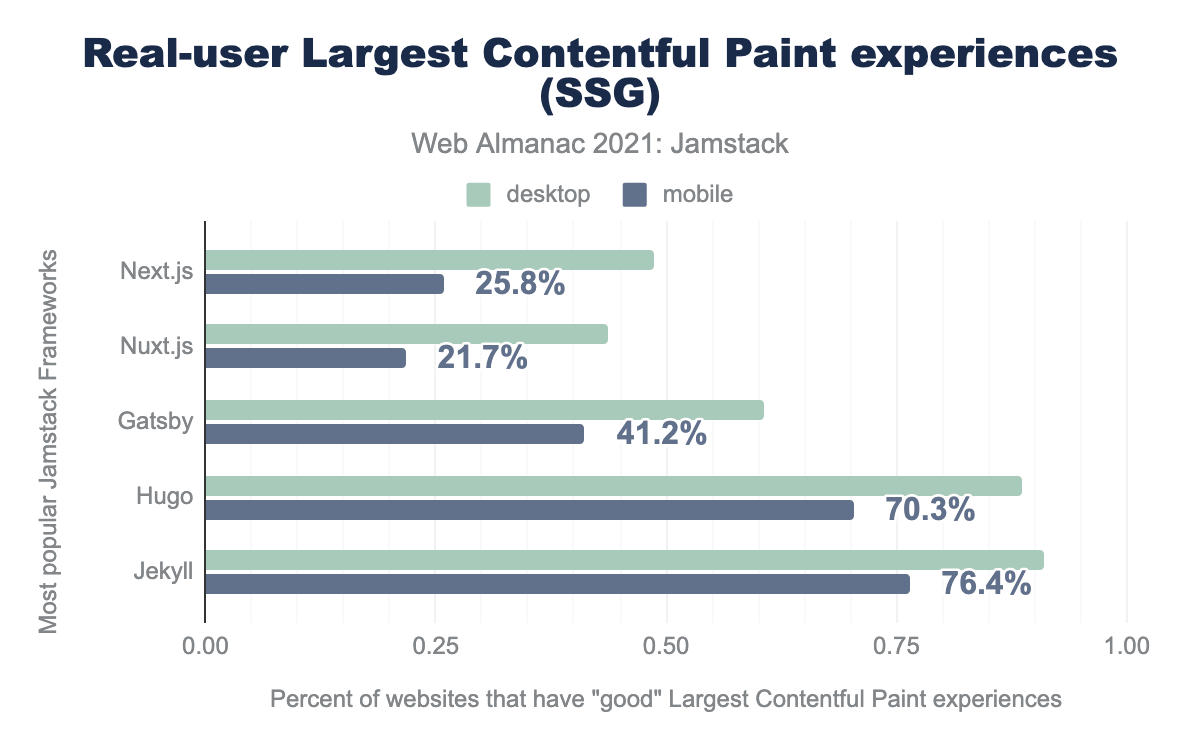
Above we see the same results are approved by percent of sites with good LCP experience. The best results show Jekyll and Hugo with 76.4% and 70.3% of mobile sites having a “good” LCP of under 2.5s. The JavaScript based SSGs (Gatsby, Next.js, and Nuxt.js) fair worse.
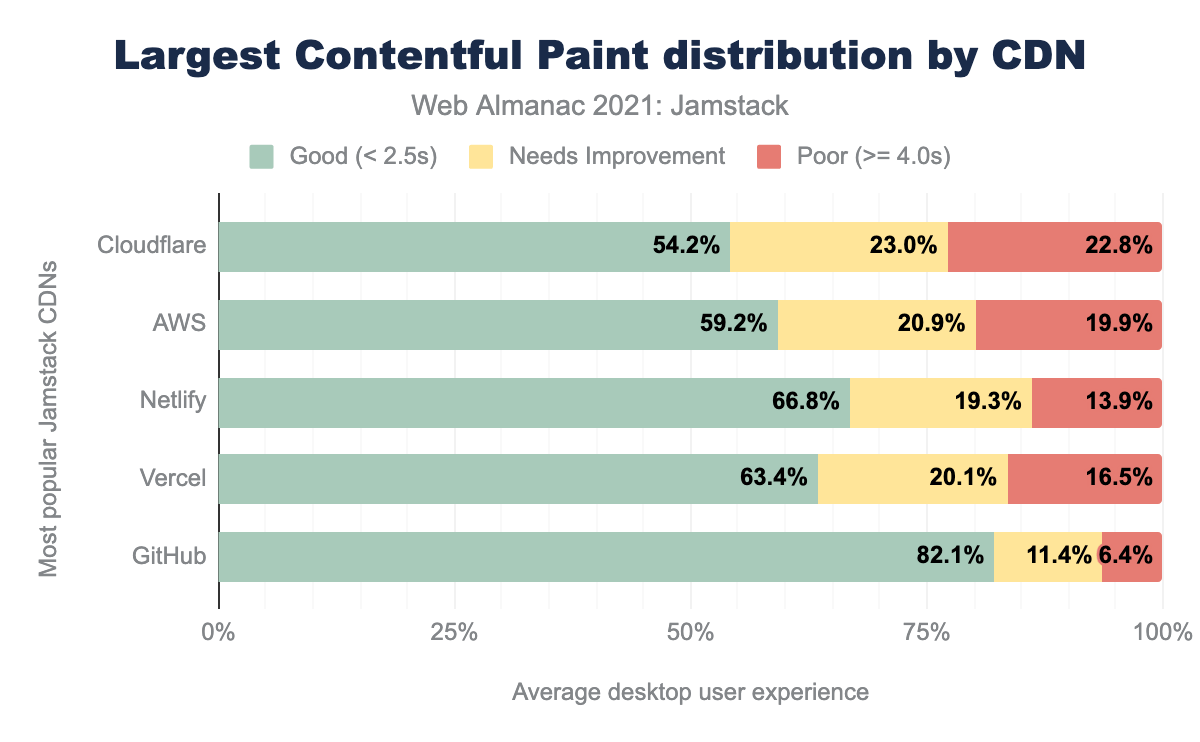
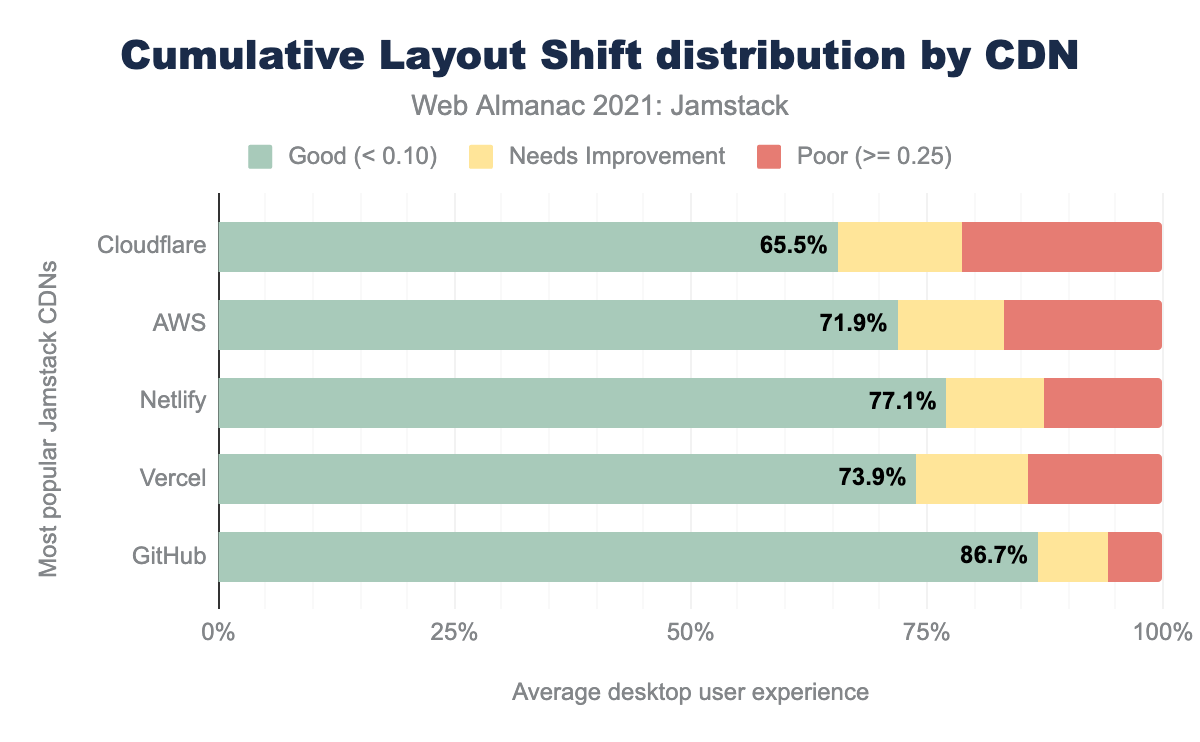
GitHub tops the stats when measuring on CDN level, likely reflecting the simpler sites hosted here. Netlify, a Jamstack-oriented CDN, comes next with 66.8% of sites having a good LCP followed by Vercel with 63.4% followed by AWS with 59.2% and Cloudflare at 54.2%.
First Input Delay
First Input Delay (FID) measures the time from when a user first interacts with a page (i.e. when they click a link, tap on a button, or use a custom, JavaScript-powered control) to the time when the browser is actually able to begin processing event handlers in response to that interaction.
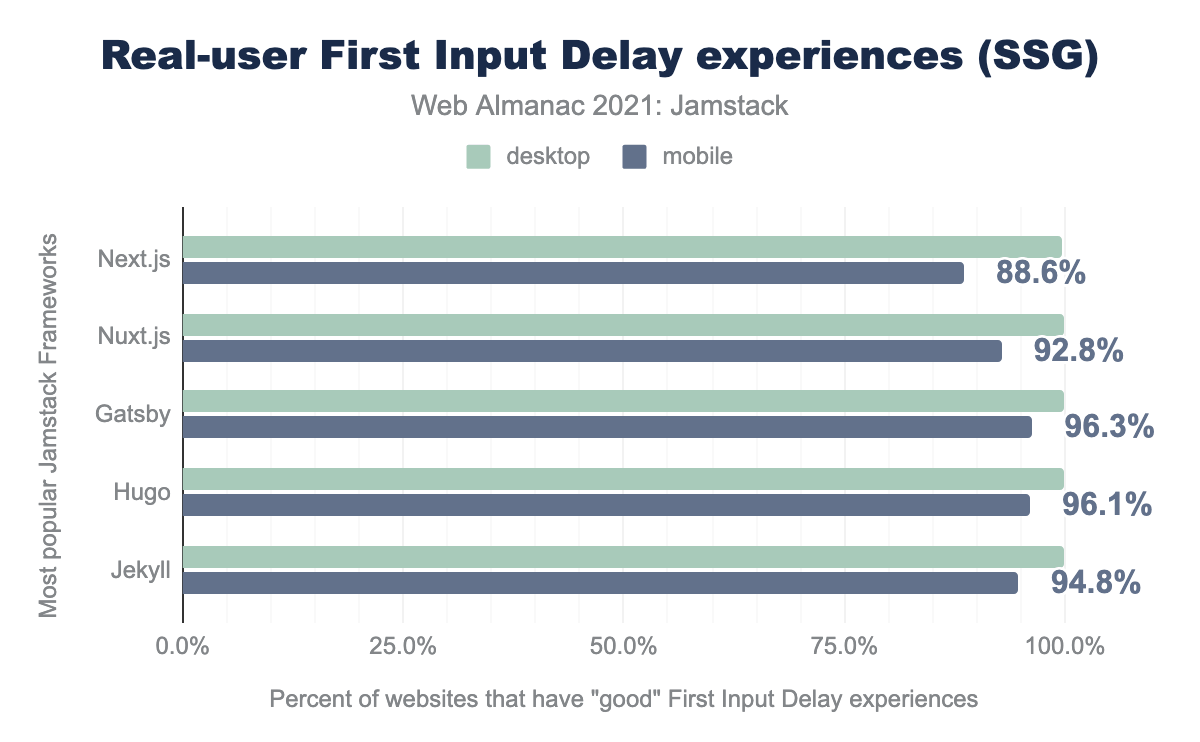
On a real user experience, All SSG show great FID results across different SSGs.
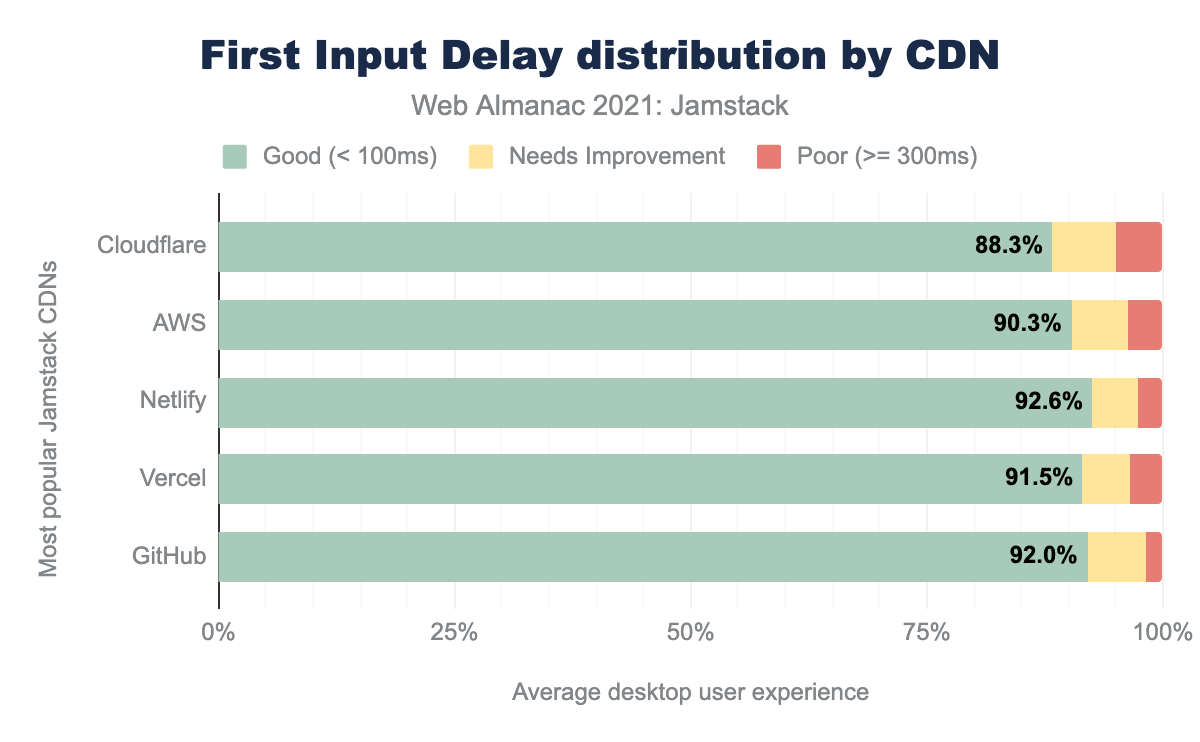
All CDNs deliver Jamstack sites with 88% good FID or above, though interesting that the Cloudflare and AWS sites fare slightly worse than the Jamstack-orientated CDNs.
Cumulative Layout Shift
Cumulative Layout Shift (CLF) is a measure of the largest burst of layout shift scores for every unexpected layout shift that occurs during the entire lifespan of a page.
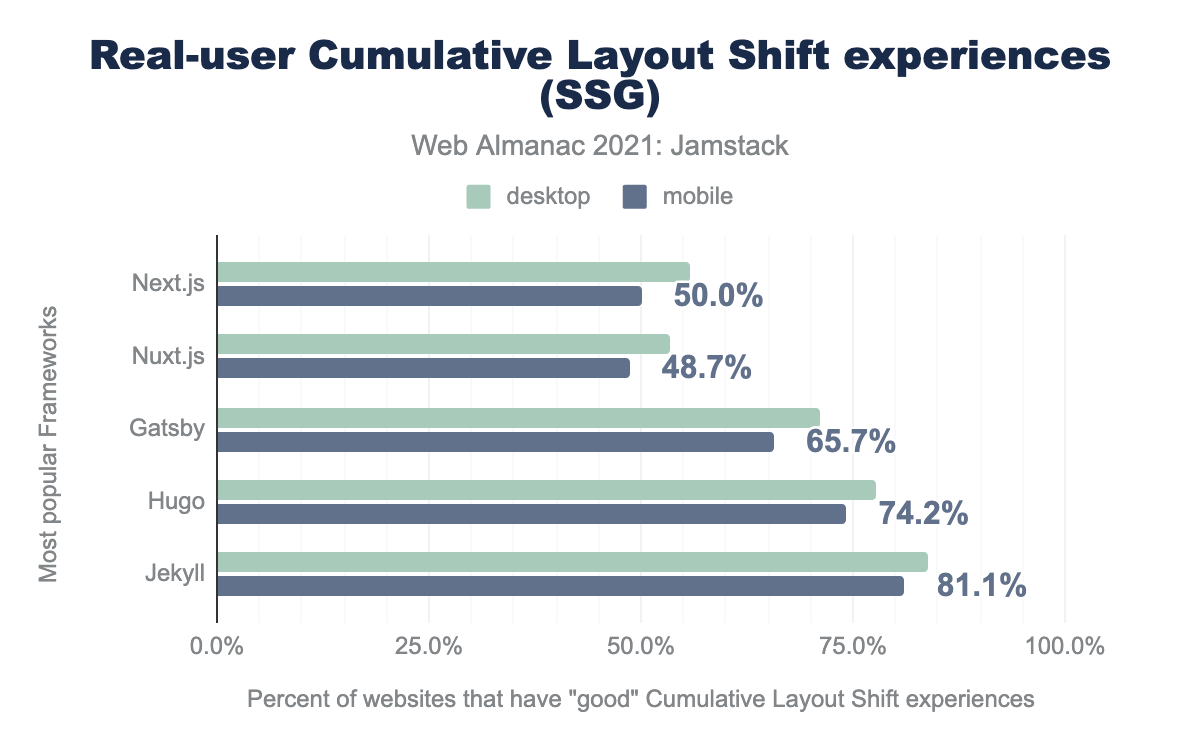
Again, Jekyll shows great performance here. 81.1% of mobile are good results. Followed by Hugo at 74.2%, Gatsby at 65.7%, Next.js at 50.0%, and Nuxt.js trailing the pack at 48.7%.
Here’s the same results as with previously for CDNs. GitHub, Netlify, Vercel.
In general CWV results reflect Lighthouse results. Huge and Jekyll have better real user performance data. We can’t detect how complicated sites were built with these SSGs. We can bet that with modern SSGs like Next.js, Nuxt.js, Gatsby there are a lot of JavaScript delivered, more data to render including images. Hence, it affects performance results. Nevertheless, an interesting correlation between GitHub and Jekyll, which in tandem shows great results.
Resources
Let’s dive into resource weights between top fives SSGs to understand their influence on performance. The results represent median values.
Resources weight
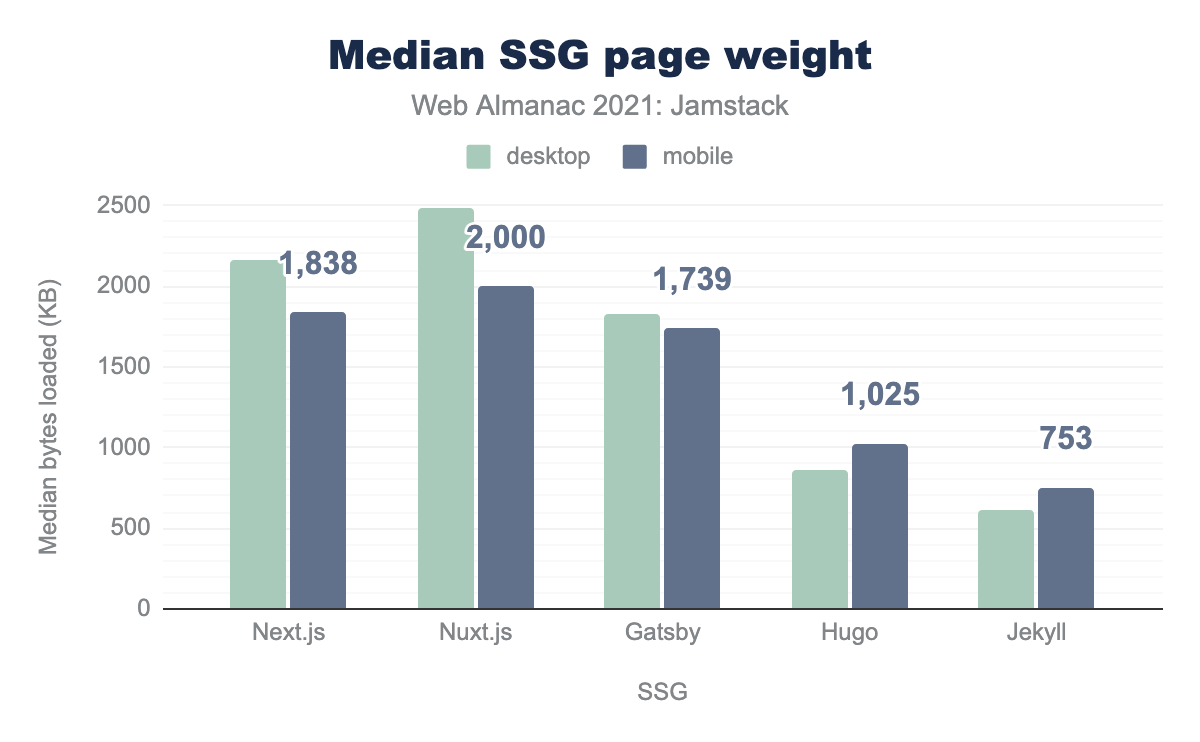
JavaScript based SSGs have almost 2 times larger amount of resources than Hugo and Jekyll. The top one is ~2 MB for Nuxt.js, followed by Next.js and Gatsby with almost 1.8 MB and 1.7 MB.
As we mentioned above, JavaScript-based SSGs include JavaScript frameworks out of the box. That makes development easier, but requires more responsibility. The JavaScript ecosystem makes it ease to add more and more libraries to a site, for various purposes, which can lead to large bundle sizes.
JavaScript
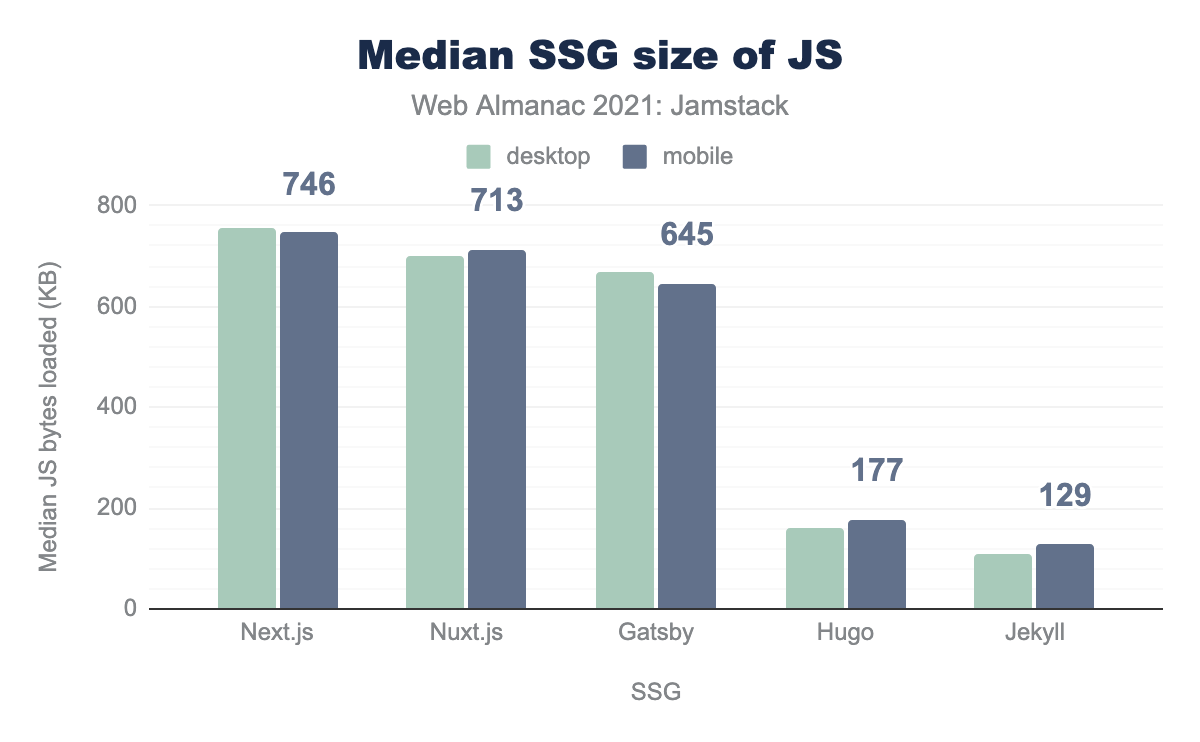
A big chunk of resources are for JavaScript. Again, for JavaScript-based SSGs it’s a much bigger compared to others - around 700 KB compared to around 150 KB for non-JavaScript based SSGs. While this is not surprising, it’s interesting to see the actual differences laid out in this way. Next.js based sites use more JavaScript than others. Hugo and Jekyll developers on other hand seem to be using JavaScript more responsibly and keeping their bundles tight. Another reason for that might be site complexity. Hugo and Jekyll sites are not represented as much in top ranking sites, so they might have simpler use cases than, for example, Next.js sites which do appear more often in the top ranking sites.
We analyzed which third party libraries were used among SSGs. We excluded React and Vue to have a clear picture of other libraries and frameworks represented among SSGs.
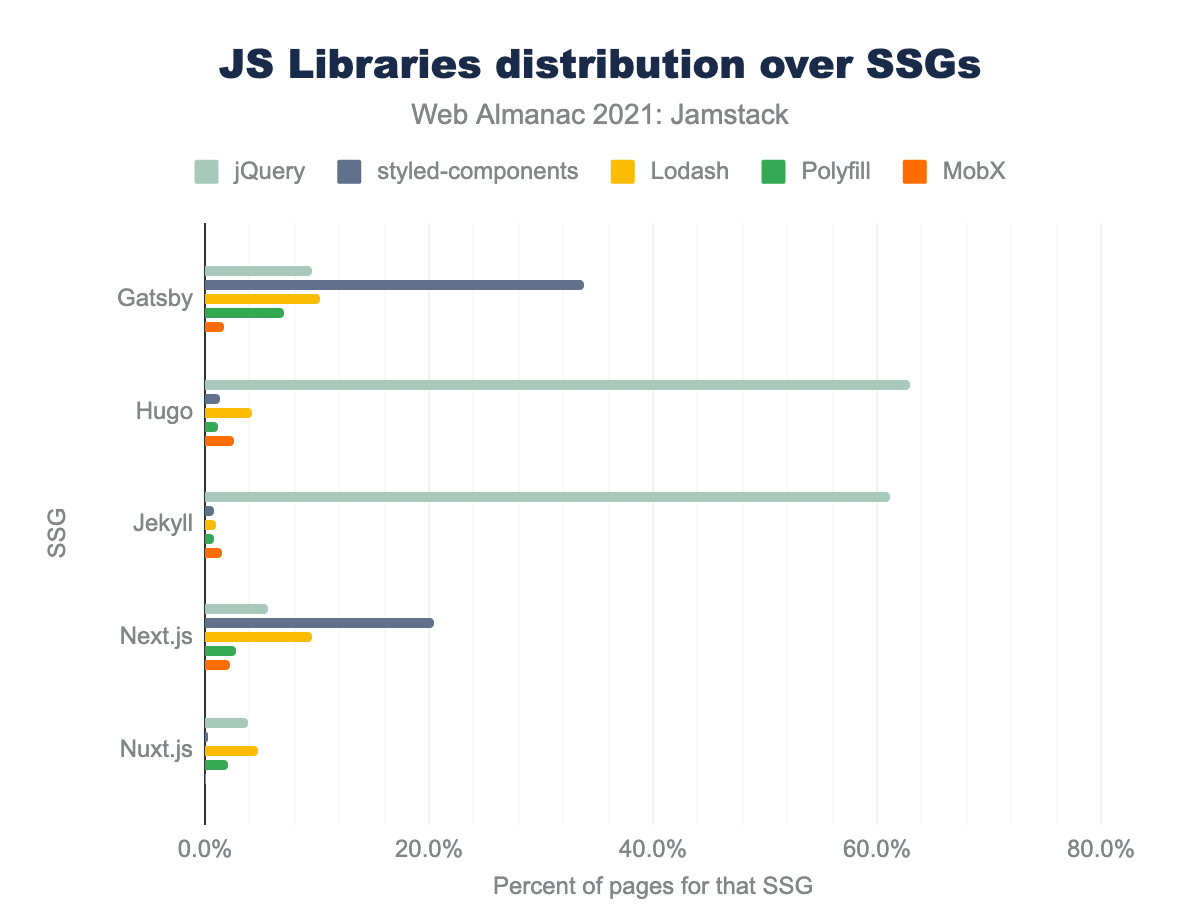
A big surprise for us was jQuery. It wasn’t a surprise that it’s used for Hugo and Jekyll based sites (more than 60%), but that it’s used inside React and Vue based sites wasn’t expected! Next.js, Many Nuxt,js, and Gatsby sites use jQuery too.
Styled-components was used for Next.js - 20% and Gatsby takes 34% from all of third party libraries. Nuxt.js sites almost don’t use it.
Lodash is heavily used and was present among all SSGs up to 10% for Gatsby.
CSS
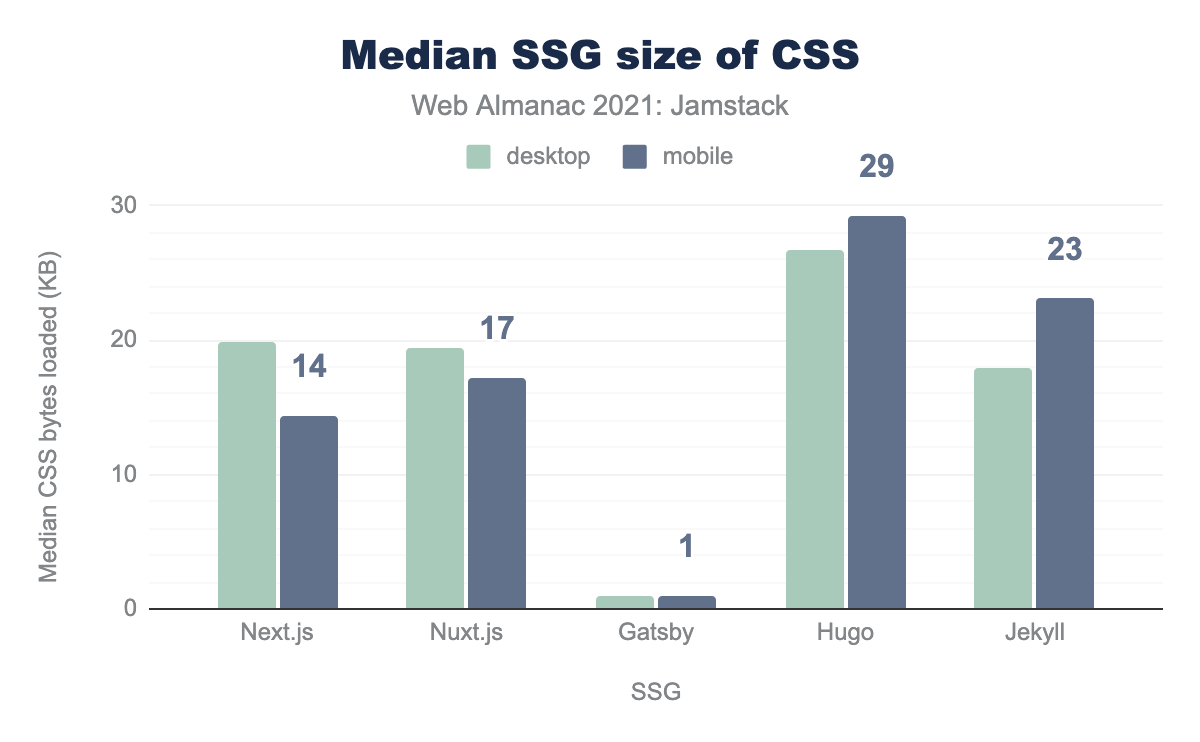
On the other hand, CSS is slightly heavier than Hugo and Jekyll. Since of the benefits of styled-components is clean, non-repetitive CSS, this could explain why CSS size for these JavaScript SSGs are lower. One more hypothesis is that old fashioned SSGs use old fashion methods for handling interactions and animations using CSS. JavaScript-based SSGs use more JavaScript in general, hence they might more often be used to replace functionality that could be implemented with CSS.
Images
Images weights distributed differently. There’s no correlation between SSG groups.
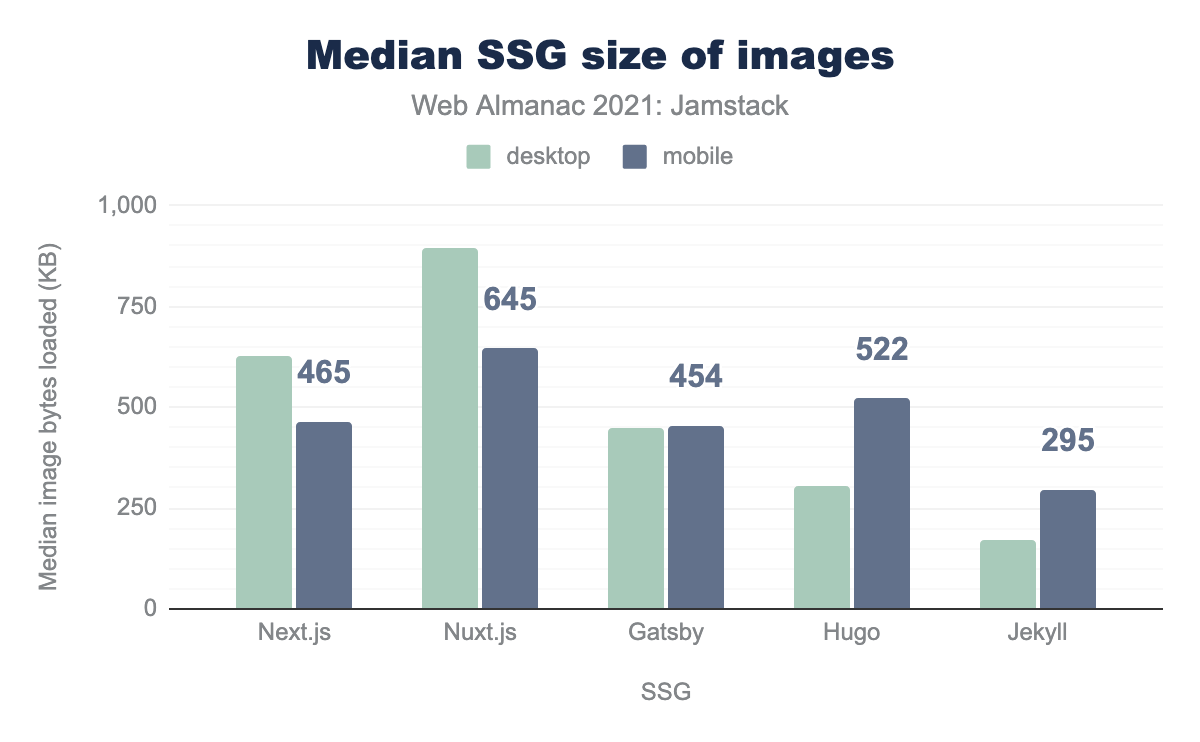
Nuxt.js has the highest value at 645 KB. Hugo is next with 522 KB. Next.js and Gatsby are almost the same at 465 KB and 545 KB respectively. Jekyll has the lowest value at 295 KB.
Images format adoption
Images are one of the bottlenecks of good User Experience (UX). If they are large, then the user has to wait for a long time for the image to be delivered. It can lead to layout shifts and other problems.
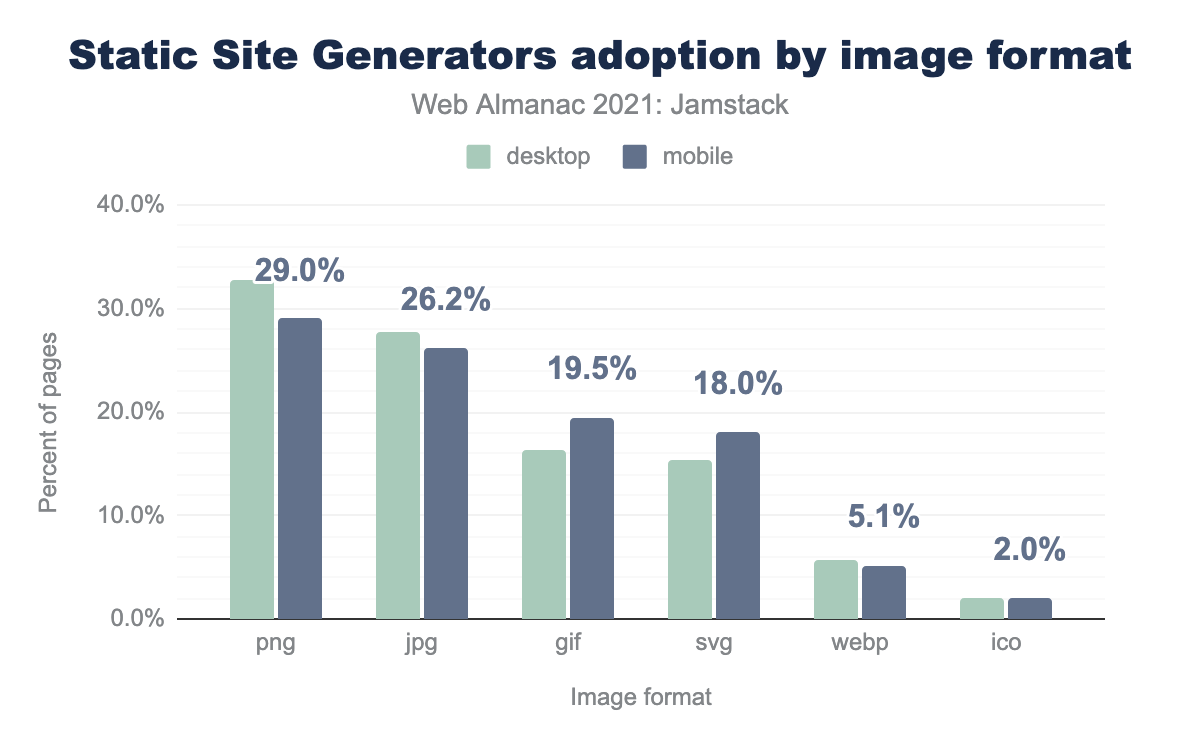
png is 32.7% on desktop and 29.0% on mobile, jpg is 27.7% and 26.2% respectively, gif is 16.2% and 19.5%, svg is 15.3% and 18.0%, webp is 5.8% and 5.1%, and finally ico is 2.1% and 2.0%.As one of the newer generation of image formats, WebP has 5.1% of usage among Jamstack sites. Compared to last year’s results, when WebP had only 3%, we can say it’s a good improvement over one year.
Still, the most used is PNG at 29.0% and JPEG at 26.2%, GIF at 19.5%, and SVG is used on 18.0% of web pages.
What the resources tells us
This analysis of resource weights confirms that performance of Next.js, Nuxt.js and Gatsby are likely struggling because of huge resources. 2 MB of page weight and ~ 700KB of JavaScript that will definitely have an impact on performance scores, especially for average mobile devices and slower networks. Heavy usage of styled-components for Next.js and Gatsby sites might be another cause of of lesser performance. A positive signal is that image adoption of next-generation image formats is growing, and this should improve UX for end users in the long run.
Conclusion
Despite limitations on not being able to include headless CMSs, and for some well-known SSGs (Eleventy or Next.js detection mode), we still have a lot of data to analyze here to draw some interesting conclusions. The Jamstack trend is growing year over year: now more than 1% of all websites are Jamstack based.
We know that Next.js covers around 40% of measurable Jamstack sites. It’s not only trending, but also used in 3.8% of the top 1,000 sites followed by the other popular SSGs such as Nuxt.js and Gatsby. These are all relatively new players just a few years in the space but they have solidified their place by good usage among top ranked sites as well.
SSGs are used all around the world, and are not confined to those countries with the founding companies of this model are based. In fact it seems that some of the fastest-growing adopters of Jamstack technology, with up to 5% of sites, are those regions furthest away from the tech hubs of Silicon valley.
Like all websites, maintaining good performance of Jamstack sites requires knowledge of best practices and experienced developer level to achieve good results, but SSGs can improve this by working on out-of-the-box solutions to improve in that area. Hope you enjoyed the data and give Jamstack a try.
