Markup
Introduction
Have you ever wondered what happens when you try to visit a web site? After you enter the URL in the address bar of your browser, one of the first things that happens is that a HTML file is downloaded and parsed. You could say that markup is the foundation of the Web. We’ve dedicated this chapter to looking at some of the bricks that make the web stand today.
We’ve drawn on the data analyzed for the past three years to try to come up with a few questions around the future of markup, the trends emerging over the years, and the adoption rate of new standards. We’ve also shared the data in the hopes that you’ll dig deeper into it, and interpret it in a way that we haven’t.
In the Markup chapter, we focus on HTML. While we briefly touch on other markup languages (like SVG or MathML) or other topics in the Web Almanac, those are covered in more detail in their own dedicated chapters. Because the markup is the gateway into the web, it was extremely hard not to dedicate a whole chapter to it.
General
We’ll start with some of the more general aspects of a markup document: things like document types, document sizes, document language, and compression.
Doctypes
Ever wondered why all pages start with <!DOCTYPE html> or something similar, even in 2021? Doctypes are required because they tell the browsers not to switch into “quirks mode” when rendering a page, and instead, they should make a best-effort attempt to follow the HTML spec.
This year, 97.4% of pages had a doctype, slightly up from last year’s 96.8%. Looking at the past couple of years, the doctype percentage has increased steadily by half a percentage point every year. In an ideal world, 100% of web pages would have a doctype—at this rate, we’ll live in an ideal world by 2027!
In terms of popularity, HTML5, better known as <!DOCTYPE html> is still the most popular doctype, with 88.8% of mobile pages using it.
| Doctype | Desktop | Mobile |
|---|---|---|
| HTML (“HTML5”) | 87.0% | 88.8% |
| XHTML 1.0 Transitional | 5.7% | 4.6% |
| XHTML 1.0 Strict | 1.4% | 1.3% |
| HTML 4.01 Transitional | 0.9% | 0.7% |
| HTML 4.01 Transitional (quirky) | 0.5% | 0.5% |
The surprising part is that, almost 20 years later, XHTML is still a considerable part of the web, with 8% of pages still using it on desktop and a little under 7% on mobile.
Document size
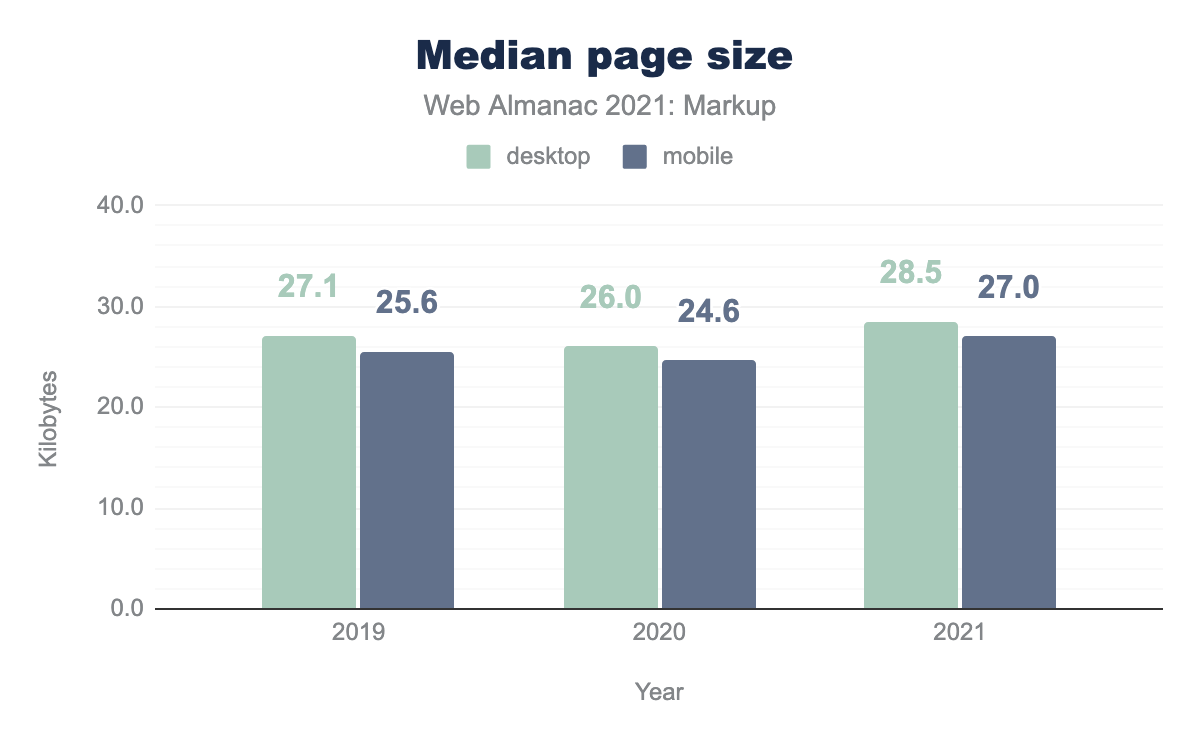
In a mobile world, where every byte of data has a cost associated with it, document sizes for mobile websites are becoming increasingly more important. It is also increasingly bigger, by the looks of it. This year, the median mobile page had 27 KB of HTML, up 2 KB from last year. On the desktop side, the median page had 29 KB of HTML.
The interesting points were:
- The median page sizes in 2020 were shrinking when compared to 2019. Looking at the figure above, we’ve had a slight increase this year, after the dip in 2020.
- The biggest HTML documents for both desktop and mobile have shed a whopping 20 MB each this year, with the biggest ones being 45 MB on desktop and 21 MB on mobile.
Compression
With document sizes increasing, we also looked at compression this year. We felt the document size relates closely to the level of compression used when transferring it over the wire.
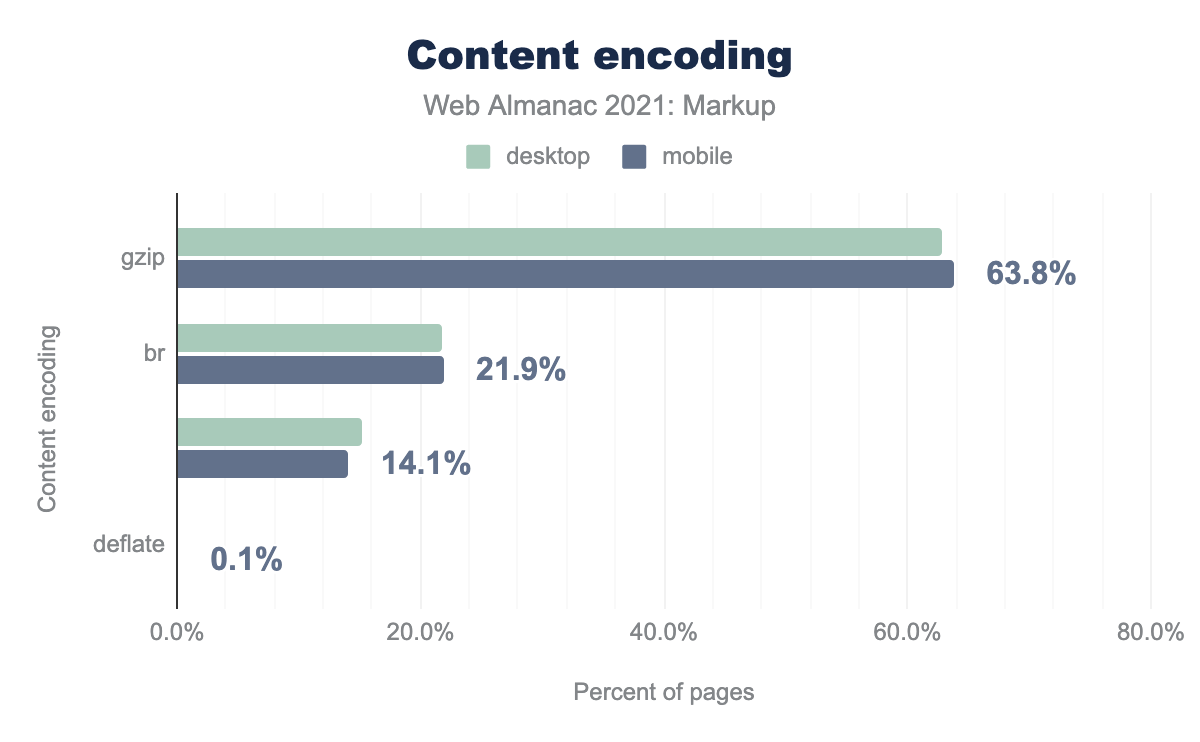
Out of the 6 million desktop pages scanned, an overwhelming 84.4% were compressed with either gzip (62.7%) or Brotli (21.7%) compression. For mobile pages, the numbers are very similar, 85.6% were compressed with either gzip (63.7%) or Brotli (21.9%) compression. The slight variation in percentages for mobile and desktop is not surprising, as they comprise of different URLs, and the Mobile data set is a lot larger.
Compression is important as, particularly in a mobile world, every byte of data has a cost associated with it. You can learn more about the states of content encoding and the mobile web in the Compression and Mobile Web chapters.
Document language
We’ve encountered 3,598 unique instances of the lang attribute on the html element. Because there are 7,139 spoken languages at the time of writing this chapter, it made us think not all of them were represented. When we factored in the script and region subtags, even fewer remained.
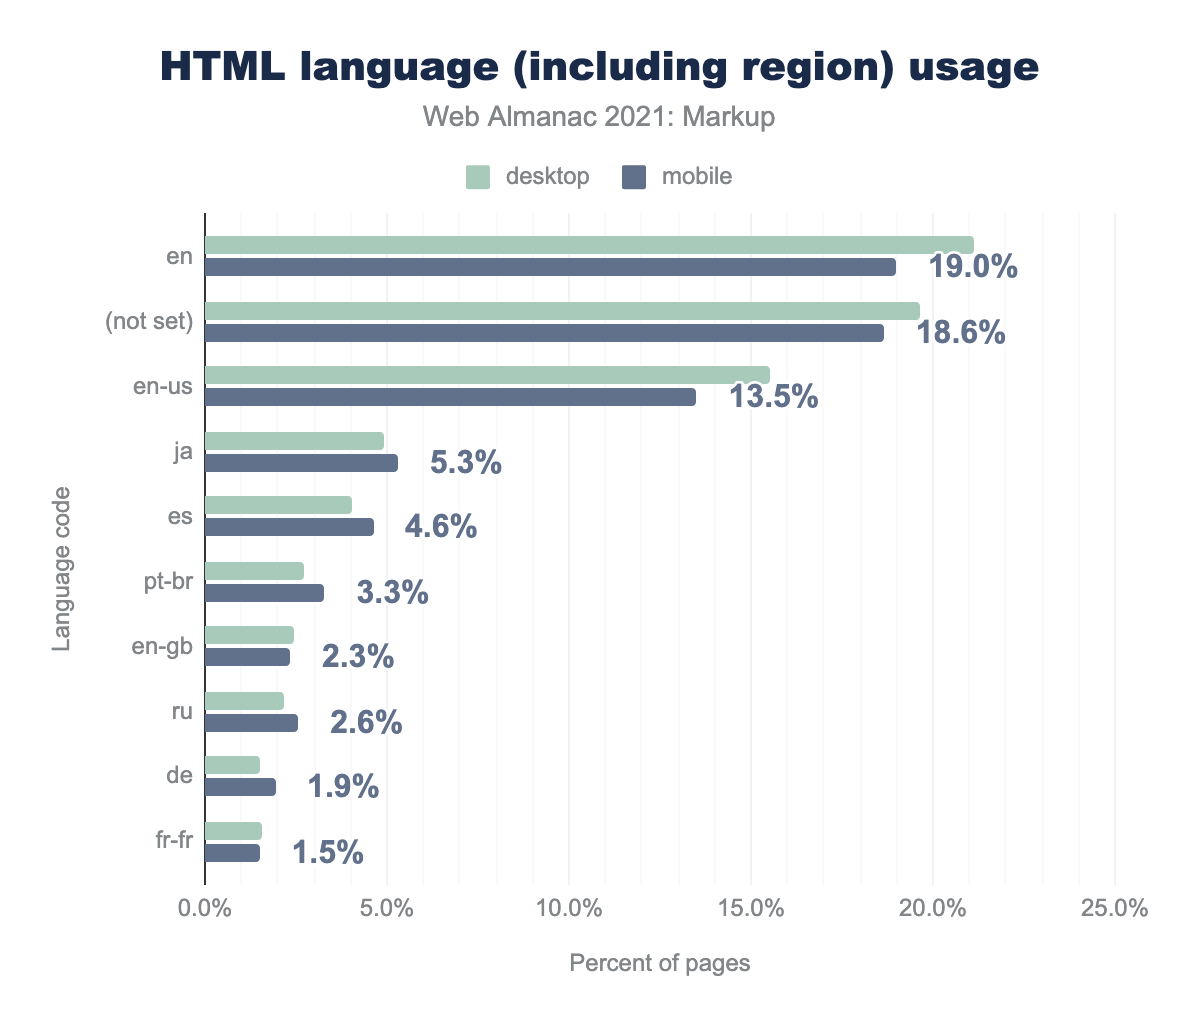
Out of the pages scanned, 19.6% on desktop, and 18.6% on mobile, specified no lang attribute, even though the Web Content Accessibility Guidelines (WCAG) requires that a page language is defined and “programmatically accessible”. Languages can be specified in different ways, including an xml:lang element, which we didn’t check for, so there might still be hope for some of the pages scanned.
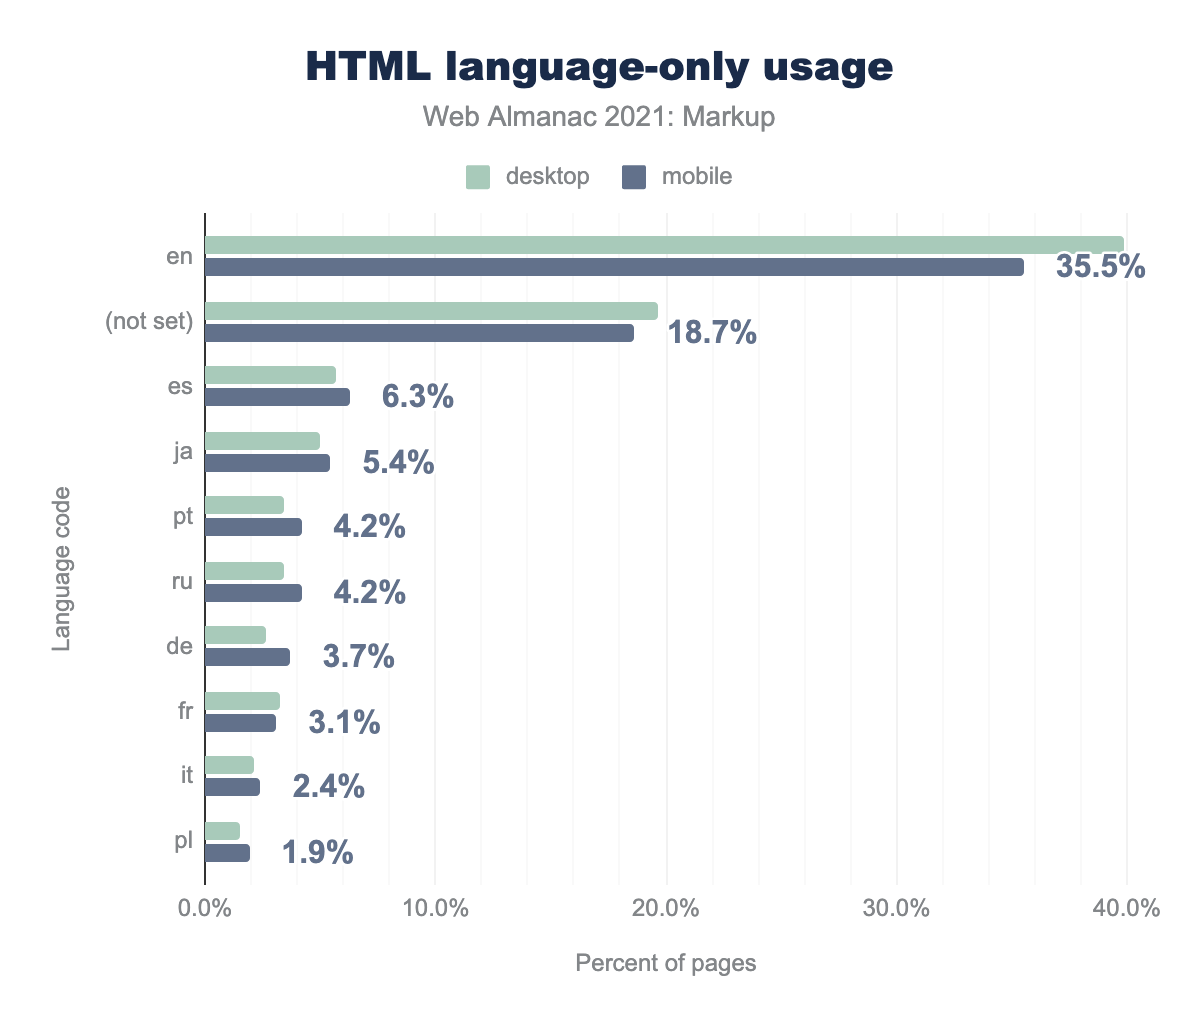
While we looked at the top 10 normalized languages in the set, some interesting trends emerged:
- Mobile has a lower relative percentage of English websites. We’re not sure why that is the case, we’ve been discussing the cause as a team. It’s possible that some people only use mobile phones to access the web, so that would diversify the mobile set’s language landscape. This author believes a lot of the mobile pages are intended to be used on the go and hence are local.
- While Spanish has a lot more region and subscript options than Japanese, it was a tight contest for the second most popular language.
- There is an inverse correlation between the difference in empty attributes for desktop and mobile and English.
Comments
Most production build tools have an option to remove comments, but we’ve found a majority of the pages we’ve analyzed, 88%, had at least one comment.
While comments are generally encouraged in code, a particular type of comment, conditional comments, were used in web pages to render markup for particular browsers.
<!--[if IE 8]>

  <p>This renders in Internet Explorer 8 only.</p>

<![endif]-->
Microsoft dropped support for conditional comments in IE 10. Still, 41% of the pages had at least one conditional comment present. Aside from the possibility that these are very old websites, we could only assume they are using some sort of variation of polyfilling framework for older browsers.
SVG use
This year, we wanted to take a look at SVG usage. With popular icon libraries using more and more SVG, favicon support improving, and SVG images being on the rise in animations, it’s no surprise that 46.4% of web pages had some sort of SVG on them. 37.2% had a SVG element, 20.0% on desktop and 18.4% on mobile were using SVG images, and a negligible amount had either SVG embeds, objects, or iframes in them.
SVGs have more use cases when compared to the style element, but in terms of popularity, the numbers are comparable. SVG sits just outside the top 20 in terms of element popularity on a page.
Elements
Elements are the DNA of a HTML document. We wanted to analyze the cells that make up the living organism that is a web page. What are the most popular, the most likely to be present, and the obsolete elements on most pages?
Element diversity
There are 112 elements currently defined and in use (excepting SVG and MathML), with another 28 being deprecated or obsolete. We wanted to see how many of them were actually used on a page, and how likely a web of divs was.
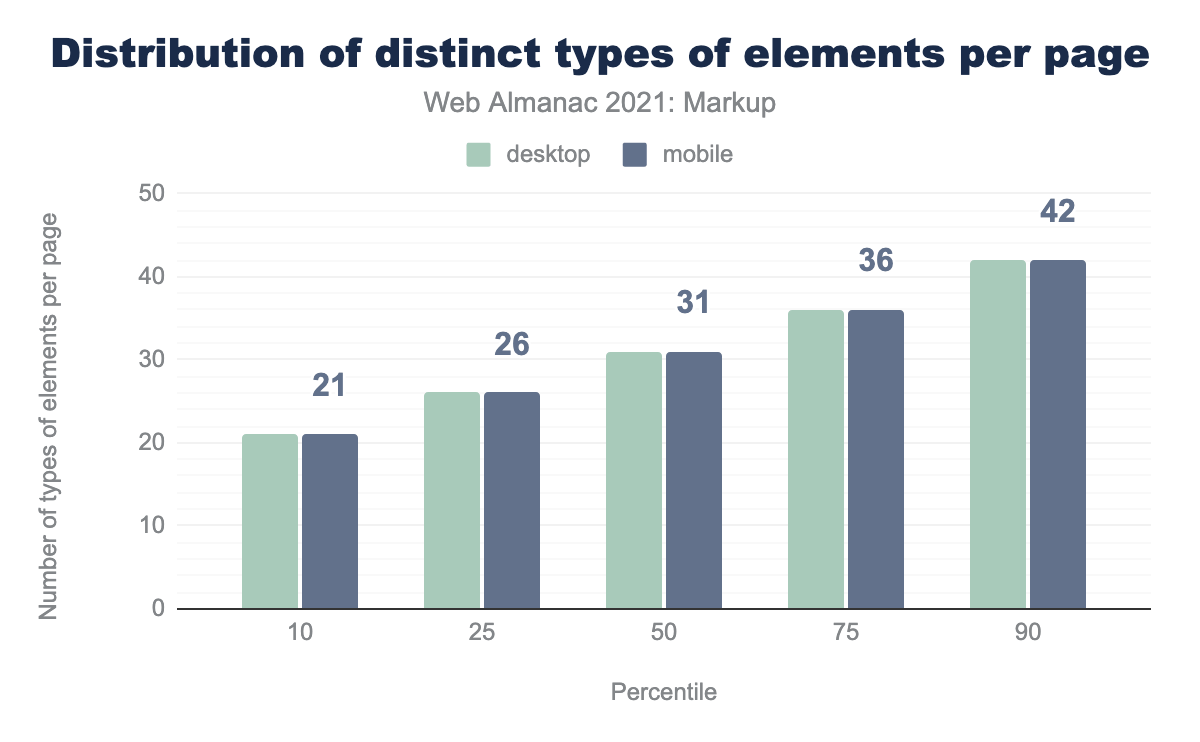
No need to panic, the web isn’t all made up of divs. The median mobile page uses 31 different elements and has a total of 616 elements.
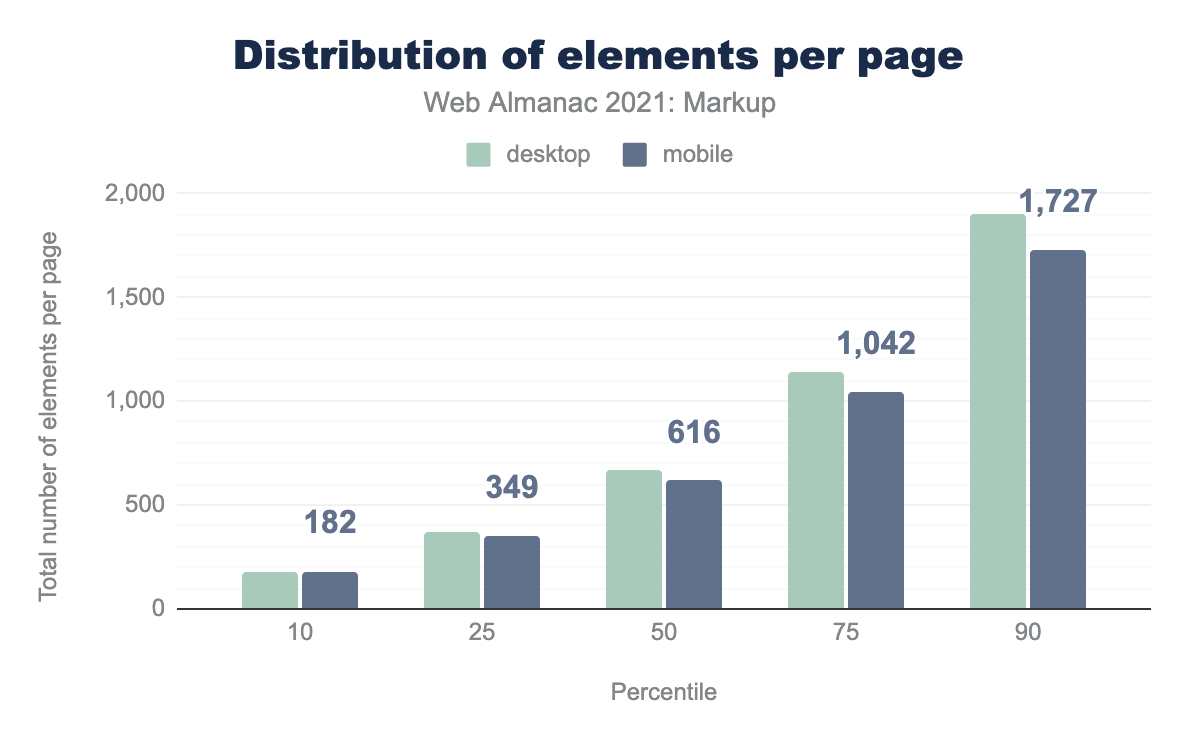
While the median page had 666 elements on desktop, and 616 on mobile, the top 10% of all pages had closer to triple that number, 1,727 for mobile and 1,902 for desktop.
Top elements
Every year since 2019, the Markup chapter of the Web Almanac has featured the most frequently used elements in reference to Ian Hickson’s work in 2005. This author couldn’t break with tradition, so we had a look at the data again.
| 2005 | 2019 | 2020 | 2021 |
|---|---|---|---|
title |
div |
div |
div |
a |
a |
a |
a |
img |
span |
span |
span |
meta |
li |
li |
li |
br |
img |
img |
img |
table |
script |
script |
script |
td |
p |
p |
p |
tr |
option |
link |
link |
i |
meta |
||
option |
i |
||
ul |
|||
option |
The top six elements haven’t changed in the past three years, and it looks like the link element is gaining a foothold as a solid number seven.
It’s interesting to see that i and option have both fallen out of favor. The first probably because libraries that misuse the i element for icons have fallen out of popularity in favor of libraries using SVGs for icons. The meta element is making a strong push into the top 10 this year, perhaps because social markup is also on the rise. We’ll look at social markup in a later section of this chapter. The rise of styled select elements accounts for the ul (unordered list) element gaining popularity over the option element.
main
With the creation of content spiking in 2021 (most likely because the world was stuck in a pandemic), we wanted to see if that correlates to an adoption of content elements as well. We thought main is a good indicator, it being an informative element that doesn’t affect the DOM’s concept of the structure of a page.
main element.
27.7% of desktop pages and 27.9% of mobile pages had a main element. In terms of popularity, it made it well in the top 50 elements, at a respectable 34th place. Before you start thinking that there are only 114 elements, we’ve actually had more than a thousand elements come back from the queries we ran, most of which were custom.
base
Another curiosity was how much developers were paying attention to the stricter rules of the HTML spec. For example, the spec says there must be no more than one base element in a document, because the base element defines how user agents should resolve relative URLs. Having more than one base element introduces ambiguity, so the spec requires that all base elements after the first be ignored, rendering them useless.
From looking at the desktop pages, base is a popular element, with 10.4% of pages having one. But do they have only one? There are 5,908 more base elements than pages, so we can only conclude at least some pages have more than one base element. Who said developers were great at following directions? We would also recommend people validate their HTML using the W3C-provided Markup Validation Service.
dialog
Throughout the chapter we wanted to also look at the adoption of some of the more controversial or new elements. dialog is one of them, with not all major browsers supporting it out of the box yet. Only 7,617 pages on desktop and 7,819 pages on mobile are using a dialog element. When we consider that’s only around 0.1% of the pages analyzed, it doesn’t look like the adoption is there yet.
canvas
The canvas element can be used with either the Canvas API or WebGL API to draw graphics and animations. It’s one of the main elements used for games or mixed reality on the web. It’s no surprise 3.1% of the desktop pages and 2.6% of the mobile pages use it. The higher usage on desktop makes sense when you consider the graphic capabilities of the different devices, and the use cases skewed towards games and virtual reality.
Probability of element use
While the html, head, body, title, and meta elements are all optional, they’re the most common elements this year, all present on more than 99% of the pages.
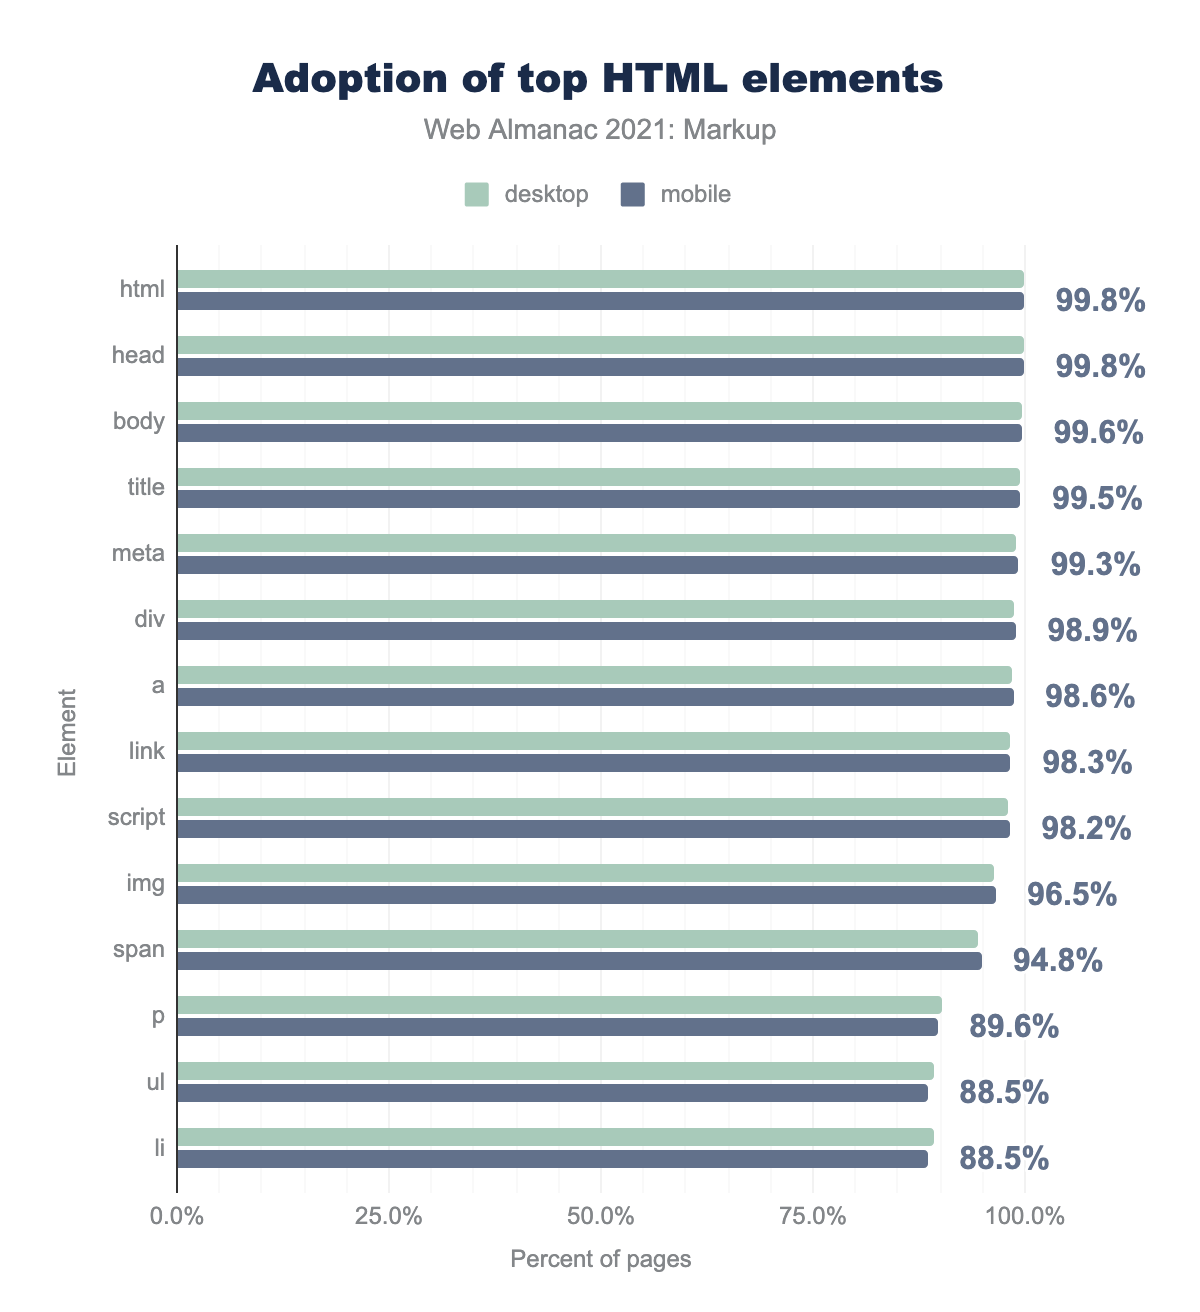
While the percentages are slightly different when compared with last year, the order for the most popular elements remains the same. What about some of the more exotic elements?
| Element | Percent of pages (mobile) |
|---|---|
tt |
0.04% |
ruby |
0.02% |
rt |
0.02% |
tt, ruby, and rt elements on mobile pages.
It’s interesting to see that tt, a deprecated element for Teletype Text, is 100% more popular than ruby and rt, which are the Ruby Annotation and Text elements still used for showing the pronunciation of East Asian characters.
script
script element.
A little over 98% of the pages scanned contain at least one script element. It’s no surprise that script is also the 6th most popular element on a page. Compared with last year, the script element seems to remain constant in terms of popularity and has slightly increased levels of occurrence in the millions of pages analyzed, from 97% to 98%.
noscript element.
51.4% of pages also contain a noscript element, which is generally used to display a message for browsers that have disabled JavaScript. Another popular use for the noscript element is the Google Tag Manager (GTM) snippet. 18.8% of pages on desktop and 16.9% of pages on mobile are using the noscript element as part of the GTM snippet. It’s interesting to note that GTM is more popular on desktop than mobile.
template
One of the least recognized, but most powerful features of the Web Components specification is the template element. Despite the fact that the template element is well supported on modern browsers since 2013, only 0.5% of the pages were using it in 2021. In terms of popularity, it didn’t even make it into the top 50 elements. We thought this speaks volumes about the adoption curve of the modern HTML specification for web developers.
In case you don’t really know what template does, here is a refresher from the specification: “the template element is used to declare fragments of HTML that can be cloned and inserted in the document by script”. If you’re a web developer and think that sounds familiar, you’re right. Most of the popular frameworks today have a similar non-native mechanism to do the same: Angular has ng-content, React has portals and Vue has slot. We would have thought those frameworks would use the native template element or Web Components instead of re-creating the functionality within the frameworks.
style
style element.
When creating a web page, three things come together. One is HTML, and we’re looking at that throughout this chapter. The second one is JavaScript, and we saw in the previous section that the script element used to load JavaScript is one of the most popular ones. It doesn’t come as a shock that the style element, used to inline CSS is similarly popular. 83.8% of the mobile pages scanned had at least one style element.
In terms of sheer popularity on a page, it barely made it into the top 20, with 0.7%. That leaves us to believe that while multiple script elements are popular on a page, most have five times fewer style elements on them. And that makes sense. Because script elements can be used for both inline and external scripts, but CSS uses a separate element, the link element, for loading external stylesheets. The link element is present on slightly more pages than the script element, while being slightly less popular in terms of the number of occurrences.
Custom elements
We’ve also looked at elements that didn’t show up in the HTML or SVG spec, be it current or obsolete, to determine what custom elements were out there in the wild.
| Element | Number of pages | Percent of pages |
|---|---|---|
rs-module-wrap |
123,189 | 2.0% |
wix-image |
76,138 | 1.2% |
pages-css |
75,539 | 1.2% |
router-outlet |
35,851 | 0.6% |
next-route-announcer |
9,002 | 0.1% |
app-header |
7,844 | 0.1% |
ng-component |
3,714 | 0.1% |
By far, the most popular one is Slider Revolution, with a majority of elements attributed to the framework. It more than tripled in popularity over the past year, which leads us to believe it might be a part of a popular template or site builder. A close second is Wix, the popular free site builder. We initially couldn’t identify pages-css, but Alon Kochba reached out and identified it as another custom element used by Wix, which also explains the similar page count to wix-image.
We would have thought that popular frameworks like Angular, Next.js, or the former Angular.js would account for more custom components, but router-outlet and ng-component make up a small part of the custom component base.
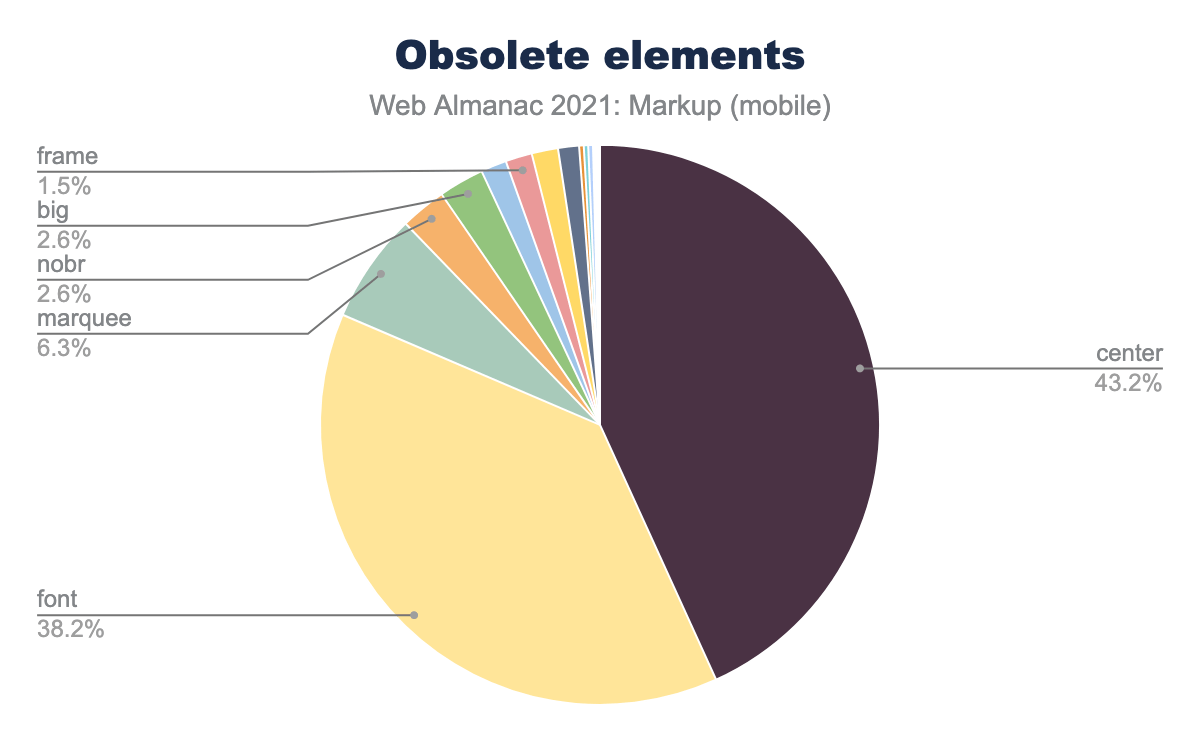
Obsolete elements
There are currently 28 obsolete and deprecated elements described in the HTML reference. We wanted to see how many of those were still in use today. By far, the most used ones are center and font, and we’re glad to see their usage has slightly declined when compared with last year.
nobr and big on the other hand, while still being deprecated, have increased in usage slightly when compared with last year.
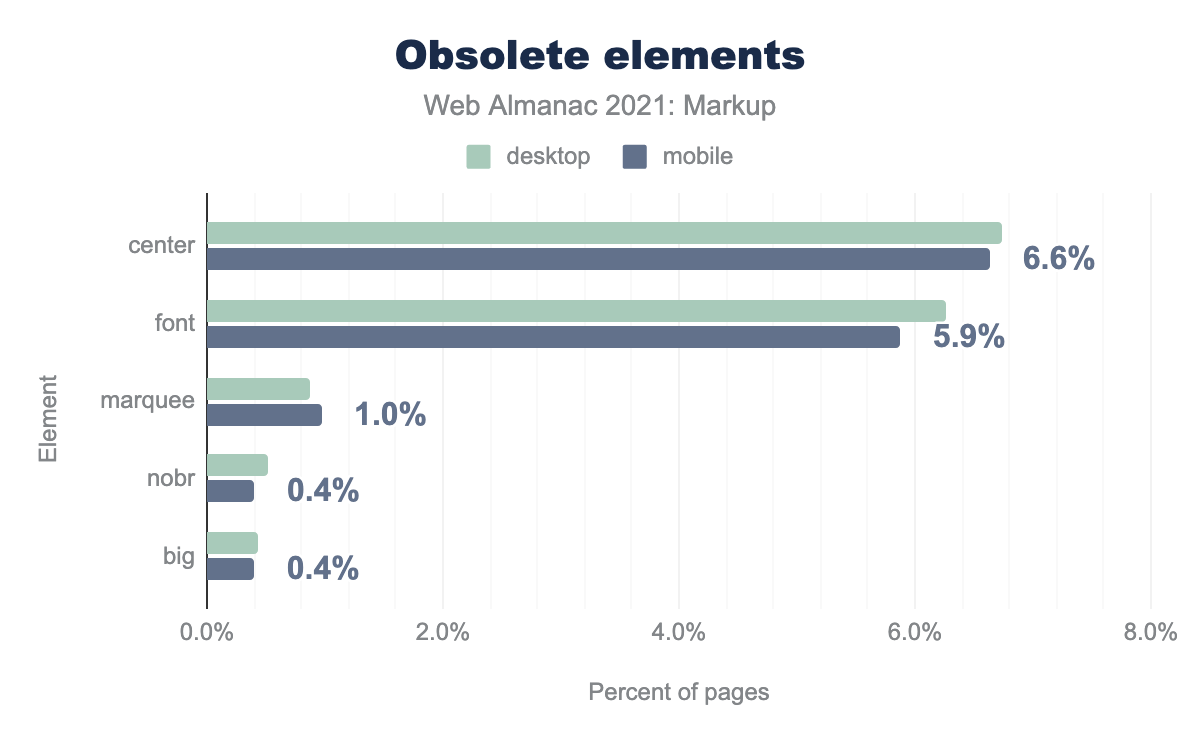
While the percentage of obsolete elements for mobile pages is slightly different when compared with desktop, the order remains the same.
Google still uses a center element on their home page in 2021, but we’re not going to judge.
Proprietary and non-standard elements
While custom elements all have a hyphen in them, we’ve also encountered elements that are made up, don’t have a hyphen, and don’t show up on the HTML standard.
| Element | Mobile | Desktop |
|---|---|---|
jdiv |
0.8% | 0.8% |
noindex |
0.9% | 0.8% |
mediaelementwrapper |
0.6% | 0.6% |
ymaps |
0.3% | 0.2% |
h7 |
0.1% | 0.1% |
h8 |
<0.1% | <0.1% |
h9 |
<0.1% | <0.1% |
All of them were present last year as well, and can be attributed to popular frameworks or products like JivoChat, Yandex, MediaElement.js, and Yandex Maps. And because some people get carried away, or six is just not enough headers, h7 to h9.
Embedded content
| Element | Desktop | Mobile |
|---|---|---|
iframe |
56.7% | 54.5% |
source |
9.9% | 8.4% |
picture |
6.1% | 6.0% |
object |
1.4% | 2.0% |
param |
0.4% | 0.4% |
embed |
0.4% | 0.4% |
Content can be embedded through multiple elements in a page. The most popular is an iframe, followed at a considerable distance by source and picture.
The actual embed element is the least popular out of all the present elements for embedding content.
Forms
Forms, or ways of getting input from your visitors, are part of the fabric of the web. It’s no surprise that 71.3% of pages on desktop and 67.5% of pages on mobile had at least one form on them. The most common occurrence was one (33.0% on desktop and 31.6% on mobile) or two (17.9% on desktop and 16.8% on mobile) form elements on a page.
form elements found on a single page.
There are also extreme cases with one page having 4,018 form elements on desktop and 4,256 form elements on mobile. We can’t help but wonder what kind of input is so valuable, that you’d have to break it up in 4,000 pieces.
Attributes
Element behaviors are heavily influenced by attributes, so we thought it was only fair we took a look at the attributes used on a page, explore data-* patterns, and some popular social attributes for meta elements.
Top attributes
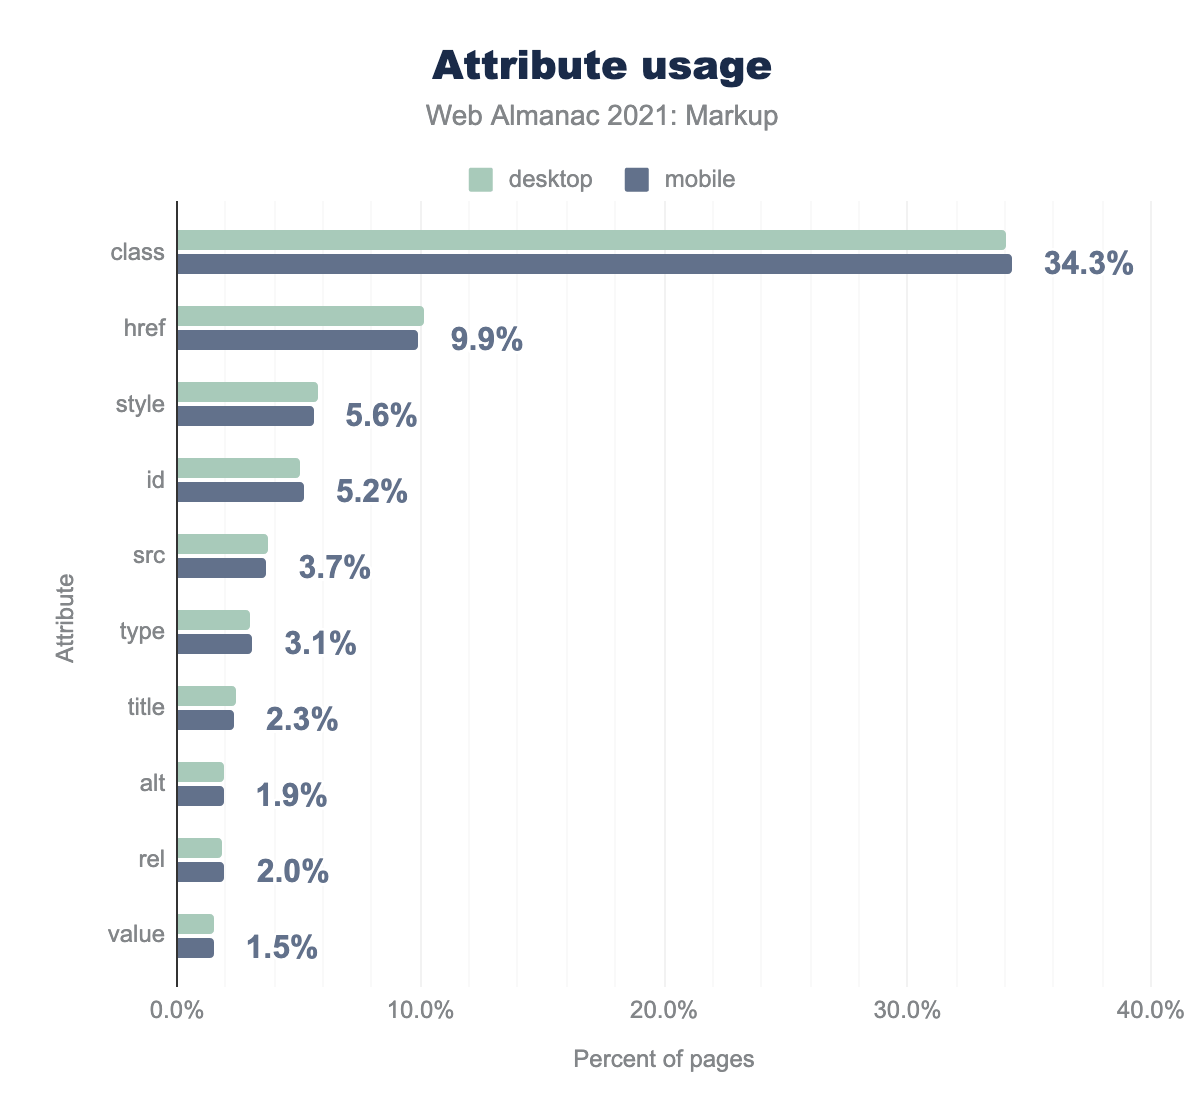
The most popular attribute is class and that’s no surprise, given that it’s used for styling. 34.3% of all the attributes found on the pages we queried were class. By contrast, id was much less used, at 5.2%. It’s interesting to note that the style attribute edged out the id attribute in popularity, accounting for 5.6% of occurrences.
The second most popular attribute is href, with 9.9% of occurrences. With links being part of the fabric of the web, it’s not surprising an anchor element attribute was this popular. What was surprising is that the src attribute was only twice as popular as the alt attribute, despite it being available to considerably more elements.
Meta flavors
meta elements are gaining some of their lost popularity this year, so we wanted to take a closer look at them. They provide a way to add machine-readable information to your pages, as well as perform some nifty HTTP equivalents. For example, setting a Content Security Policy for a page:
<meta http-equiv="Content-Security-Policy" content="default-src 'self'; img-src https://*;">From the available attributes, name (paired with content) was the most popular. 14.2% of the meta elements did not have a name attribute. In conjunction with the content attribute, they are used as a key-value pair for passing in information. What information, you ask?
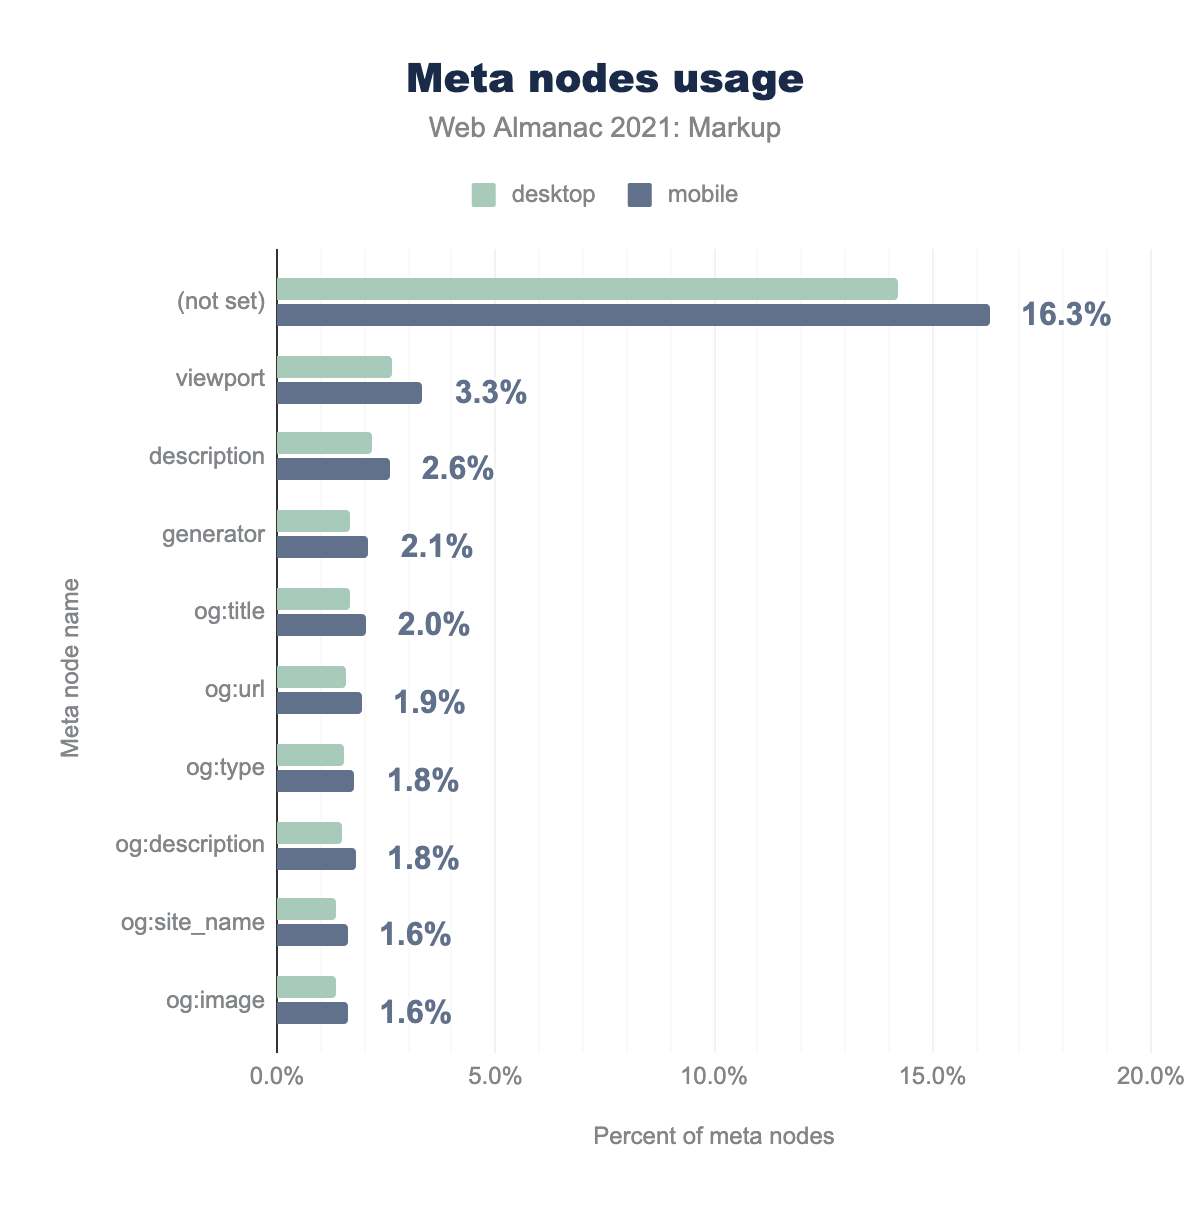
meta node names.
meta viewports having a value of initial-scale=1,width=device-width.
The most popular is viewport information, with the most popular viewport value being initial-scale=1,width=device-width. 45.0% of mobile pages scanned used that value.
The second most popular combination are og:* meta elements, also known as Open Graph meta elements. We’ll talk about those in the next section.
Social markup
Providing information and assets for social platforms to use when previewing links to your page is a popular use case for the meta element.
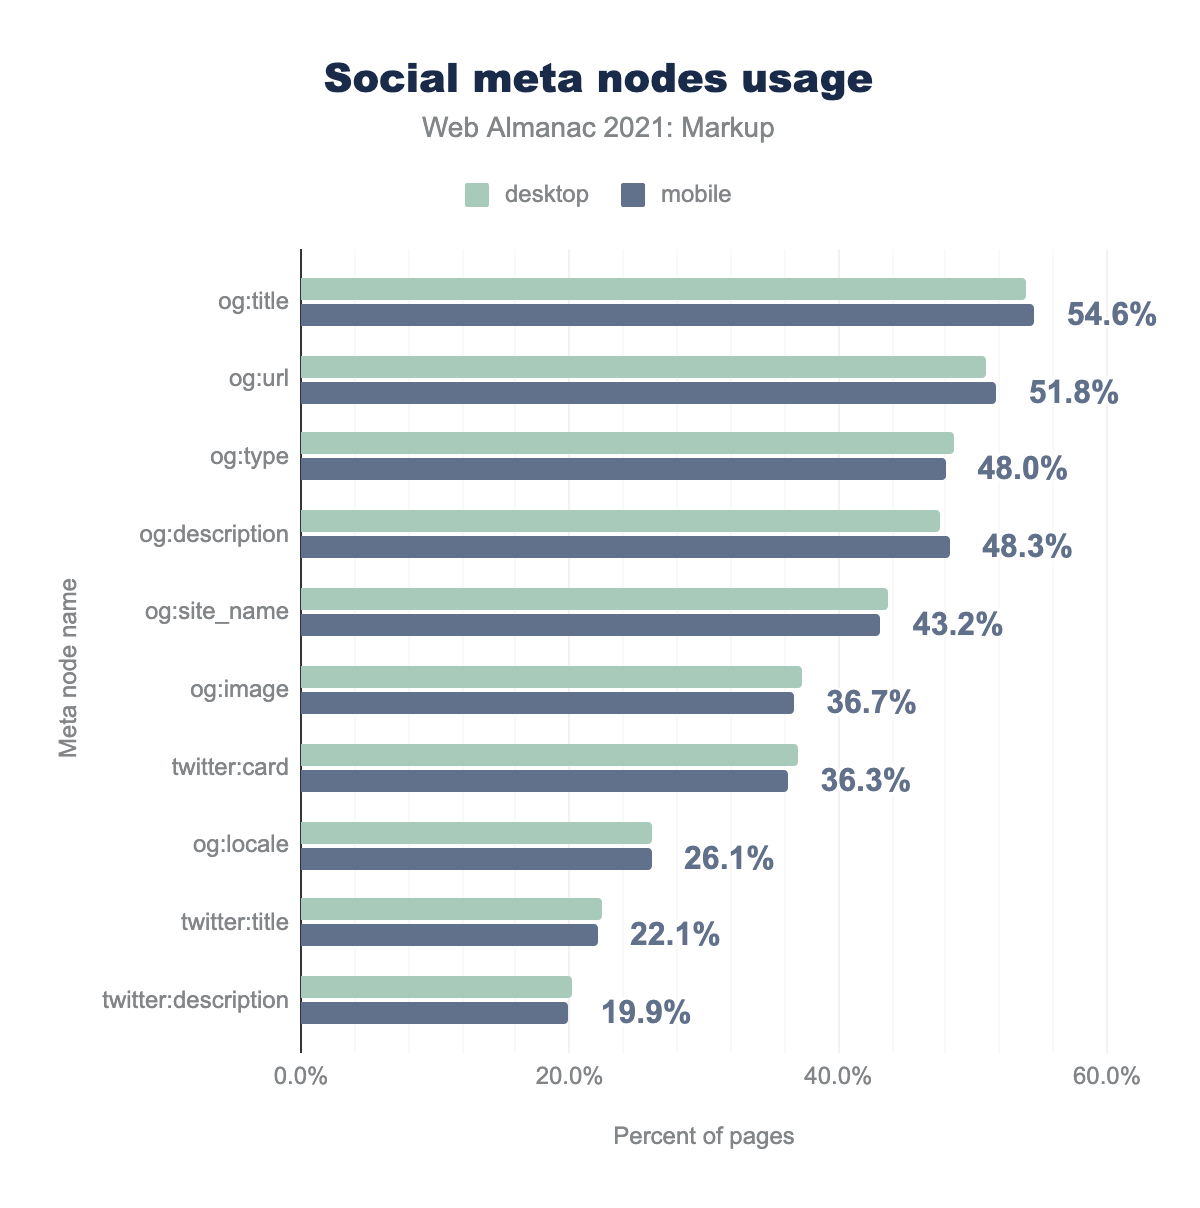
meta nodes usage by page.
The most common by far are the Open Graph meta elements, used across multiple networks, with Twitter-specific elements lagging behind. og:title, og:type, og:image, and og:url are all required for every page, so it’s interesting that there is a variation in their usage numbers.
data- attributes
The HTML specification allows for custom attributes, prefixed by data-. They are intended to store custom data, state, annotations, and the like, private to the page or application, for which there are no more appropriate attributes or elements.
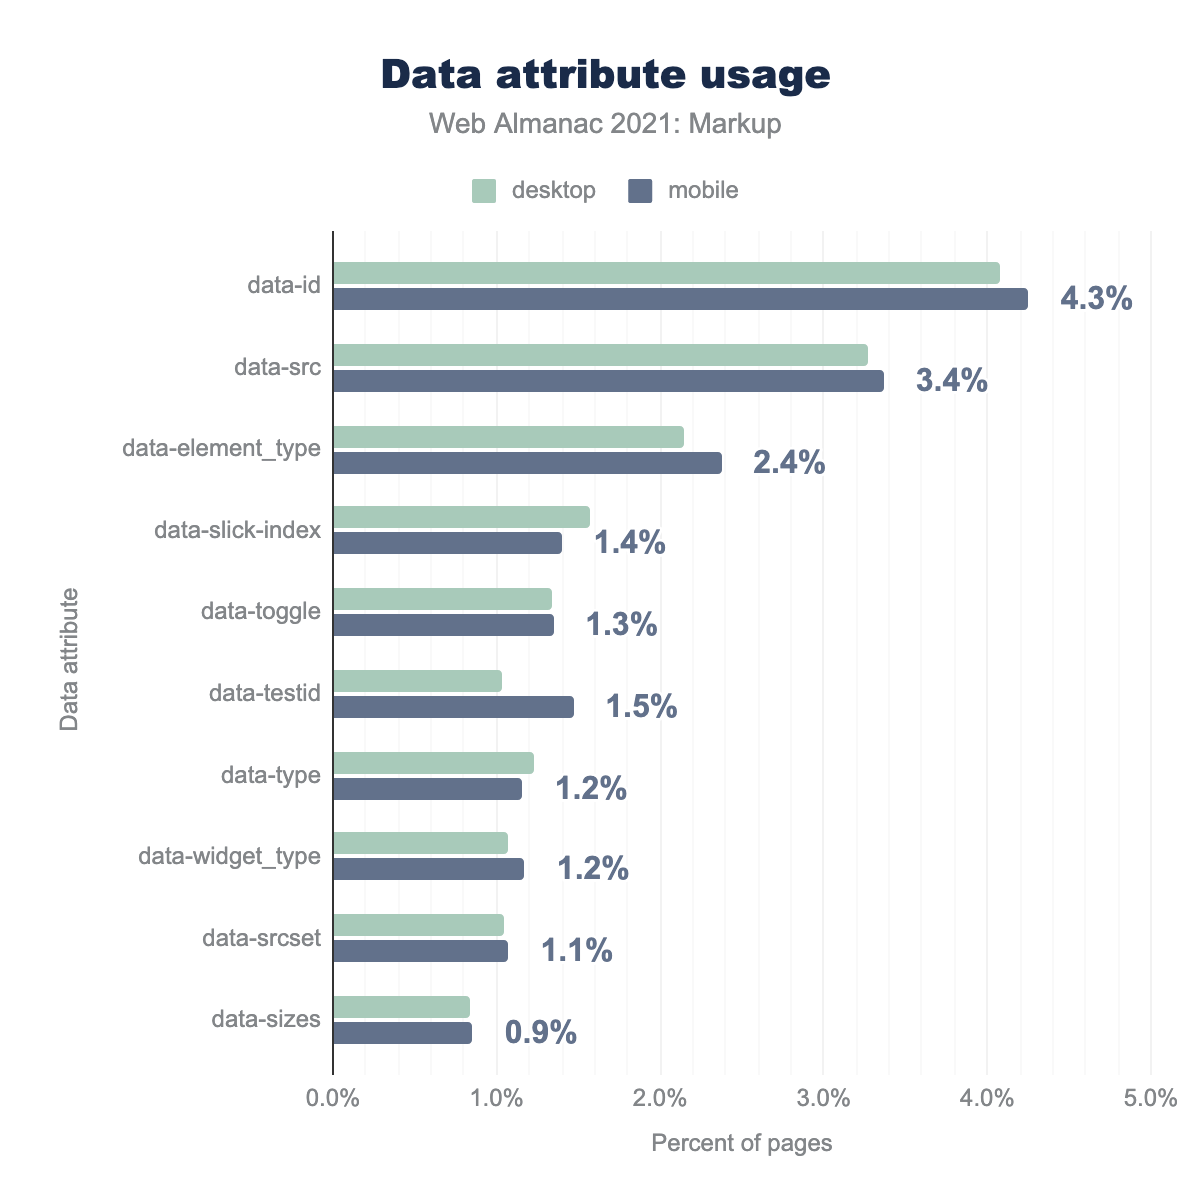
data- attributes.
The most common ones, data-id, data-src, and data-type are non-specific, with data-src, data-srcset, and data-sizes being very popular with image lazy-loading libraries. data-element_type and data-widget_type are coming from a popular website builder, Elementor.
Slick, “the last carousel you’ll ever need”, is responsible for data-slick-index. Popular frameworks like Bootstrap are responsible for data-toggle, while testing-library is responsible for data-testid.
Miscellaneous
We’ve covered a good chunk of the most common HTML use cases. We’ve set aside this section at the end to look into some of the more esoteric use cases, as well as adoption of new standards on the web.
viewport specifications
The viewport meta element is used to control layout on mobile devices. Or at least that was the idea when it came out. Today, some browsers have started to ignore some of the viewport options to allow for zooming a page up to 500%.
| Attribute | Desktop | Mobile |
|---|---|---|
initial-scale=1,width=device-width |
46.6% | 45.0% |
| (empty) | 12.8% | 8.2% |
initial-scale=1,maximum-scale=1,width=device-width |
5.3% | 5.6% |
initial-scale=1,maximum-scale=1,user-scalable=no,width=device-width |
4.6% | 5.4% |
initial-scale=1,maximum-scale=1,user-scalable=0,width=device-width |
4.0% | 4.3% |
initial-scale=1,shrink-to-fit=no,width=device-width |
3.9% | 3.8% |
width=device-width |
3.3% | 3.5% |
initial-scale=1,maximum-scale=1,minimum-scale=1,user-scalable=no,width=device-width |
1.9% | 2.5% |
initial-scale=1,user-scalable=no,width=device-width |
1.89% | 1.9% |
meta viewport values.
The most common viewport content option is initial-scale=1,width=device-width, which is not surprising when it’s the recommended option on the MDN guide explaining viewports. 45.0% of the pages analyzed are using it, almost 3% more than last year. 8.2% of pages had an empty content attribute, slightly more than last year as well. That correlates with a decrease in usage for improper combinations of viewport options.
Favicons
Favicons are one of the most resilient pieces of the web. They work even without markup and accept multiple image formats. There are also literally dozens of sizes you need to use to be thorough.
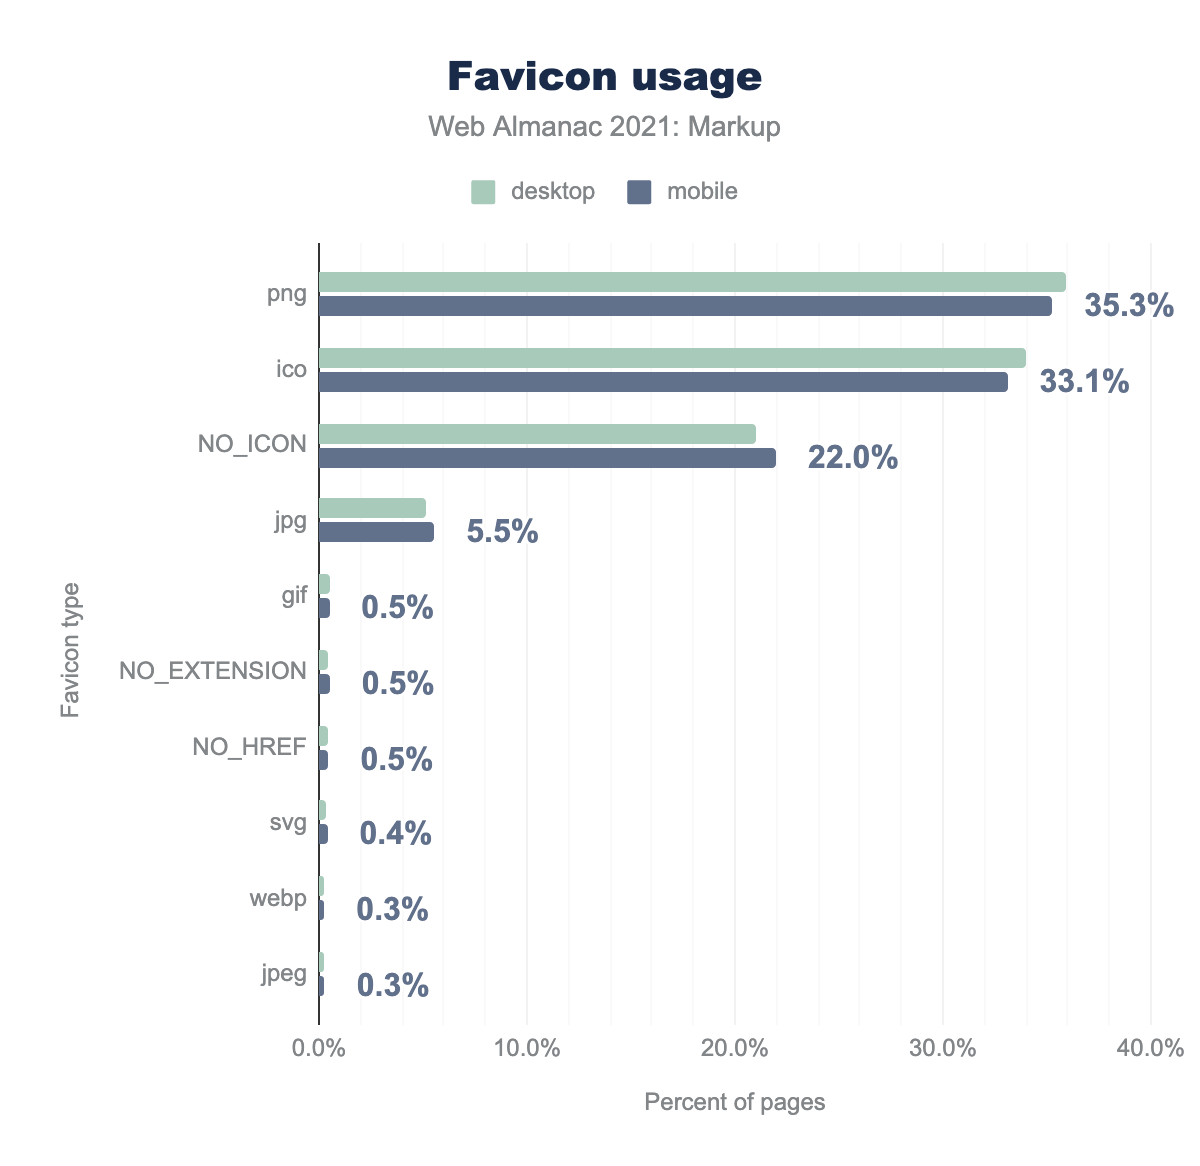
There were a few surprises when we looked at the data:
- ICO was finally dethroned as the most popular format by PNG.
- JPG is still used, even though it’s not the best option when compared with some of the other unpopular options.
- With SVG support for favicons finally improving, SVG has overtaken WebP this year in terms of popularity.
Button and input types
button element.
Buttons are controversial. There are a lot of opinions about what does and what doesn’t constitute a button on the web. While we’re not taking sides, we thought we should look at some of the semantic ways to specify a button element, seeing as how 65.5% of pages already had a button element on them.
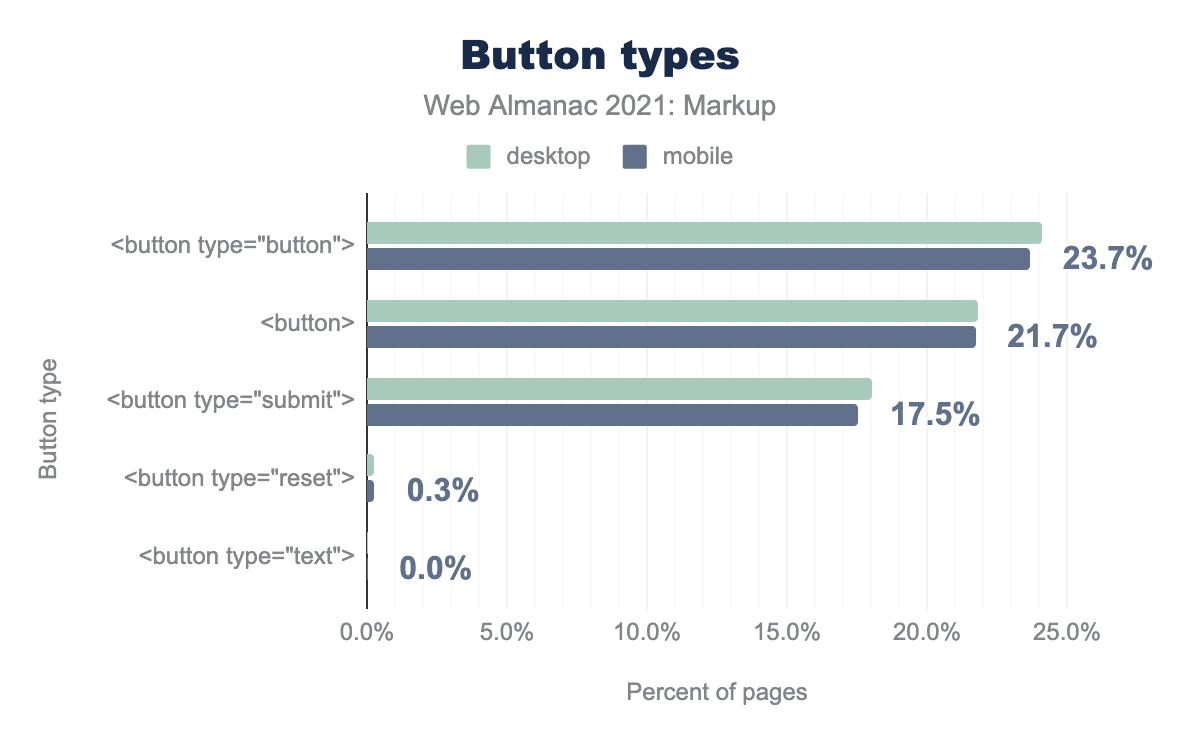
When we compared the data to last year, we noticed a lot more pages had button elements on them. This year we didn’t run a query for input-typed buttons, but we’ve seen a definite decrease in usage for the number of button elements on pages. The Accessibility chapter also has a whole section on buttons, you should read that as well!
Links
| Link | Desktop | Mobile |
|---|---|---|
Always uses target="_blank" with noopener and noreferrer |
22.0% | 23.2% |
Sometimes uses target="_blank" with noopener and noreferrer |
78.0% | 76.8% |
Has target="_blank" |
81.2% | 79.9% |
Has target="_blank" with noopener and noreferrer |
14.3% | 13.2% |
Has target="_blank" with noopener |
21.2% | 20.1% |
Has target="_blank" with noreferrer |
1.2% | 1.1% |
Has target="_blank" without noopener and noreferrer |
71.1% | 69.9% |
Links are the glue that ties the web together. Normally, we wanted to look at the instances where they are proving problematic. Using target="_blank" without noopener and noreferrer was a security vulnerability for the longest time, but 71.1% of desktop pages and 68.9% of mobile pages still use it today.
That’s what probably prompted a spec change this year, so now browsers set rel="noopener" by default on all target="_blank" links.
Web Monetization
Web Monetization is being proposed as a W3C standard at the Web Platform Incubator Community Group (WICG). It’s a young standard that provides an open, native, efficient, and automatic way to compensate creators, pay for API calls, and support crucial web infrastructure. While it is in its early days, and it is not implemented by any of the major browsers, it is supported via forks and extensions, and has been instrumented in Chromium and the HTTP Archive dataset for over a year. We wanted to take a look at adoption so far.
Web Monetization popularly uses a meta element on the page, specifying the wallet address for the money to be paid into. It looks a little bit like:
<meta name="monetization" content="$wallet.example.com/alice">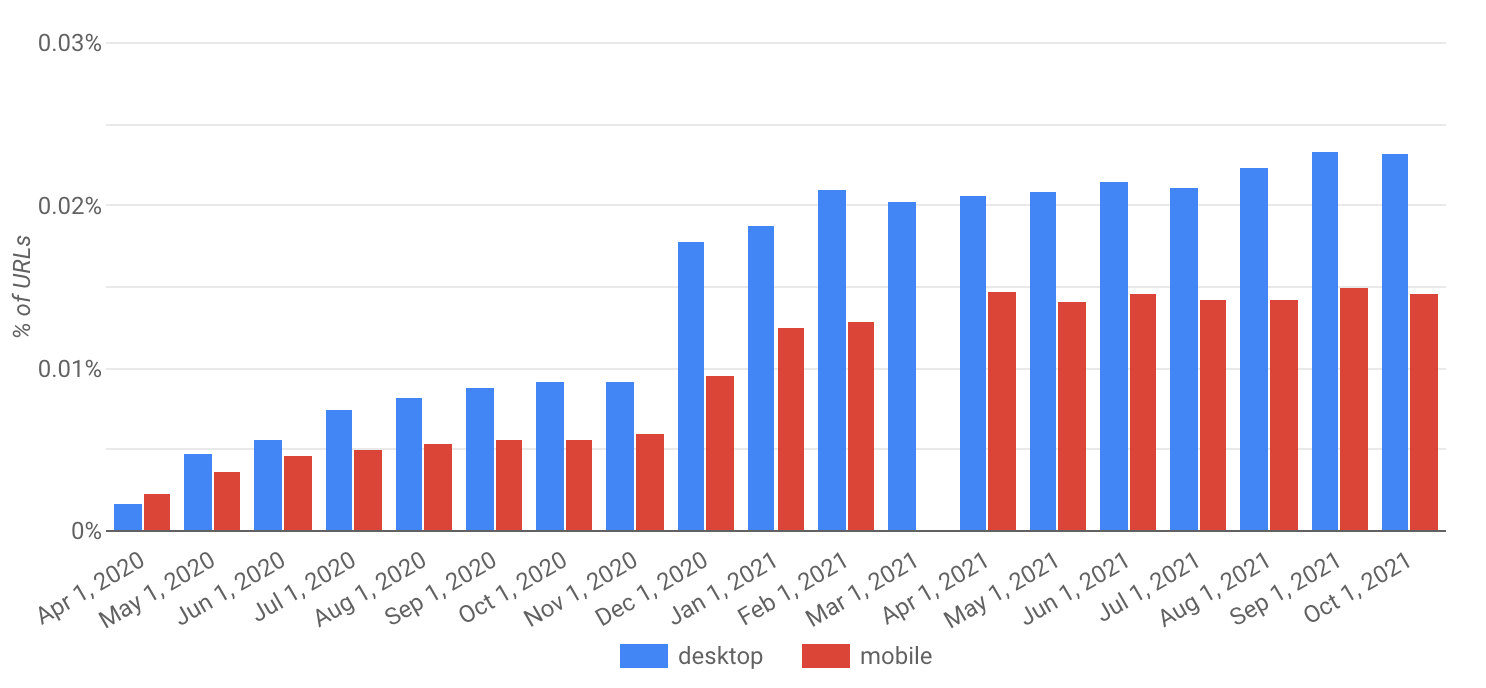
While it still seems a vanishingly small number by percentages, it has shown growth—more on desktop than mobile. It’s important to keep in mind how big the HTTP Archive dataset is and how slowly it takes to gain numbers, even for a feature that is widely and natively supported. It will be interesting to continue to track these numbers and developments over more time. This author might be biased, as an editor for the Web Monetization standard, but you’re encouraged to give it a try, it’s free.
There has been an issue open for some time, and the new version of the specification will use a link instead. Only 36 pages in our desktop set and 37 in our mobile set used the link version, and all of those also included the meta version as well.
We know there are currently two Interledger-enabled wallet providers in the ecosystem, so we wanted to see the distribution and adoption of those wallets.
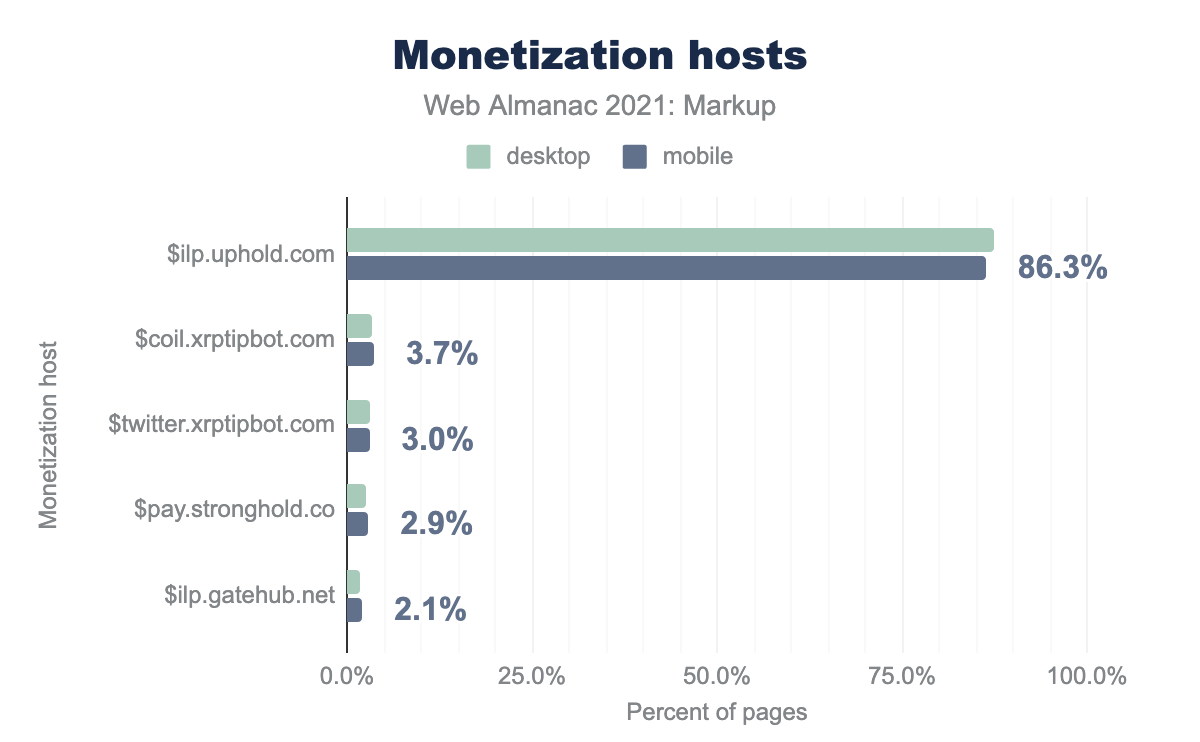
Uphold and Gatehub are the current wallets, and it looks like Uphold is the dominant wallet by far. What is curious, a wallet that was deprecated this year, Stronghold, was more popular than an active wallet provider, Gatehub. We thought that speaks towards the rate at which web developers update their web sites.
Conclusion
We’ve pointed out interesting, surprising, and concerning bits of data throughout the chapter. Let us reflect once more on the state of markup in 2021.
The most surprising for us was that, almost 20 years later, XHTML was still used on a considerable part of the web, with a little over 7% of pages using it in 2021.
The median page sizes in 2020 were shrinking when compared to 2019, but this year it looks like the trend has regressed, surpassing the median sizes for 2019 as well. The web is getting heavier. Again.
English is relatively less popular on mobile pages. We’re not sure why, and this author would like to encourage you to explore the possibilities of why this is the case.
It was interesting to see that libraries adopting better practices correlated directly with elements falling out of favor. Both i and option are less-used this year because icon libraries have switched over to using SVG.
It was great to see ICO finally being dethroned as the most popular favicon format in favor of PNG. Similarly, seeing SVG more than doubling in usage for favicons in the past year made us think we’re 10 years away from dethroning PNG.
The doctype percentage has increased steadily by half a percentage point every year. At this rate, we’ll live in an ideal world where every page has a doctype by 2027.
It was concerning for this author to see that the adoption of some of the newer standards is slow, sometimes on a 10-year cycle, and that web pages don’t get updated as often as we’d like.
With that in mind, I’ll leave you to reflect on the state of the web in 2021. I’d also encourage you to be part of the people who increase adoption of new standards every year. Start with something new you’ve learned today, one of the many standards we’ve covered not only in this chapter but in this whole Web Almanac publication.
