CMS

Introduction
In this chapter, we seek to help understand the current state of the CMS ecosystems and the growing role they play in shaping users’ perception of how content can be consumed and experienced on the web. Our goal is to discuss aspects related to the CMS landscape in general, and the characteristics of web pages generated by these systems.
There are many interesting and important aspects to analyze and questions to answer in our quest to understand the CMS space and its role in the present and the future of the web. We acknowledge the vastness and complexity of the CMS platform space and bring to it our curiosity along with deep expertise on some of the major players in the space.
These platforms play a key role for us to succeed in our collective quest for a fast and resilient web. This has become increasingly apparent in the past year, and we expect it to continue to be the case going forward.
It is important to take some of these comparisons with a grain of salt, considering the variability between CMSs, and the differing types of user content which are built on these platforms.
In some of the sections, we focus only on the top CMSs in terms of adoption, due to the large number of CMS platforms.
TLDR; We discover that almost half of all the sites in the world are created using a CMS. While the top 10 most popular CMS list remains relatively stable year-over-year, there are some interesting changes in market share. The performance of CMS-built sites has improved dramatically since the last time we checked.
Let’s dive into our analysis.
What is a CMS?
The term Content Management System (CMS) refers to systems enabling individuals and organizations to create, manage, and publish content. A CMS for web content, specifically, is a system aimed at creating, managing, and publishing content to be consumed and experienced via the web.
Each CMS implements some subset of a wide range of content management capabilities and the corresponding mechanisms for users to build websites easily and effectively around their content. CMSs also provide administrative capabilities aimed at making it easy for users to upload and manage content as needed.
There is great variability in the type and scope of the support CMSs provide for building sites; some provide ready-to-use templates which are supplemented with user content, and others require much more user involvement for designing and constructing the site structure.
When we think about CMSs, we need to account for all the components that play a role in the viability of such a system for providing a platform for publishing content on the web. All of these components form an ecosystem surrounding the CMS platform, and they include hosting providers, extension developers, development agencies, site builders, etc. Thus, when we talk about a CMS, we usually refer to both the platform itself and its surrounding ecosystem.
Our definition of a CMS in this chapter uses Wappalyzer’s definition of a CMS.
We encourage CMSs to contribute to this open-source project to improve detection and classification in the future.
Shopify, Magento, Webflow, and some other platforms do not appear in this chapter’s analysis, because they are not marked as a CMS in Wappalyzer.
Ecommerce platforms make a substantial part of non-CMS sites and are covered in the Ecommerce chapter. For example, Shopify grew substantially in the past year and accounted for 3.7% of websites in July according to W3Techs.
Our research identified over 200 individual CMSs, with these ranging from a single install to millions on a single CMS.
Some of them are open source (e.g., WordPress and Joomla) and some of them are proprietary (e.g., Wix and Squarespace). Some CMS platforms can be used on “free” hosted or self-hosted plans, and there are also options for using these platforms on higher-tiered plans even at the enterprise level.
The CMS space as a whole is a complex, federated universe of CMS ecosystems, all separated and at the same time intertwined.
CMS adoption
Our analysis throughout this work looks at desktop and mobile websites. The vast majority of URLs we looked at are in both datasets, but some URLs are only accessed by desktop or mobile devices. This can cause small divergences in the data, and we thus look at desktop and mobile results separately.
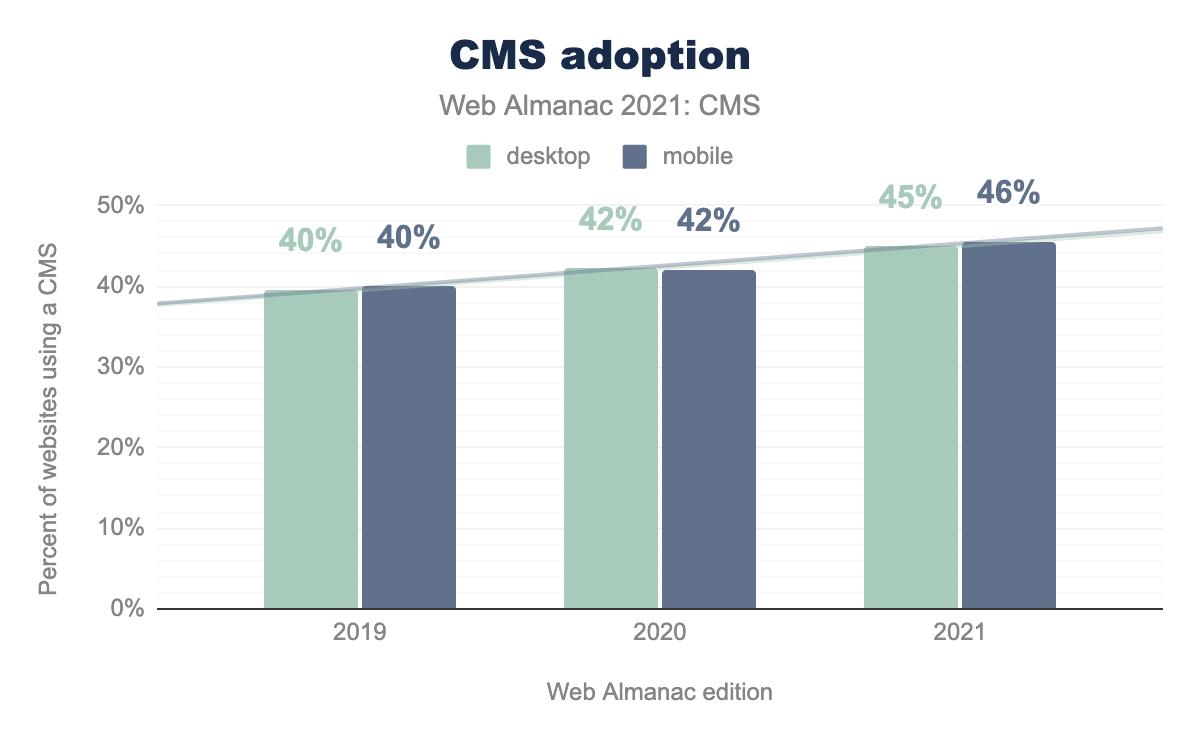
As of July 2021, over 45% of public websites are powered by a CMS platform, indicating growth of over 7% from 2020. This breaks down to 45% on desktop, up from 42% in 2019, and 46% on mobile, up from 42% in 2020.
It is interesting to compare these numbers with another commonly used dataset, such as W3Techs, which reported that as of July 2021, 64.6% of websites are created using a CMS, up from 59.2% in July 2020, which is an increase of over 9%.
The deviation between our analysis and W3Techs’ analysis can be explained by a difference in research methodologies, and the definition of what is a CMS.
W3Techs definition is the following: “Content Management Systems are applications for creating and managing the content of a website. We include all such systems in this category, also systems that are often classified as wikis, blog engines, discussion boards, static site generators, website editors or any type of software that provides website content.”
As mentioned previously, Wappalyzer has a stricter definition of a CMS, which excludes some major CMSs which appear in W3Techs reports.
You can read more about ours on the Methodology page.
CMS adoption by geography
CMS platforms are extensively used around the world, with some variance by country.
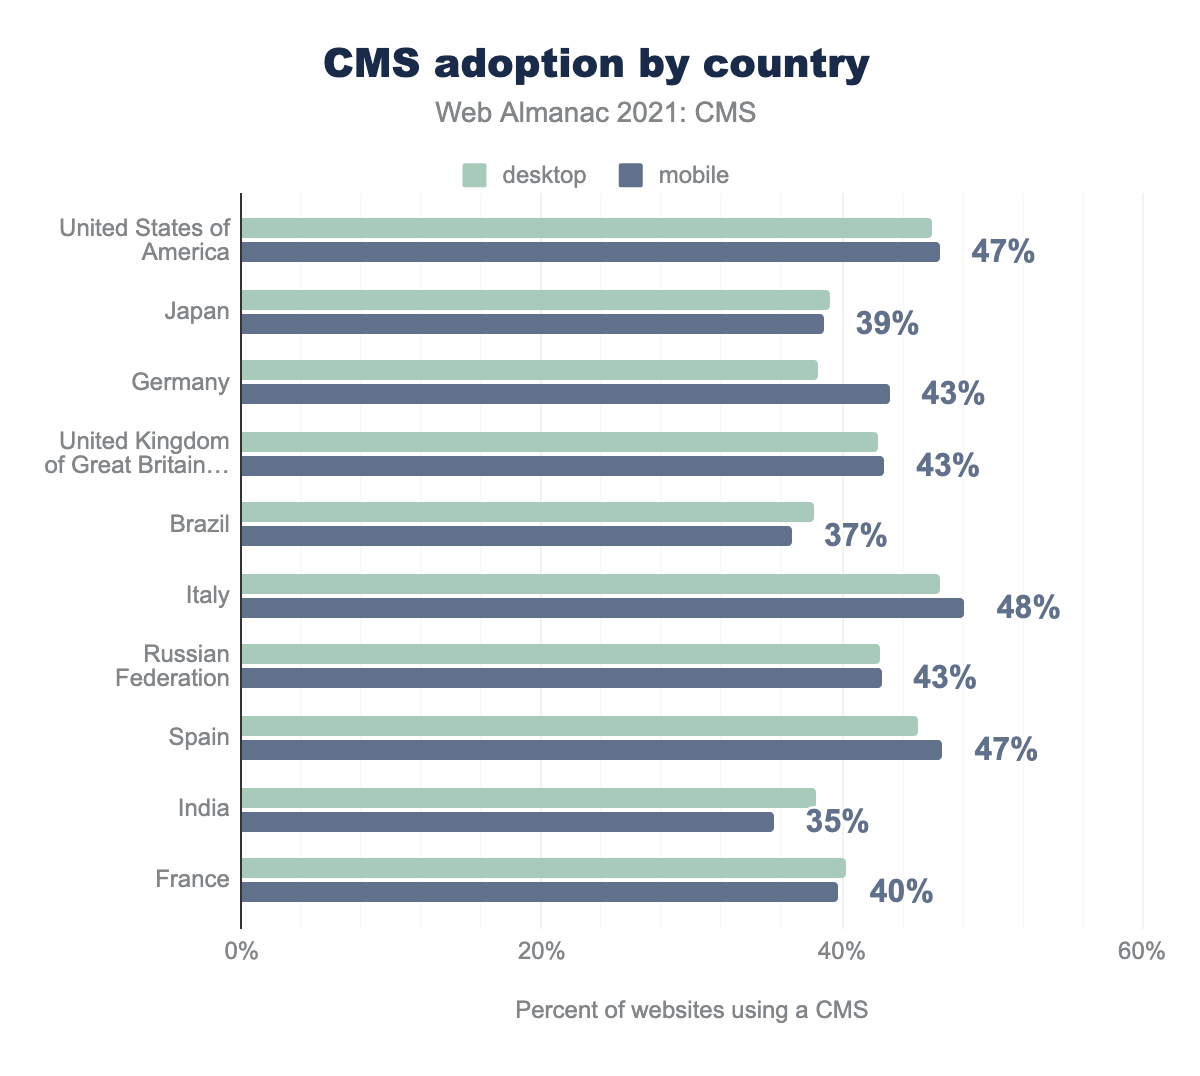
Among the geographies with the highest number of websites, CMS adoption percentage is the highest in the US, Italy, and Spain, where 46%–47% of mobile sites visited by users are built with a CMS. India and Brazil have the lowest adoption with only 35% and 37%.
We can also split this data into subregions around the globe, sorted by the most popular regions, to better identify macro-trends:
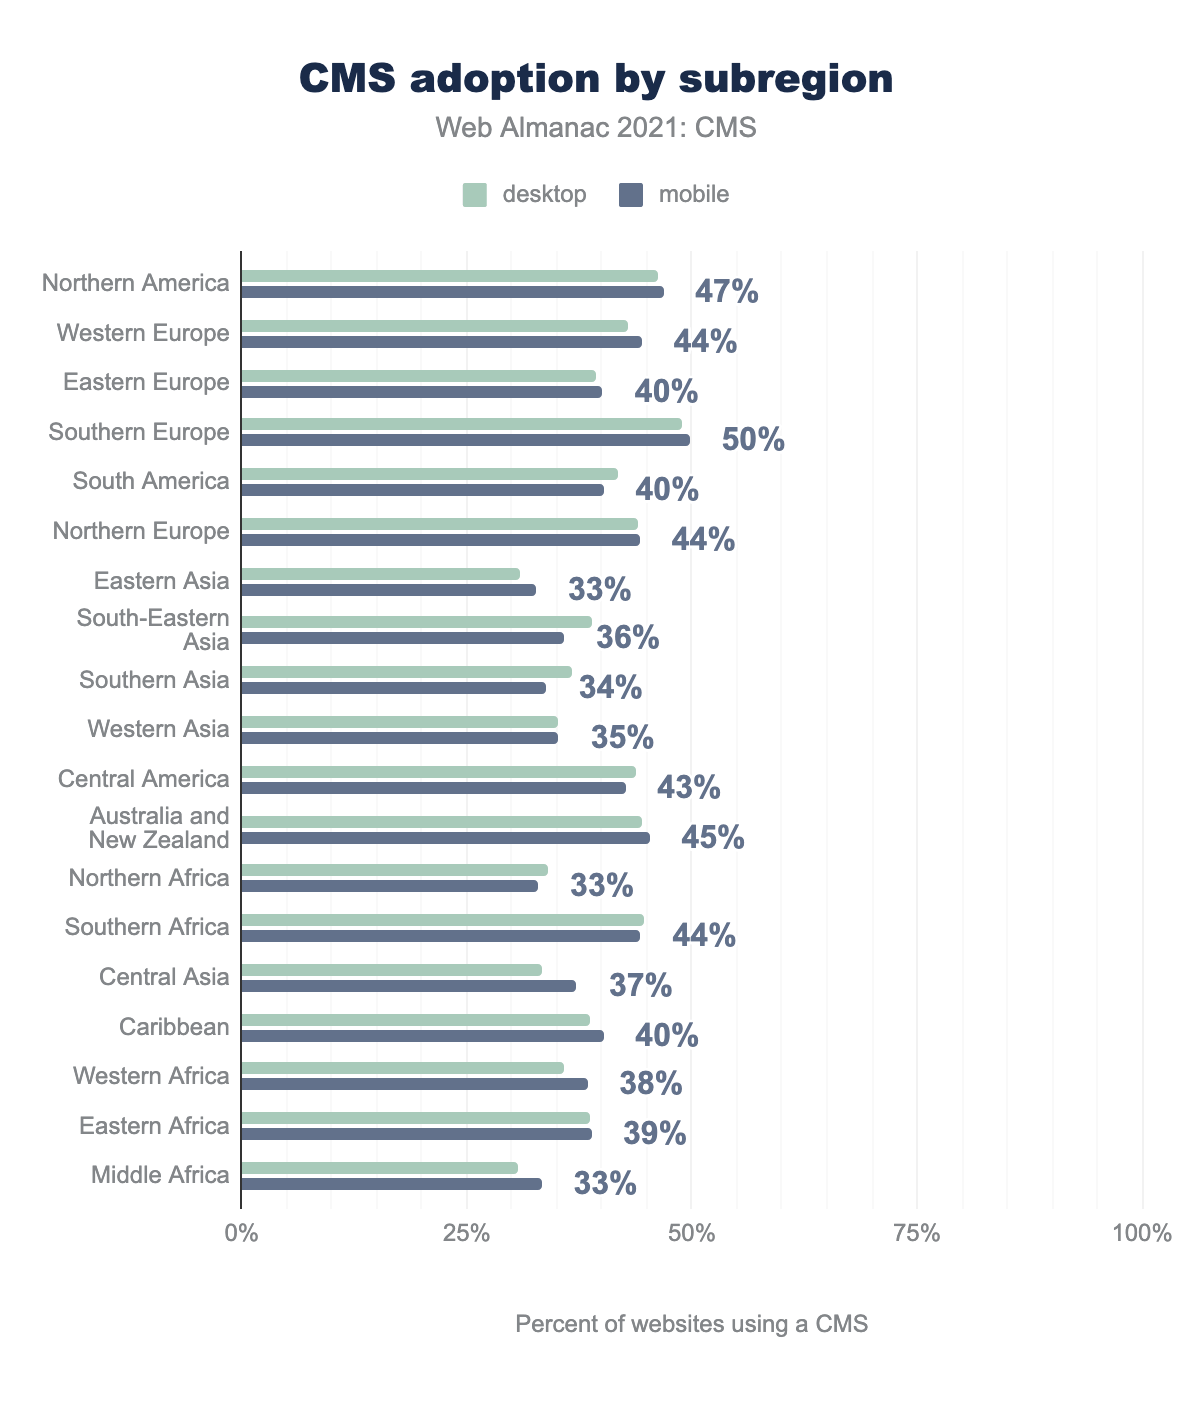
Adoption is highest in Southern Europe where half of the sites are using a CMS, and lowest in Eastern Asia where only a third of sites in our dataset use a CMS.
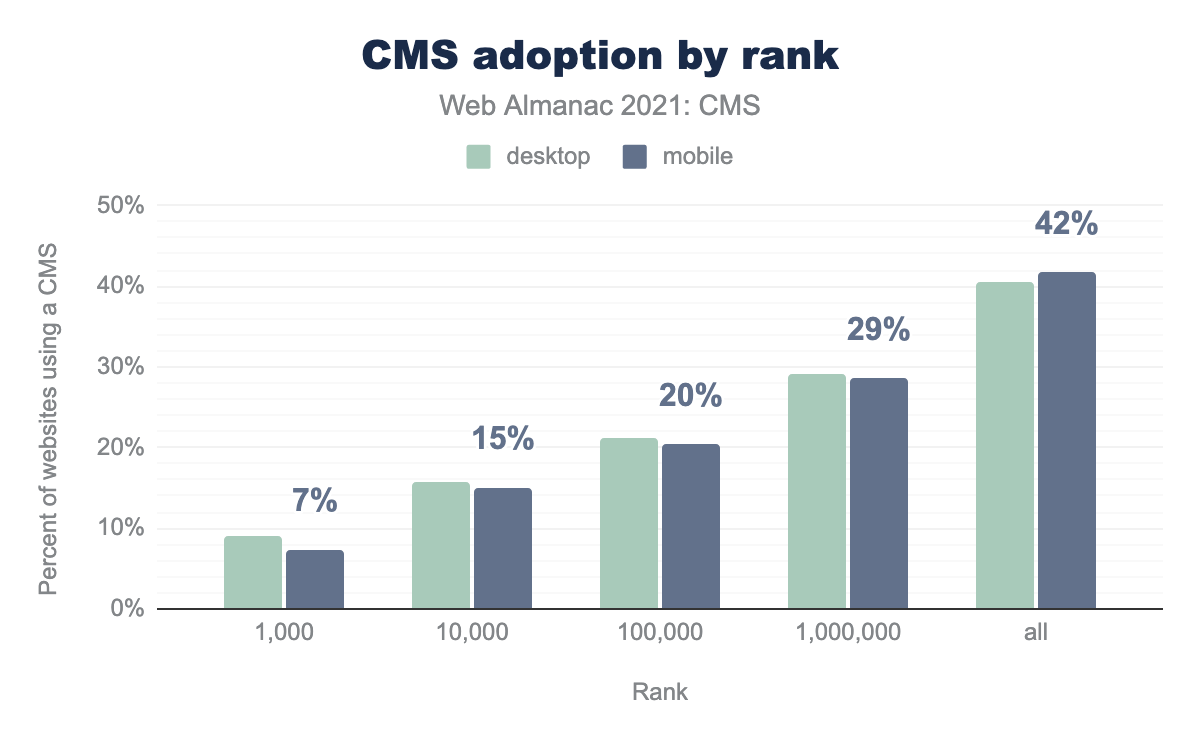
CMS adoption by rank
We also examined CMS adoption by the estimated rank of the sites.
CMSs account for only 7% of the top 1,000 mobile websites, compared to 42% of the complete dataset of all sites in our analysis. This can be explained by the fact that smaller businesses and websites tend to use a CMS due to the ease of use, and the higher ranked websites tend to be built with proprietary solutions by professional web developers. With the continuing growth in usage of CMS platforms, it would be interesting to see if CMS platforms will also be able to increase adoption rates among the higher-ranking sites in the coming years.
Top CMSs
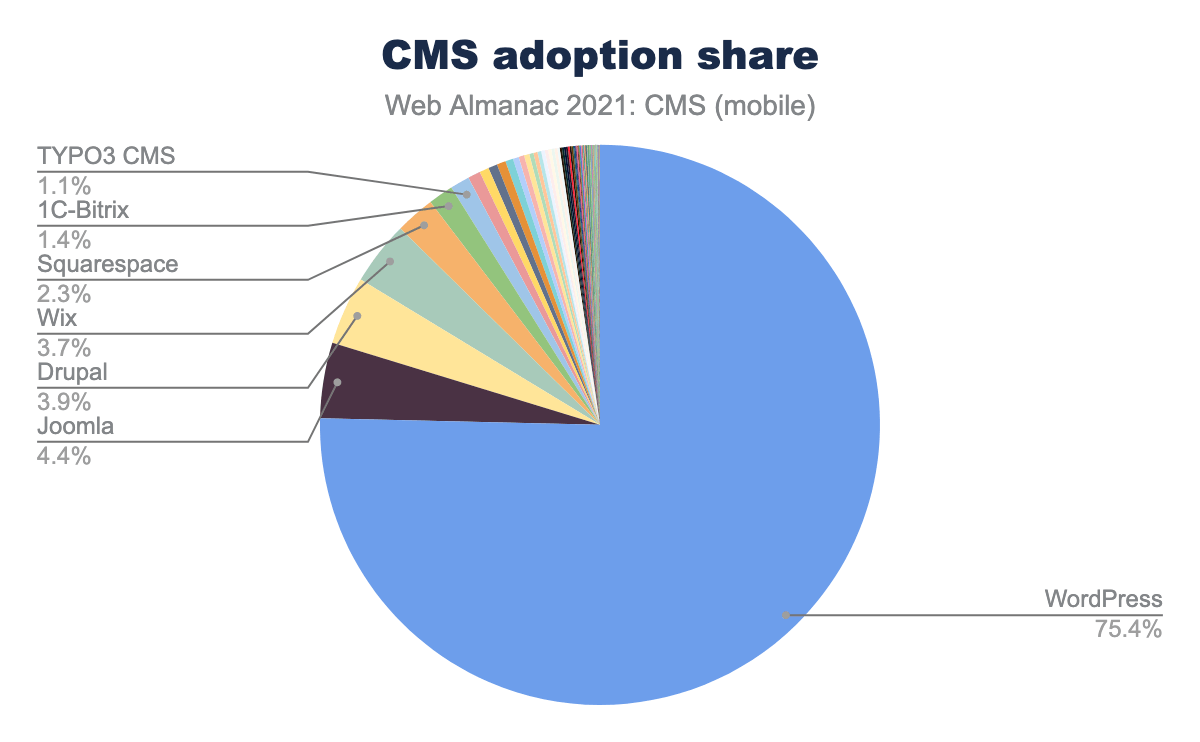
Among all websites that use a CMS, WordPress sites account for a large part of the relative market share, with over 75% adoption, followed by Joomla, Drupal, Wix, and Squarespace.
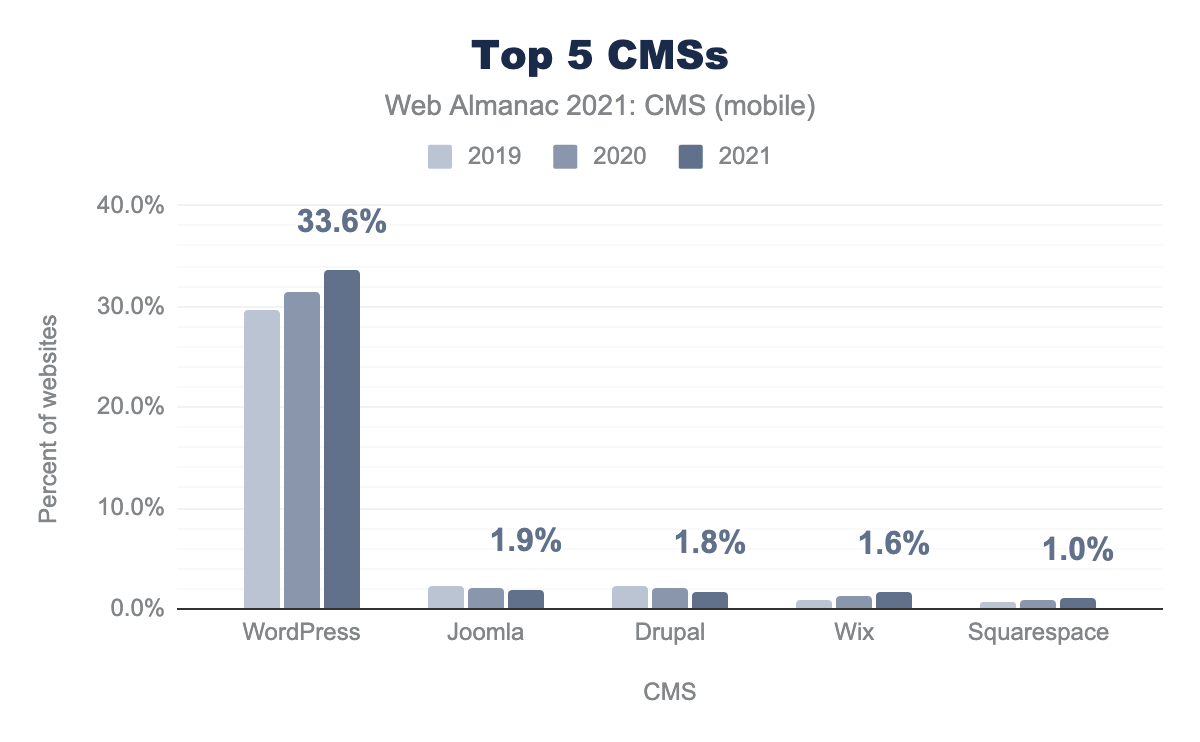
Drilling into the adoption by CMS across all websites, out of 218 different CMS platforms only 5 platforms had over 1% of usage.
WordPress, the most commonly used platform, is used by 33.6% of these websites, up from 31.4% in 2020, a 7% increase in total adoption.
In percentage terms, Joomla and Drupal adoption is dropping–Joomla sites accounted for 1.9% of websites, down from 2.1% last year (9.5% decrease), and Drupal dropped from 2% to 1.8% (10% decrease). Absolute adoption did increase in terms of number of sites measured, but as a percentage of both overall CMS usage and of our (ever increasing!) data set, it is smaller.
Wix adoption grew from 1.2% to 1.6% (33% increase) and Squarespace grew from 0.9% to 1% (11% increase).
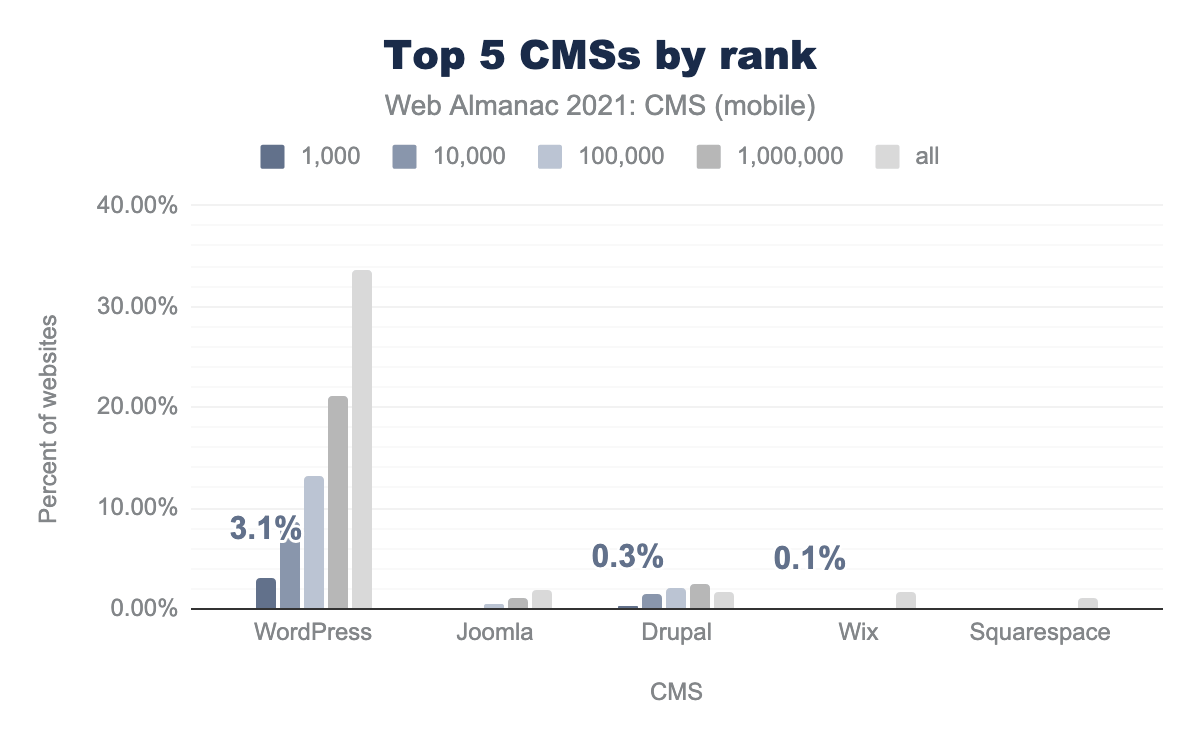
Examining the adoption of these sites built on CMS platforms by their rank magnitude reveals an interesting distribution between platforms.
3.1% of mobile sites in the top 1K are built with WordPress, and 33.6% of all sites. Drupal maintains a higher adoption rate within the mid-ranged rankings (10K–1M), while most of Wix and Squarespace sites are ranked outside the top 1M sites.
CMS user experience
An important aspect of CMSs is the user experience they provide, for users visiting sites built on these platforms. We attempt to examine these experiences through Real User Measurements (RUM), provided by the Chrome User Experience Report (CrUX), and synthetic testing using Lighthouse.
Core Web Vitals
2021 was a great year for web performance, with a growing focus on Core Web Vitals, which helped nudge many platforms in the right direction to focus on improving their user experience and loading times. More importantly, it provides users with the right tools and guidance to monitor and improve their website performance. As a result, we saw large performance improvements from many platforms, which continue to evolve, gradually making user experience better across the web, which is a big win for all of us.
The Core Web Vitals Technology Report can be used to drill into this data and view the progress of each technology updated on a monthly basis.
In this section we focused on data from July 2021 to provide a consistent timeframe for data presented across the Web Almanac, and examined three important factors provided by the Chrome User Experience Report, which can shed light on our understanding of how users are experiencing CMS-powered web pages in the wild:
- Largest Contentful Paint (LCP)
- First Input Delay (FID)
- Cumulative Layout Shift (CLS)
These metrics aim to cover the core elements which are indicative of a great web user experience. The Performance chapter covers these in more detail, but here we are interested in looking at these metrics specifically in terms of CMSs.
Initially, let’s review the 10 CMS platforms with the highest number of origins, and examine what percentage of sites on each platform have a passing grade, meaning that the 75th percentile of each of the above metrics must be in the “good” (green) range for each site.
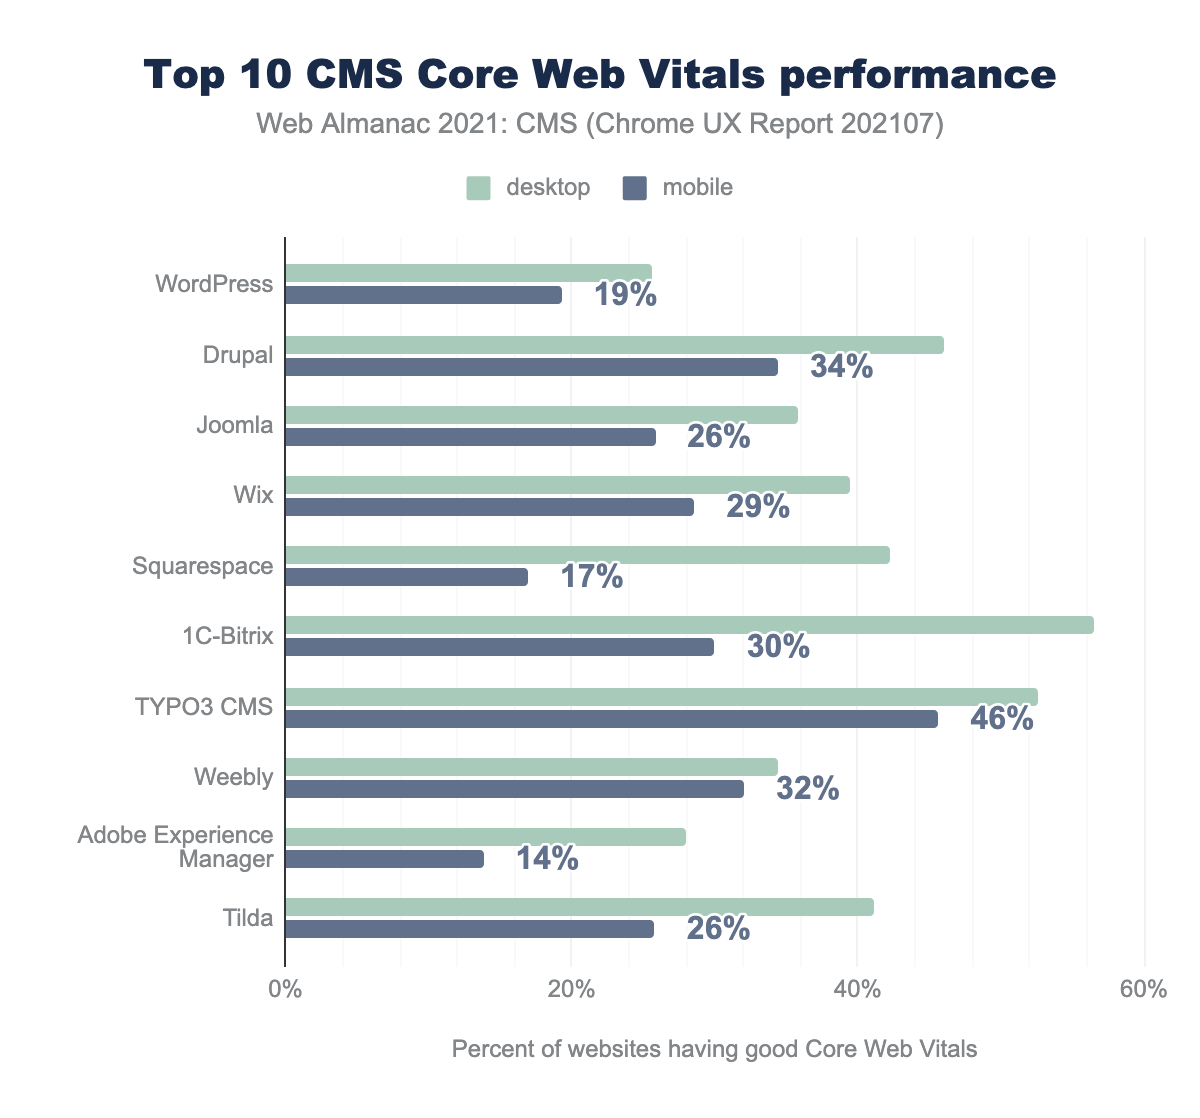
We can see that desktop visitors generally score slightly better than mobile, which can be explained by weaker mobile devices and poorer connections.
The large difference between mobile and desktop in certain platforms also suggests considerably different pages that are served to users on different devices.
In July, for mobile devices, TYPO3 CMS (used mostly in European countries) had the largest percentage of passing sites, with 46% of mobile sites passing all three CWVs. WordPress, Squarespace, and Adobe Experience Manager had less than 20% of their sites pass.
Desktop device experience was slightly better, with 1C-Bitrix (used mostly in Russia) having the largest percentage of 56% sites passing CWVs. WordPress had the lowest ratio of passing sites, with only 26%.
We can also evaluate the progress of these CMS platforms compared to last year’s data, focusing on mobile views:
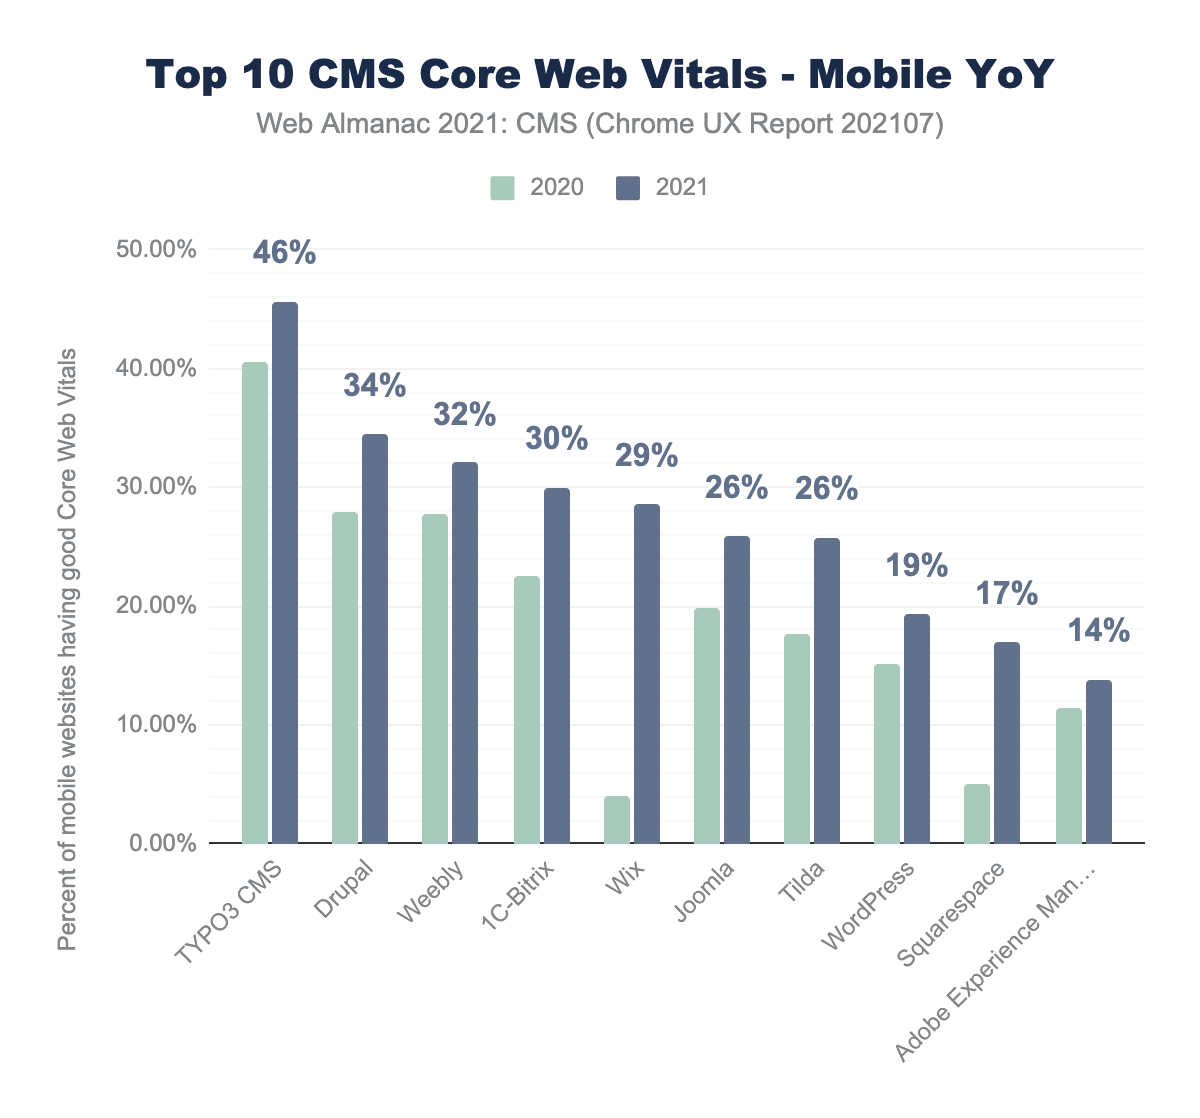
All of these CMSs showed an improvement in the percentage of origins with good CWVs since August 2020. Wix and Squarespace made the most noticeable progress, closing the gap from the other CMSs.
Let’s drill into the three Core Web Vitals, to see where each platform has room to improve, and which metrics improved the most since last year:
Largest Contentful Paint (LCP)
Largest Contentful Paint (LCP) measures the point in time when the page’s main content has likely loaded and thus the page is useful to the user. It does this by measuring the render time of the largest image or text block visible within the viewport.
A “good” LCP is regarded as being under 2.5 seconds.
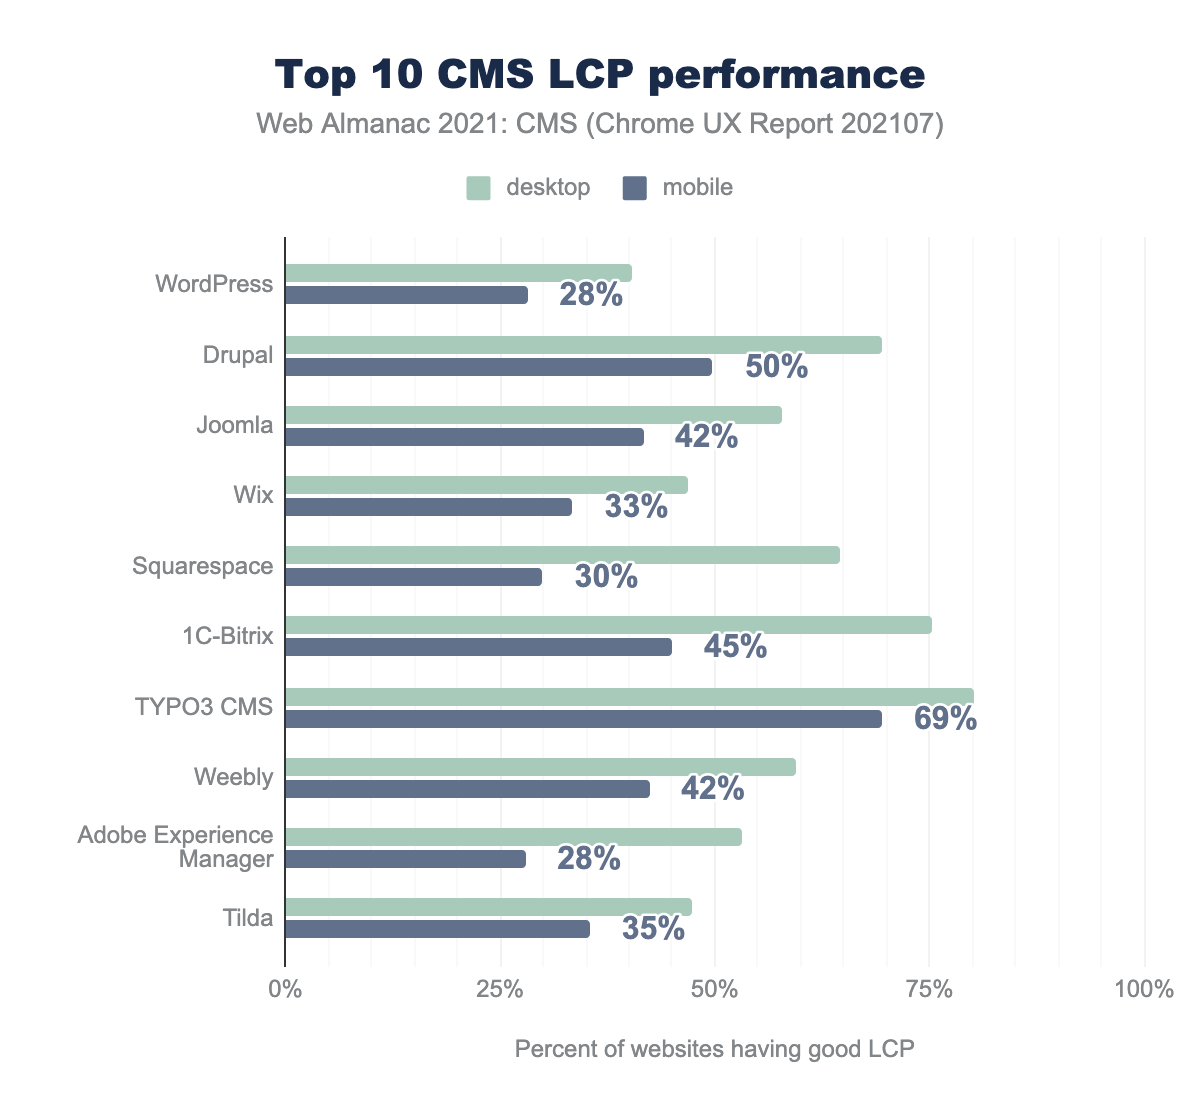
TYPO3 CMS had the best LCP scores with 69% of origins having a “good” LCP experience, while WordPress and Adobe Experience Manager have the worst LCP scores, with only 28% of origins having a good LCP score.
In general, it seems that most platforms are struggling with the LCP metric. This probably relates to the fact that the LCP is dependent on the download of image/font/CSS and then displaying the appropriate HTML elements. Achieving this in under 2.5 seconds for all device types and connection speeds can be challenging. Improving LCP scores usually involves the correct use of caching, pre-loading, resource prioritization, and lazy loading of other competing resources.
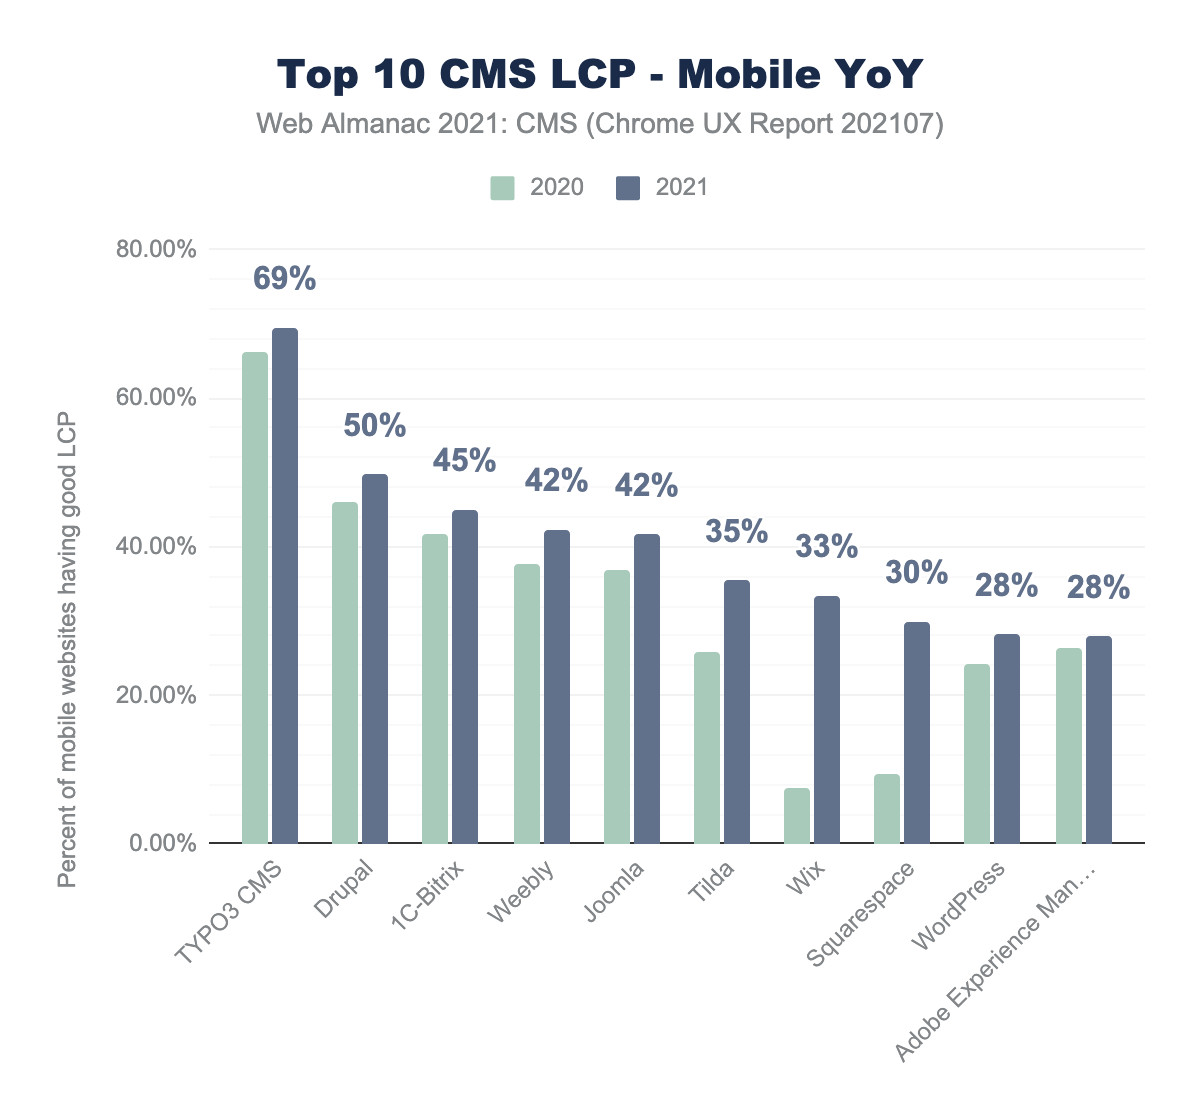
We can see that all CMSs improved their LCP in the past year, but most of them had modest improvements. The largest jump came from Wix and Squarespace, who had very low LCP scores last year. Tilda also seems to have made considerable progress.
First Input Delay (FID)
First Input Delay (FID) measures the time from when a user first interacts with the page (i.e., when they click a link, tap on a button, or use a custom, JavaScript-powered control) to the time when the browser is able to process that interaction. A “fast” FID from a user’s perspective would be almost immediate feedback from their actions on a site rather than a stalled experience.
Any delay is a pain point and could correlate with interference from other aspects of the site loading when the user tries to interact with the site.
A “good” FID is regarded as being under 100 milliseconds.
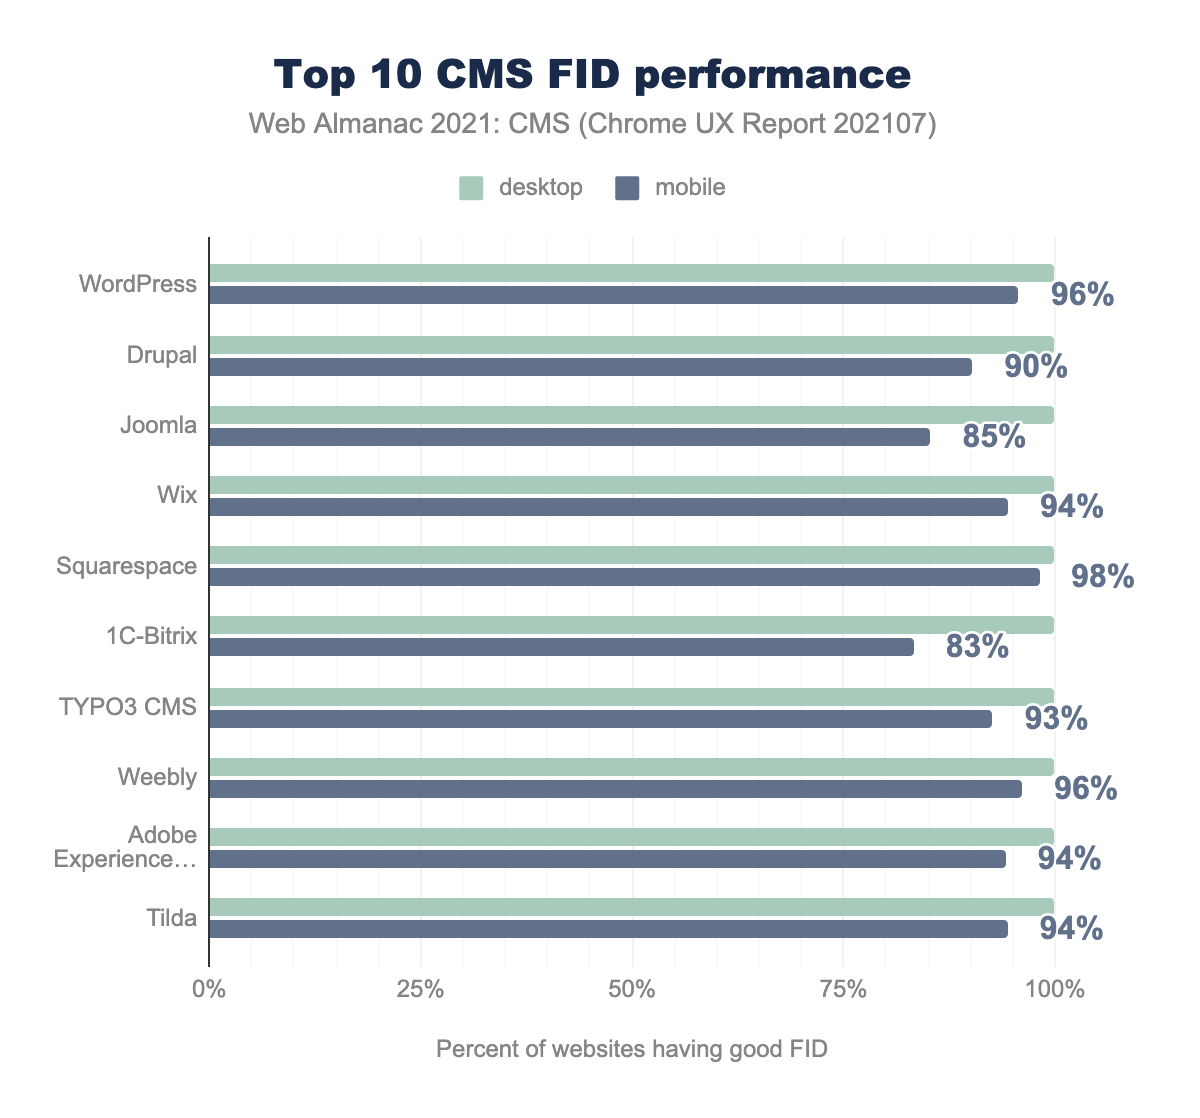
FID is very good for most CMSs on desktop, with all platforms scoring a perfect 100%. Most CMSs also deliver a good mobile FID of over 90%, except Bitrix and Joomla with only 83% and 85% of origins having a good FID.
The fact that almost all platforms manage to deliver a good FID, has recently raised questions about the strictness of this metric. The Chrome team recently published an article, which detailed the thoughts towards having a better responsiveness metric in the future.
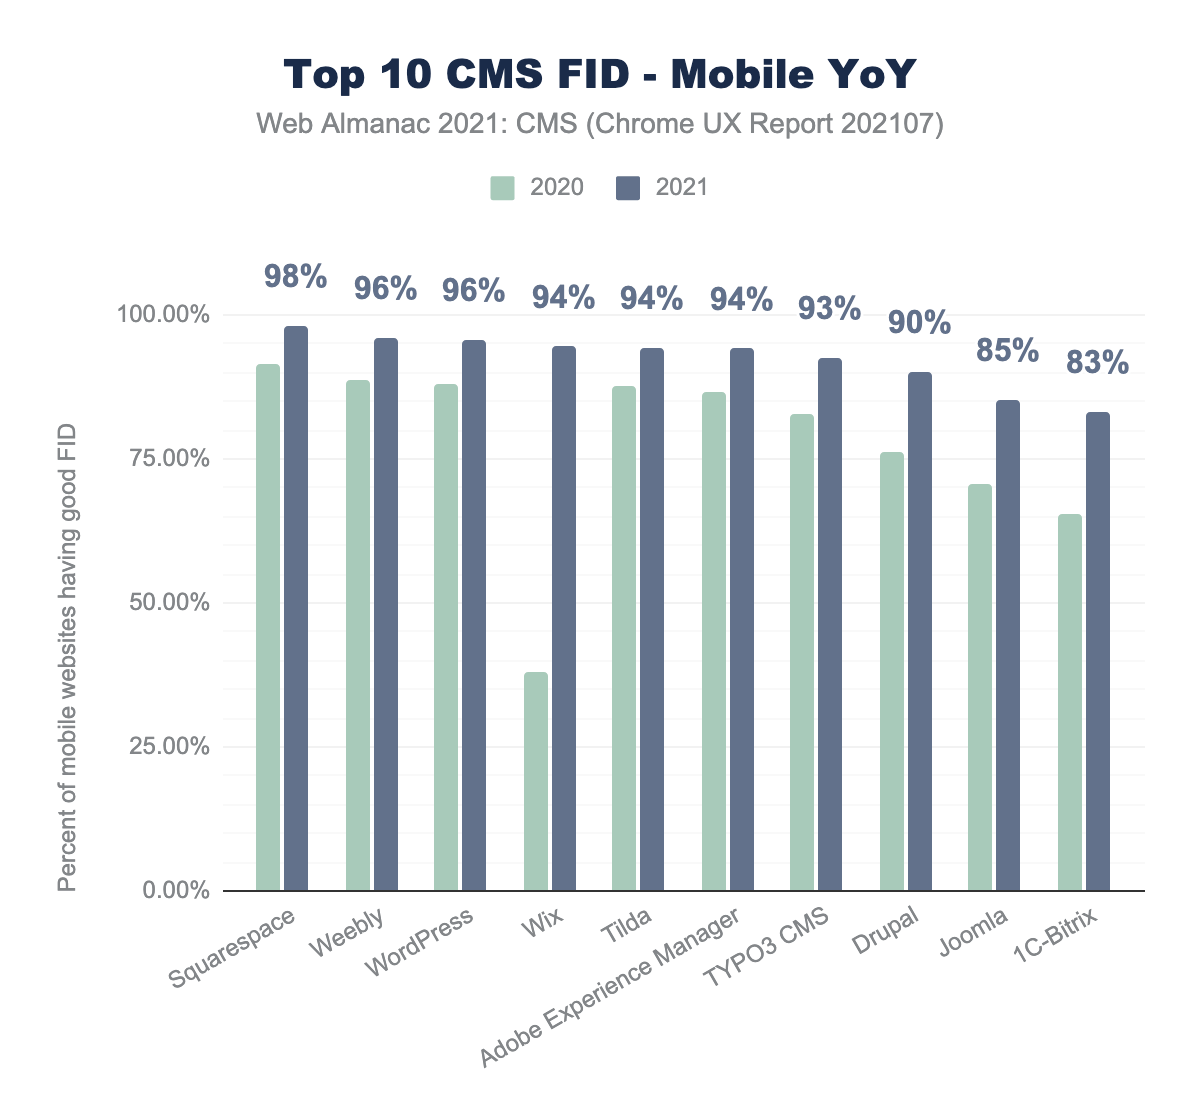
Yearly data shows that all these CMSs managed to improve their FID over the past year. Wix had the most catching up to do on FID, and considerably improved their numbers. Joomla and Bitrix had the lowest FID scores this year, but still managed to improve.
Cumulative Layout Shift (CLS)
Cumulative Layout Shift (CLS) measures the visual stability of content on a web page, measuring the largest burst of layout shift scores for every unexpected layout shift that occurs during the entire lifespan of a page that was not caused by direct user interactions.
A layout shift occurs any time a visible element changes its position from one rendered frame to the next.
The CLS metric has evolved in the past year, mainly introducing the concept of Session Windows, to be fairer to long-lived pages and Single Page Apps (SPAs).
A score of 0.1 or below is measured as “good”, over 0.25 as “poor”, and anything in between as “needs improvement”.
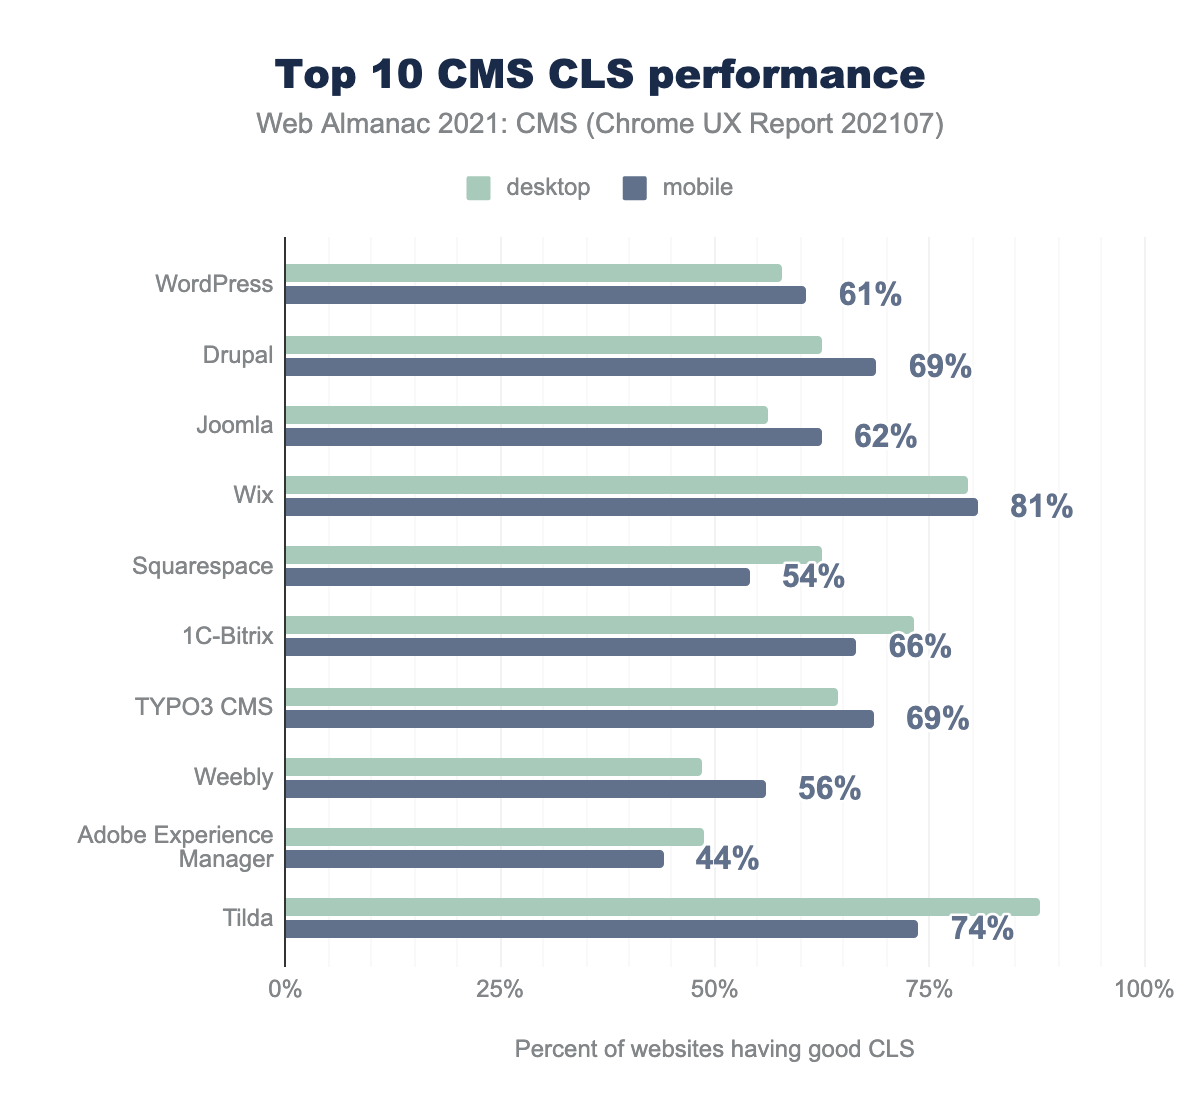
Wix had the best CLS score, with 81% of mobile origins having a “good” CLS. Adobe Experience Manager had the lowest CLS scores, with only 44% of mobile origins having a good CLS. Because layout shifts can usually be avoided, regardless of connection speeds–all platforms should strive to improve these numbers by reducing layout shifts to the bare minimum.
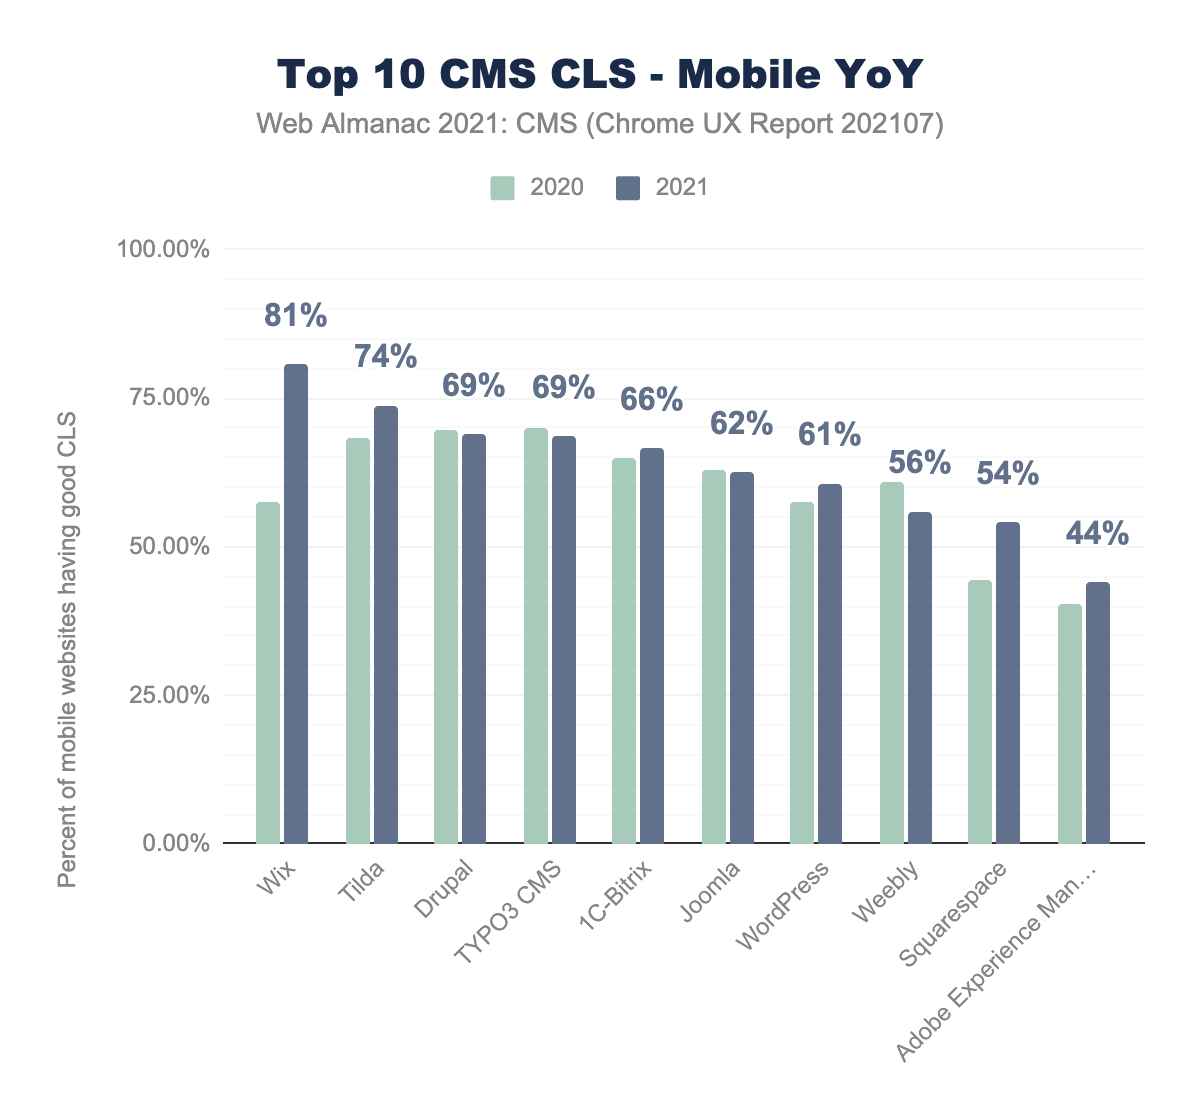
Comparing yearly data, we can see that most CMSs made some progress, or benefited from the change to a windowed CLS metric. However, we can see that certain CMSs such as Weebly regressed in CLS scores over the past year.
Lighthouse
Lighthouse is an open-source, automated tool for improving the quality of web pages. One key aspect of the tool is that it provides a set of audits to assess the status of a website in terms of performance, accessibility, SEO, best practices, and more. Lighthouse reports provide lab data, a way developers can get suggestions on how to improve website performance, but the Lighthouse score has no direct implications on the actual field data collected by CrUX. You can read more on Lighthouse and the correlation between its lab scores and field data.
HTTP Archive runs Lighthouse on all its mobile web pages (unfortunately, no desktop results), which are also throttled to emulate a slow 4G connection with a CPU slowdown.
We can analyze this data to provide another perspective on CMS performance, using the results of these synthetic tests, which also include metrics that are not tracked in CrUX.
Performance score
The Lighthouse performance score is a weighted average of several metric scores.
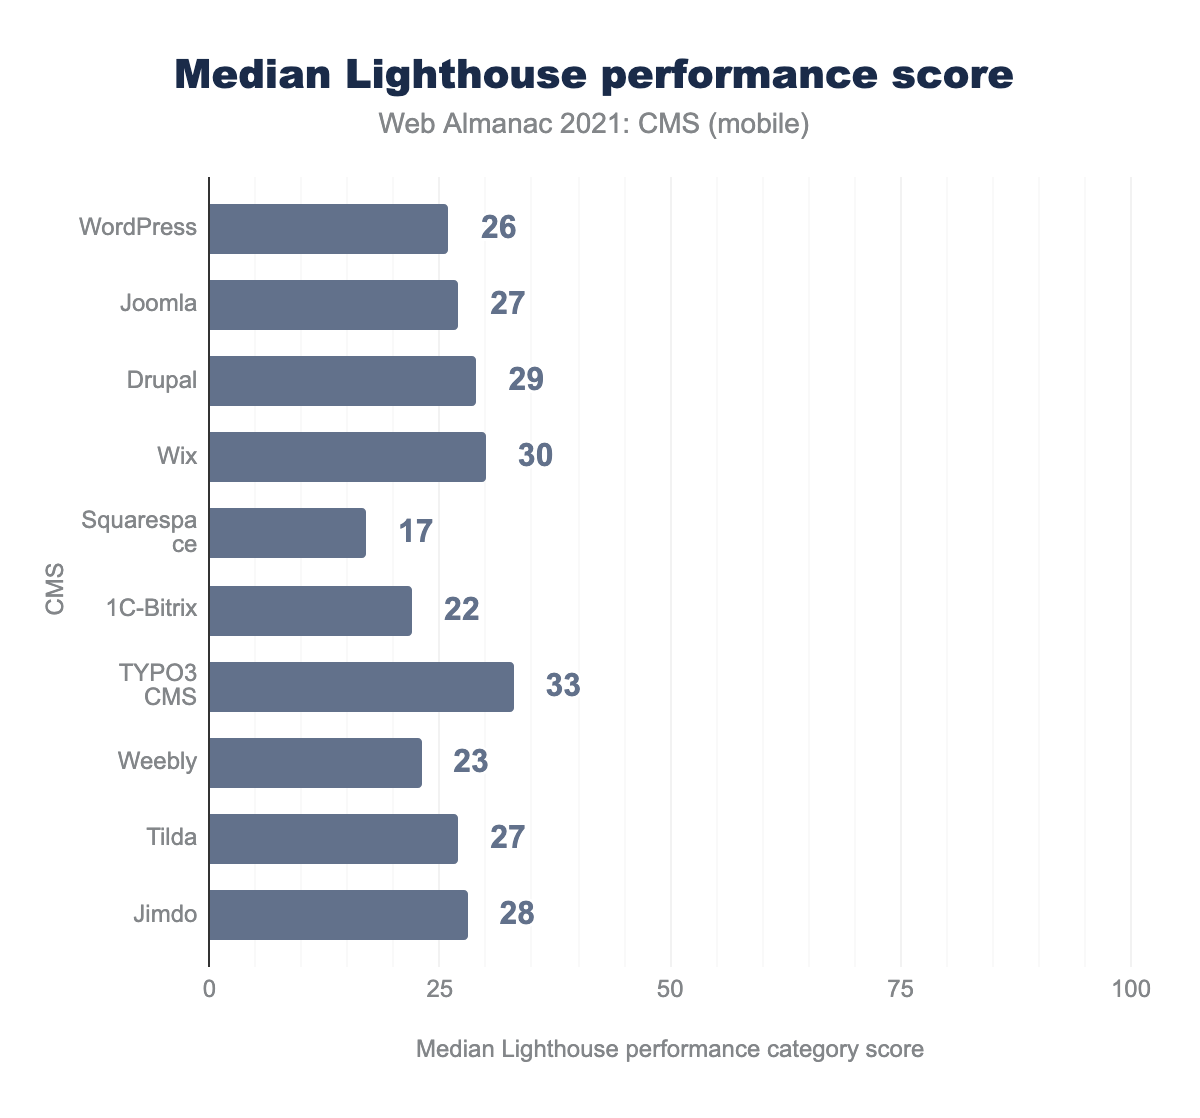
We can see that the median performance scores for all the top platforms on mobile are low, ranging from 17 to 33. As we saw above, this does not directly imply bad results in mobile field data but does imply that all platforms have room for improvements, especially for low-end devices and network connections similar to those Lighthouse attempts to emulate.
SEO score
Search Engine Optimization (or SEO) is the practice of improving a website to make it more easily found in search engines. This is covered more in-depth in our SEO chapter, but one part involves ensuring the site is coded in such a way to serve as much information to search engine crawlers to make it as easy as possible for them to show a site appropriately in search engine results. Compared to a custom-created website, one might expect a CMS to provide good SEO capabilities, and the Lighthouse scores in this category are appropriately high.
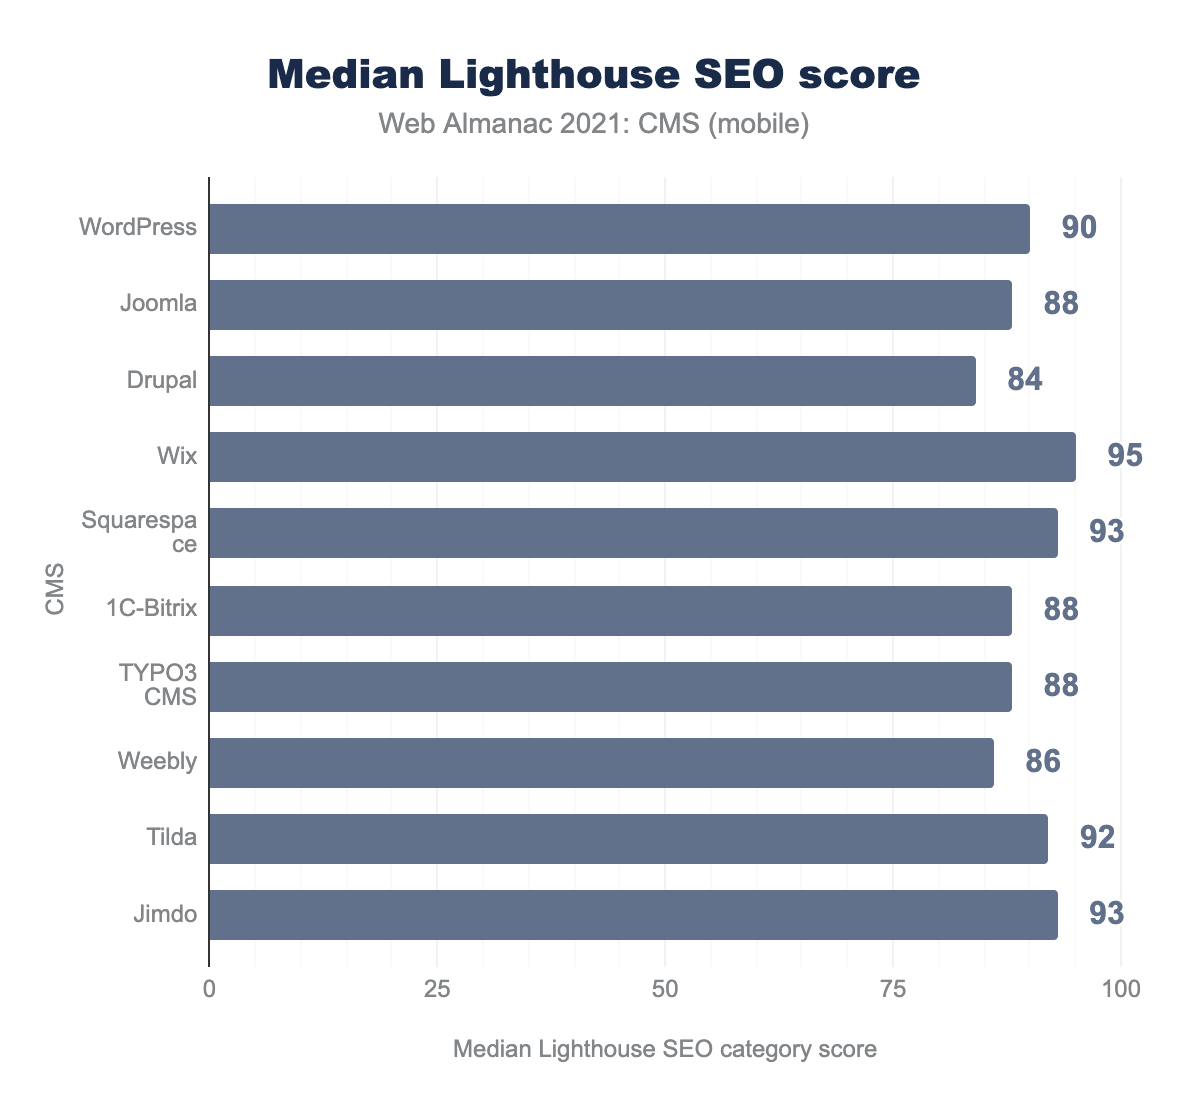
The median SEO score in all of the top 10 platforms is over 84, with Drupal scoring the lowest and Wix scoring the highest with a median score of 95.
Accessibility score
An accessible website is a site designed and developed so that people with disabilities can use them. Web accessibility also benefits people without disabilities, such as those on slow internet connections. Read more in our Accessibility chapter.
Lighthouse provides a set of accessibility audits, and it returns a weighted average of all of them (see Scoring Details for a full list of how each audit is weighted).
Each accessibility audit is either a pass or a fail, but unlike other Lighthouse audits, a page doesn’t get points for partially passing an accessibility audit. For example, if some elements have screen reader-friendly names, but others don’t, that page gets a 0 for the screen reader-friendly-names audit.
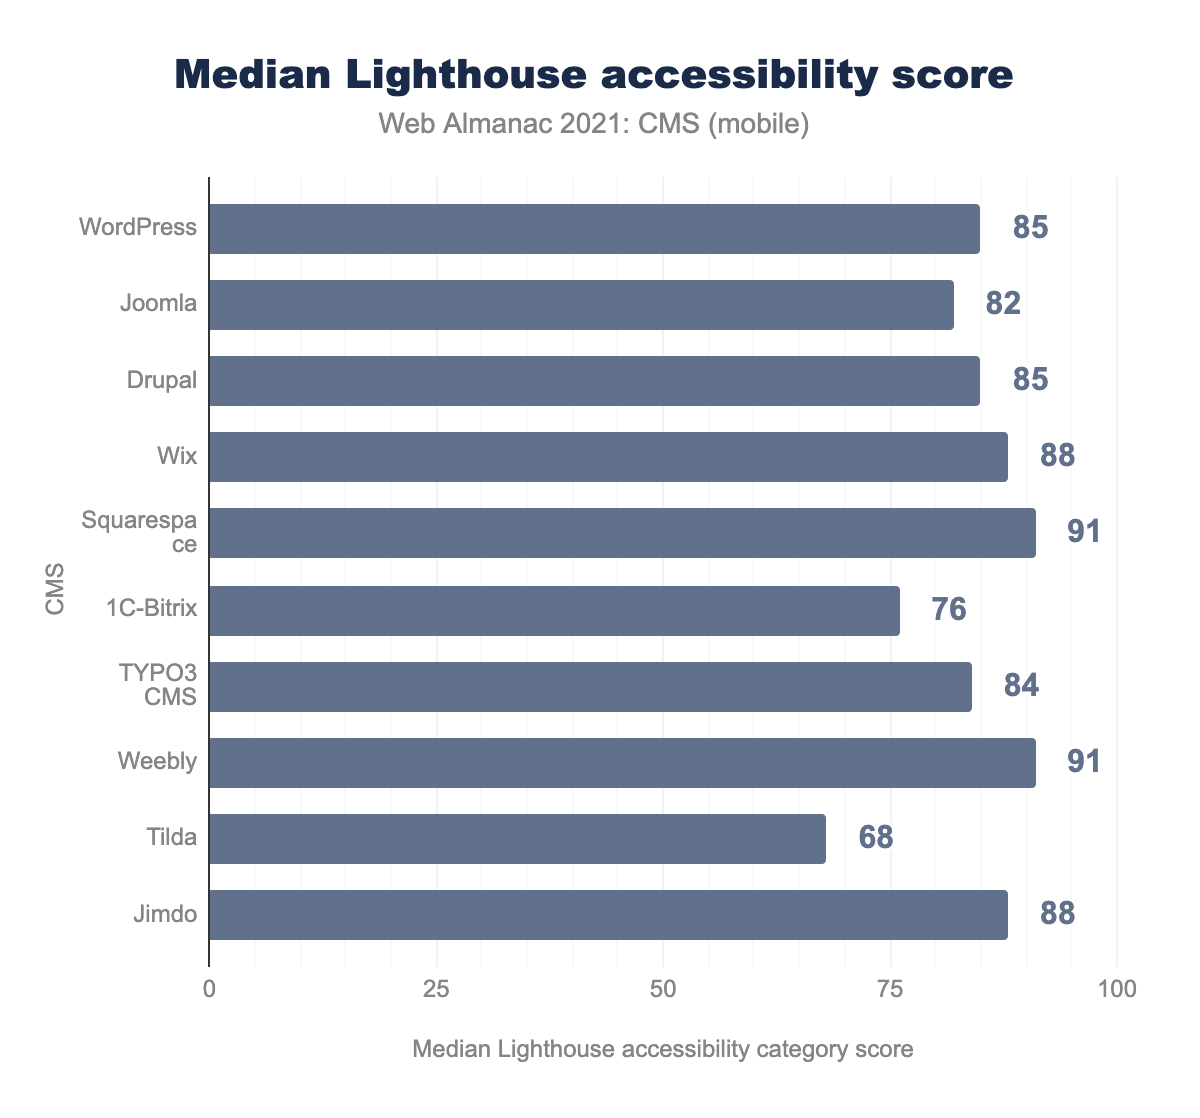
The median Lighthouse accessibility score for the top 10 CMSs ranges between 76 and 91. Squarespace and Weebly have the highest scores of 91, while Tilda had the lowest accessibility scores.
Best practices
The Lighthouse best practices try to ensure that web pages are following best practices for the web, for a variety of different metrics, such as supporting HTTPS, no errors logged in the console, and more.
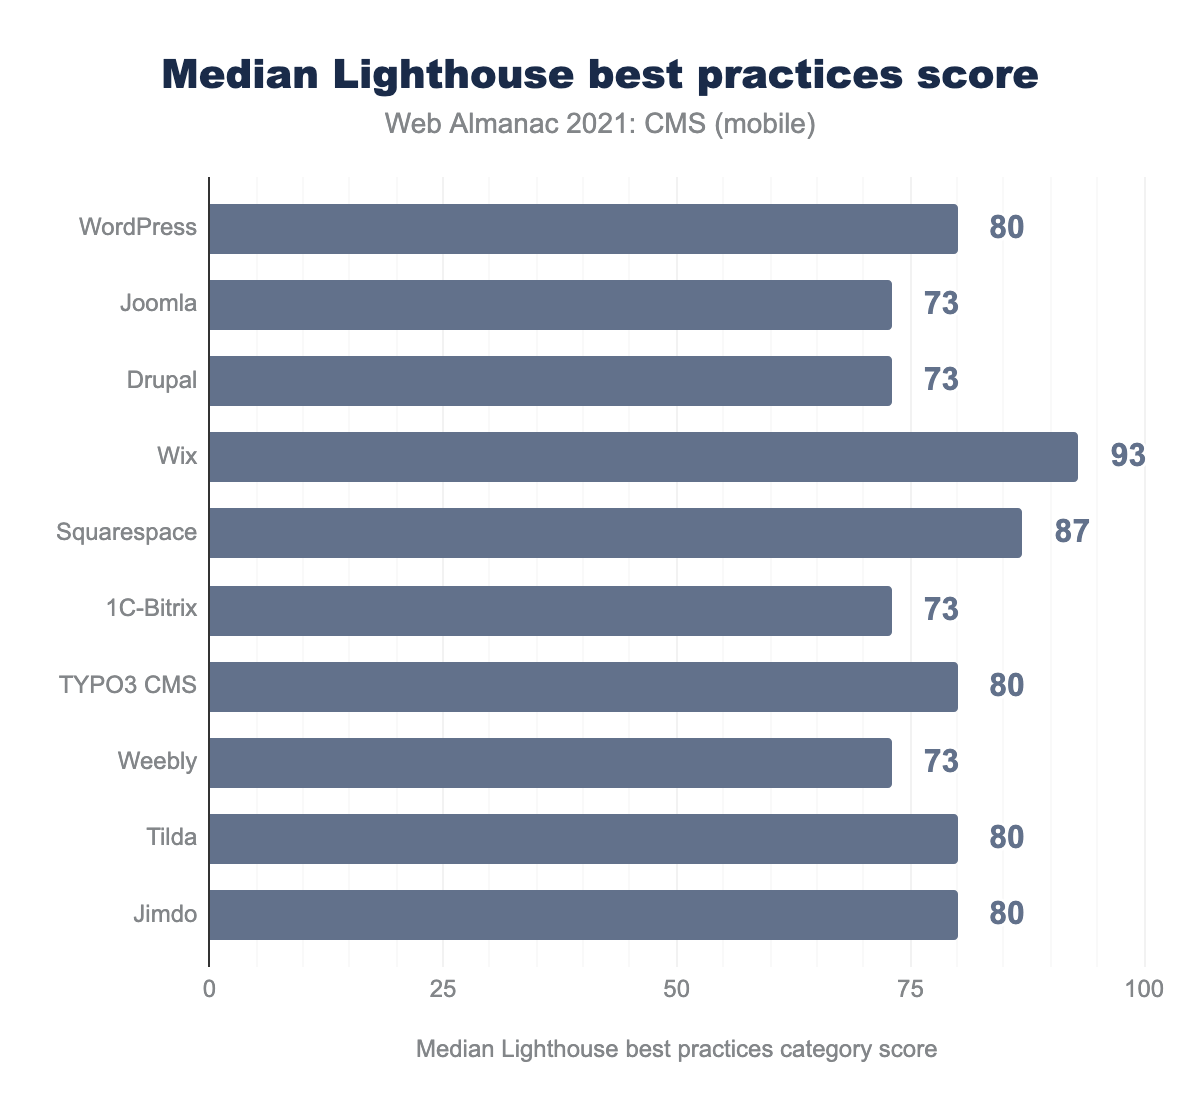
Wix had the highest median best practices score of 93, while many of the other top 10 platforms share the lowest score of 73.
Resource weights
We can also use HTTP Archive data to analyze the weight of resources used across different platforms, to highlight possible opportunities. Page loading performance does not exclusively depend on the number of downloaded bytes, but fewer bytes necessary to load a page results in reduced costs, carbon emissions, and potentially faster performance, especially for slower connections.
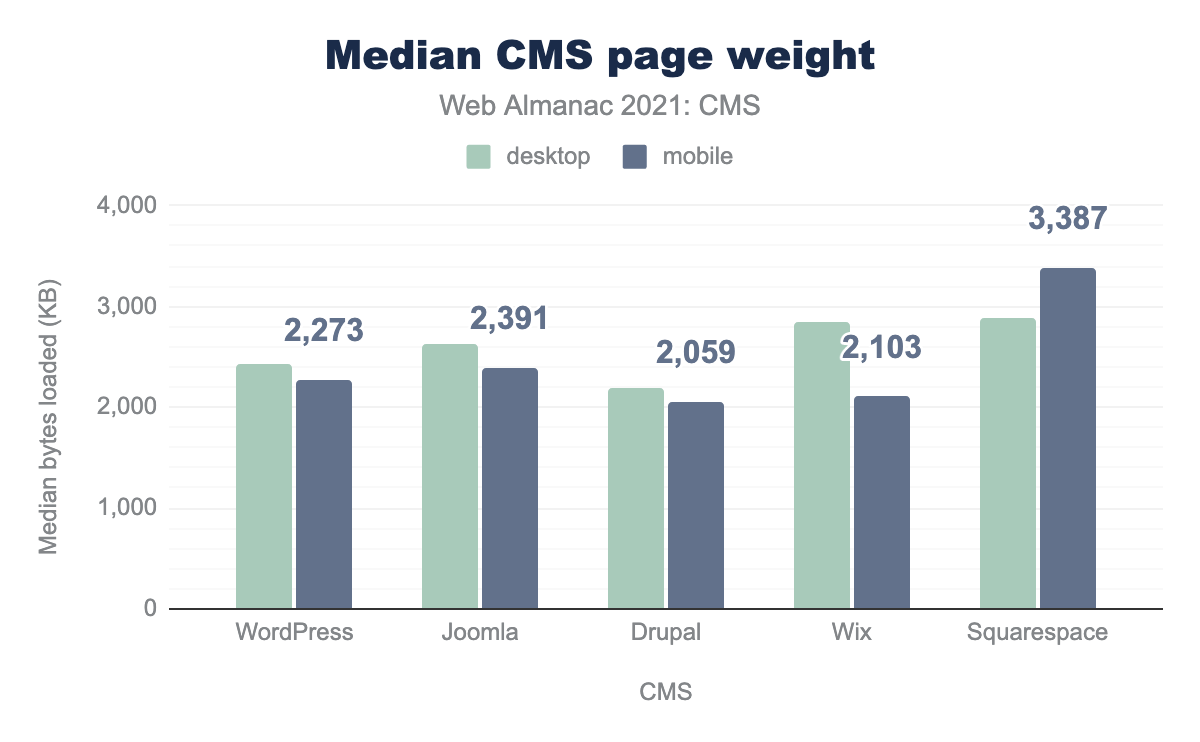
Most of the top 5 CMSs deliver a median page weight of around ~2 MB, except Squarespace which delivers a larger ~3.3 MB. Squarespace is the only platform that delivers more bytes in mobile views than on desktop.
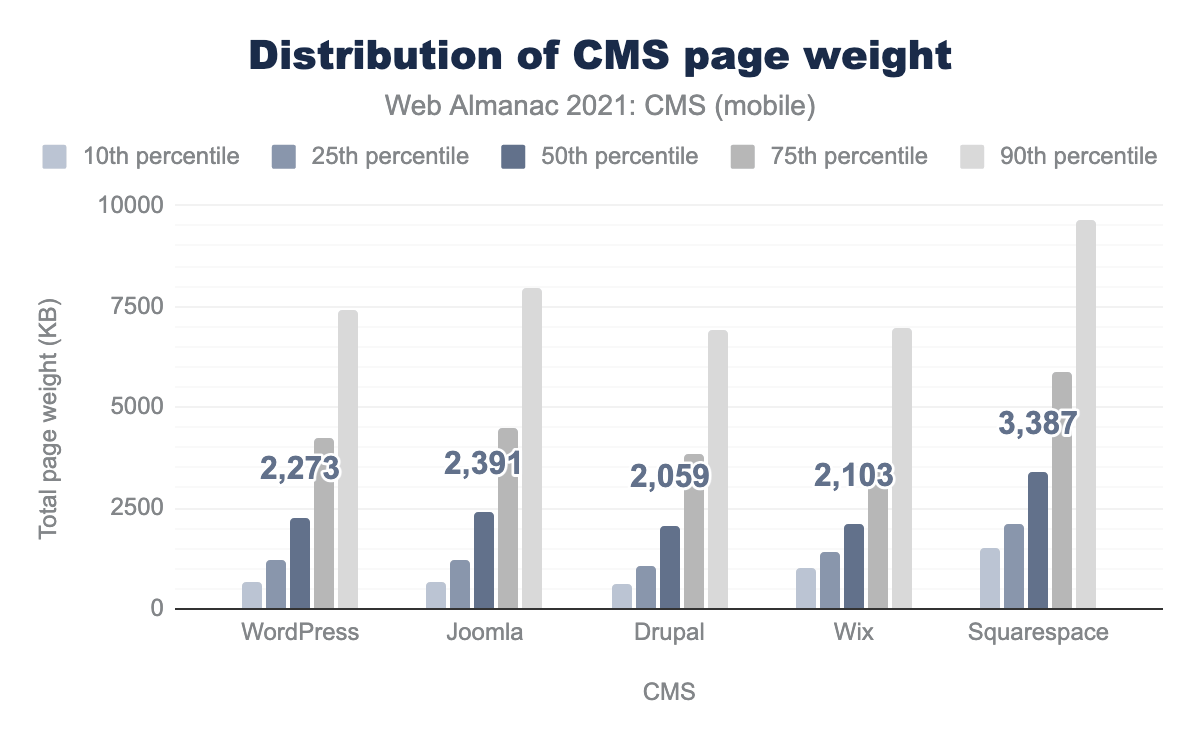
The distribution of page weight in each platform’s percentiles is substantial, probably related to the difference in user content across different web pages, the number of images used, plugins, etc. The smallest pages delivered per platform come from Drupal, which only sends 595 KB for their 10th percentile of visits. The largest pages come from Squarespace, with ~9.6 MB delivered for their 90th percentile of visits.
Page Weight Breakdown
Page Weight is a sum of resources used. We can attempt to evaluate these different resource sizes across different CMSs.
Images
Images, which are usually the heaviest resource, account for a large portion of the resource weight.
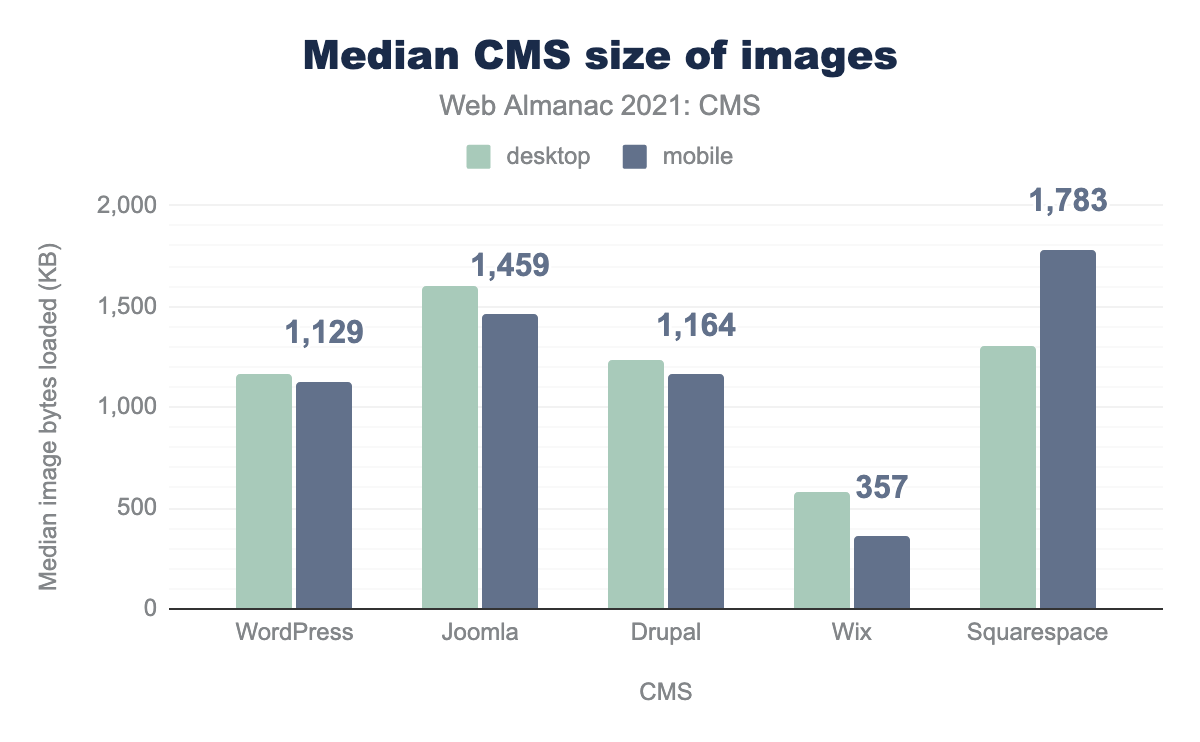
Wix delivers substantially fewer image bytes, with only 357 KB delivered on the median of mobile views, suggesting good use of image compression and lazy image loading. All of the other top 5 platforms deliver over 1 MB of images, with Squarespace delivering the largest ~1.7 MB.
Advanced image formats provide a considerable improvement in compression, enabling resource savings and faster site loading. WebP is commonly supported in all major browsers today, with over 95% support. In addition, there are several newer image formats gaining popularity and adoption, namely AVIF, and JPEG-XL which is still not complete but has outstanding potential.
We can examine the usage of the different image formats across the top CMSs:
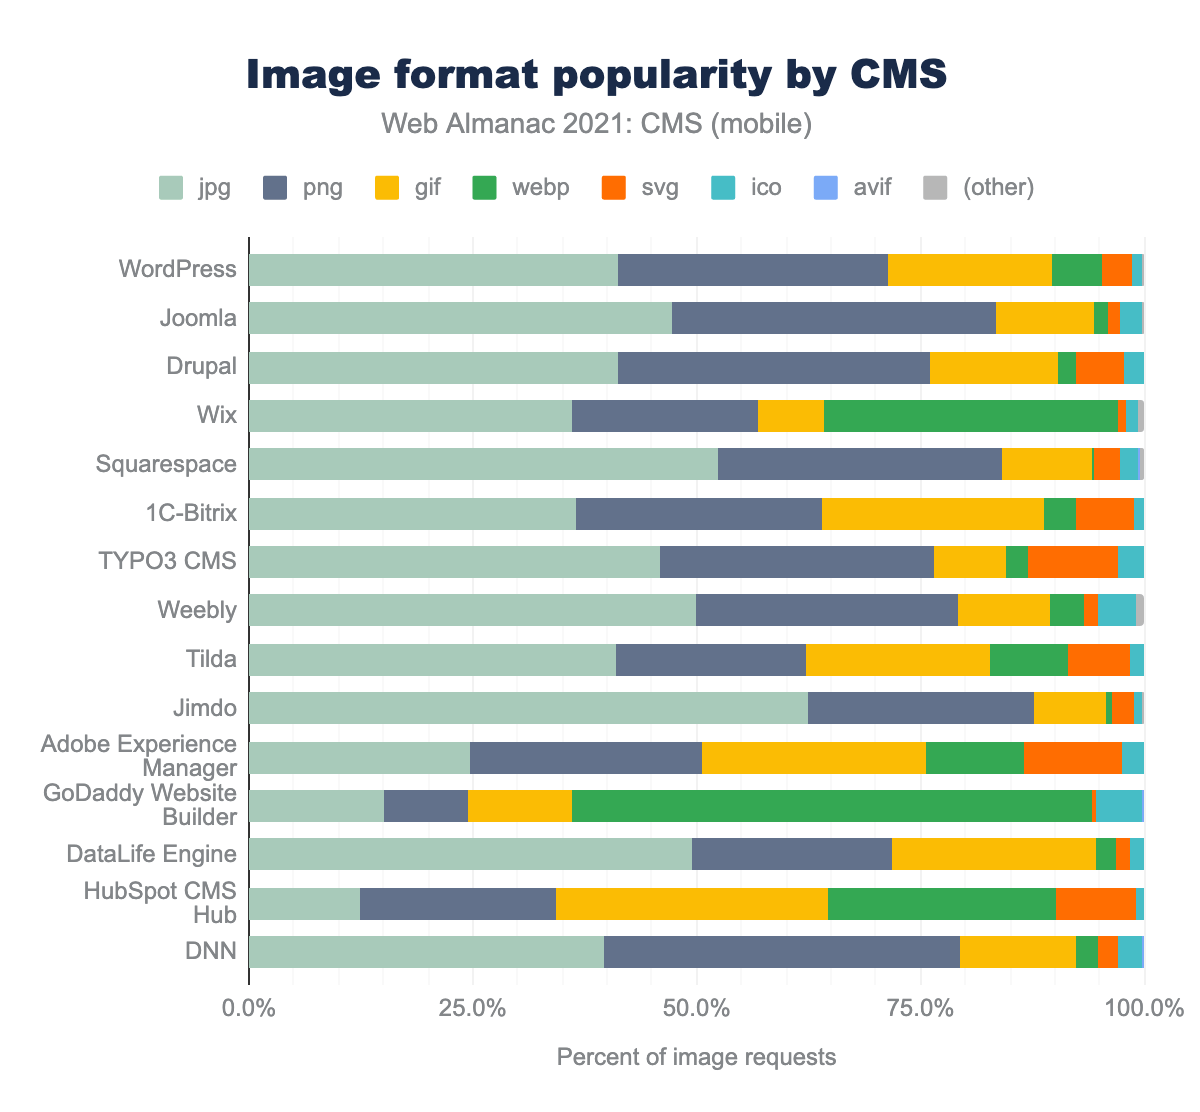
GoDaddy Website Builder and Wix make the most use of WebP, with ~58% and 33% adoption respectively, while WordPress, Joomla, and Drupal barely serve WebP–only ~5.7% of images served by WordPress sites are WebP. AVIF is barely used by these platforms, with less than ~0.1% on all platforms.
With the growing support of WebP, it seems all platforms have work to do to reduce the usage of the older JPEG and PNG formats, where it is applicable without compromising on image quality.
JavaScript
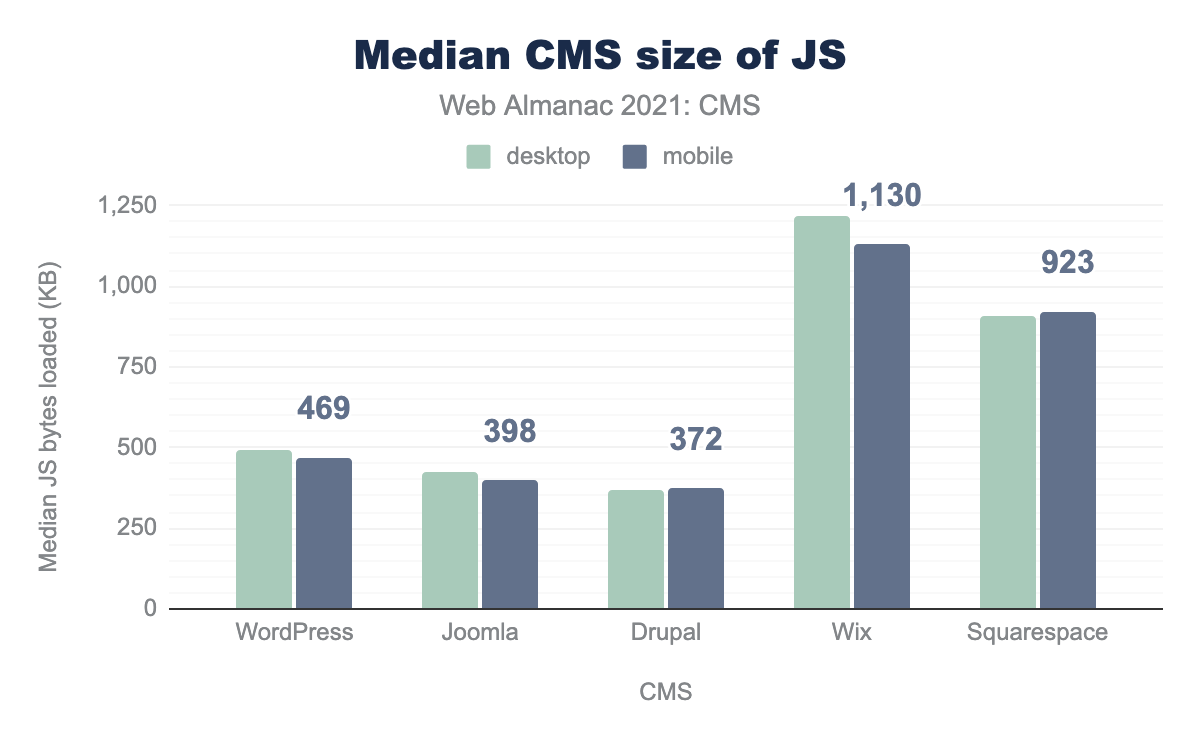
The largest five CMSs all deliver pages that rely on JavaScript, with Drupal delivering the least amount of JavaScript bytes–372 KB on mobile, while Wix delivers the most JavaScript bytes, over 1.1 MB.
HTML document
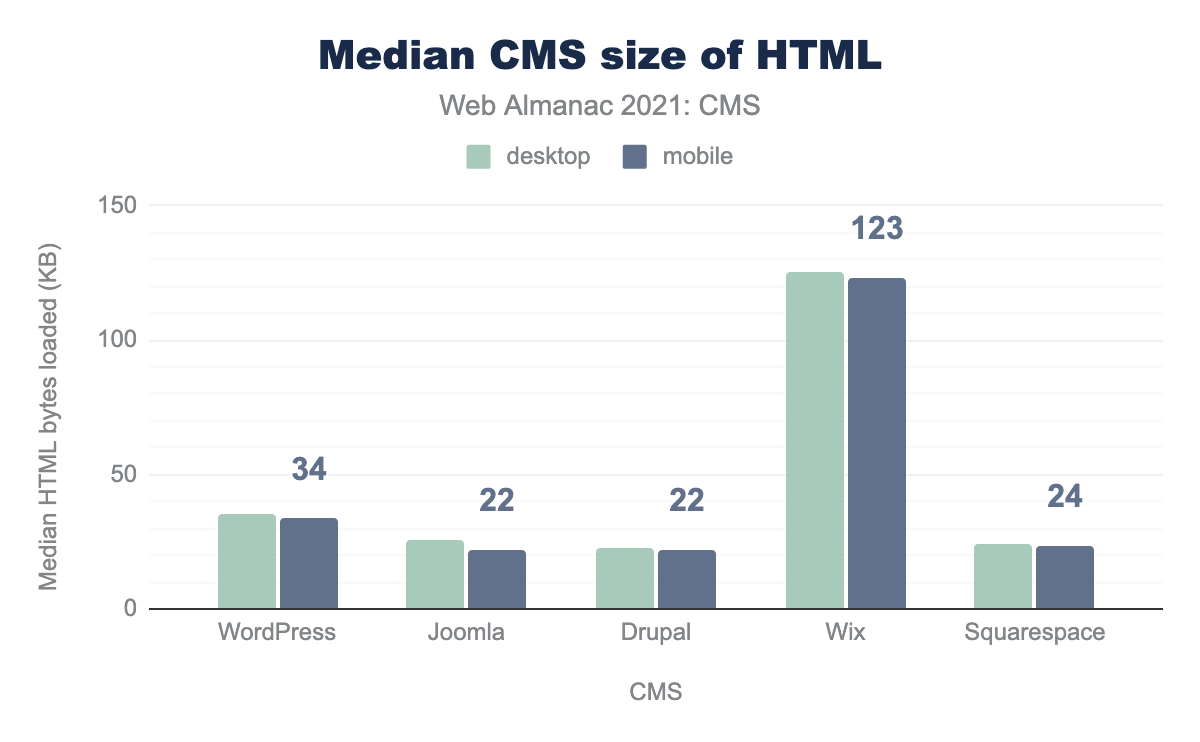
Examining the HTML document sizes, we can see that most of the top CMSs deliver a median HTML size of ~22 KB–34 KB, except Wix which delivers substantially more HTML of ~123 KB. This can suggest extensive use of inlined resources and shows an area that can be further improved.
CSS
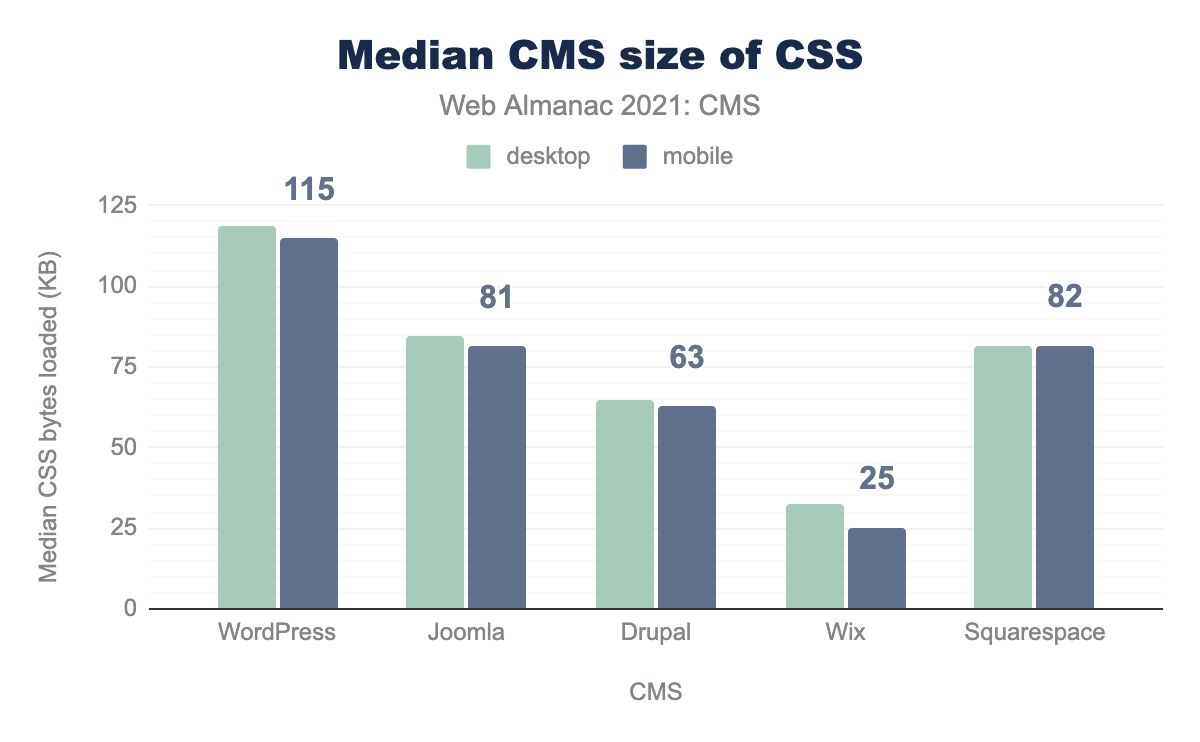
Next, we examine the use of explicit CSS resources that are downloaded. Here we can see a different distribution between platforms, strengthening the differences in inlining approaches. Wix delivers the fewest CSS resources, with only ~25 KB sent on mobile views; WordPress delivers the most with ~115 KB.
Fonts
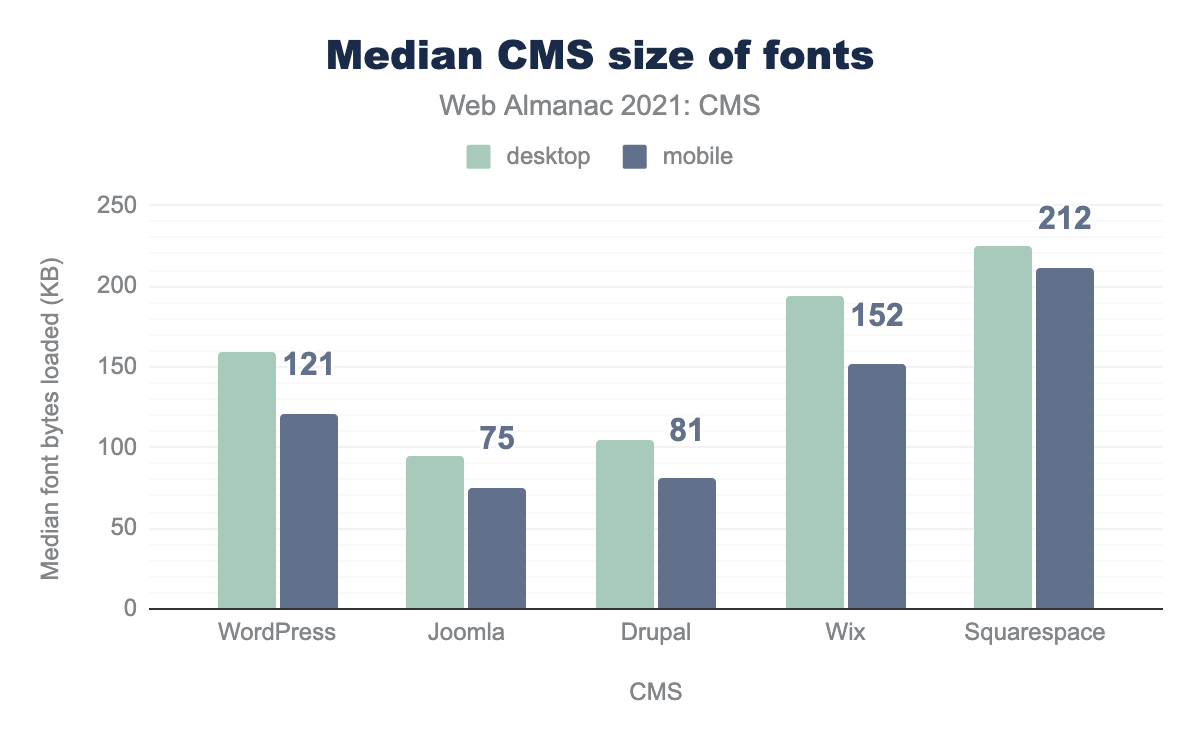
To display text, web developers often choose to use a variety of fonts. Joomla delivers the fewest font bytes, with 75 KB on mobile views, and Squarespace delivers the most with 212 KB.
WordPress specific
WordPress is the most commonly used CMS today–almost 3 out of 4 sites built with a CMS are using WordPress, thus deserving further discussion.
WordPress is an open-source project, which has been around since 2003. Many sites built on WordPress use various themes and plugins, sometimes through page builders such as Elementor or Divi.
The WordPress community maintains the CMS and services requirements for additional functionality through custom services and products (themes and plugins). This community has an outsized impact, with a relatively small number of people maintaining both the CMS itself and providing the additional functionality which makes WordPress sufficiently powerful and flexible that it can service most types of websites. This flexibility is important when explaining the market share, but also complicates the discussion around WordPress based site performance.
Contributors from the WordPress community recently acknowledged the current state of performance, in this proposal to create a performance dedicated core team, which can hopefully improve the current performance of the average WordPress sites.
Adoption
First, we examined WordPress adoption by geography, across all sites in our dataset.
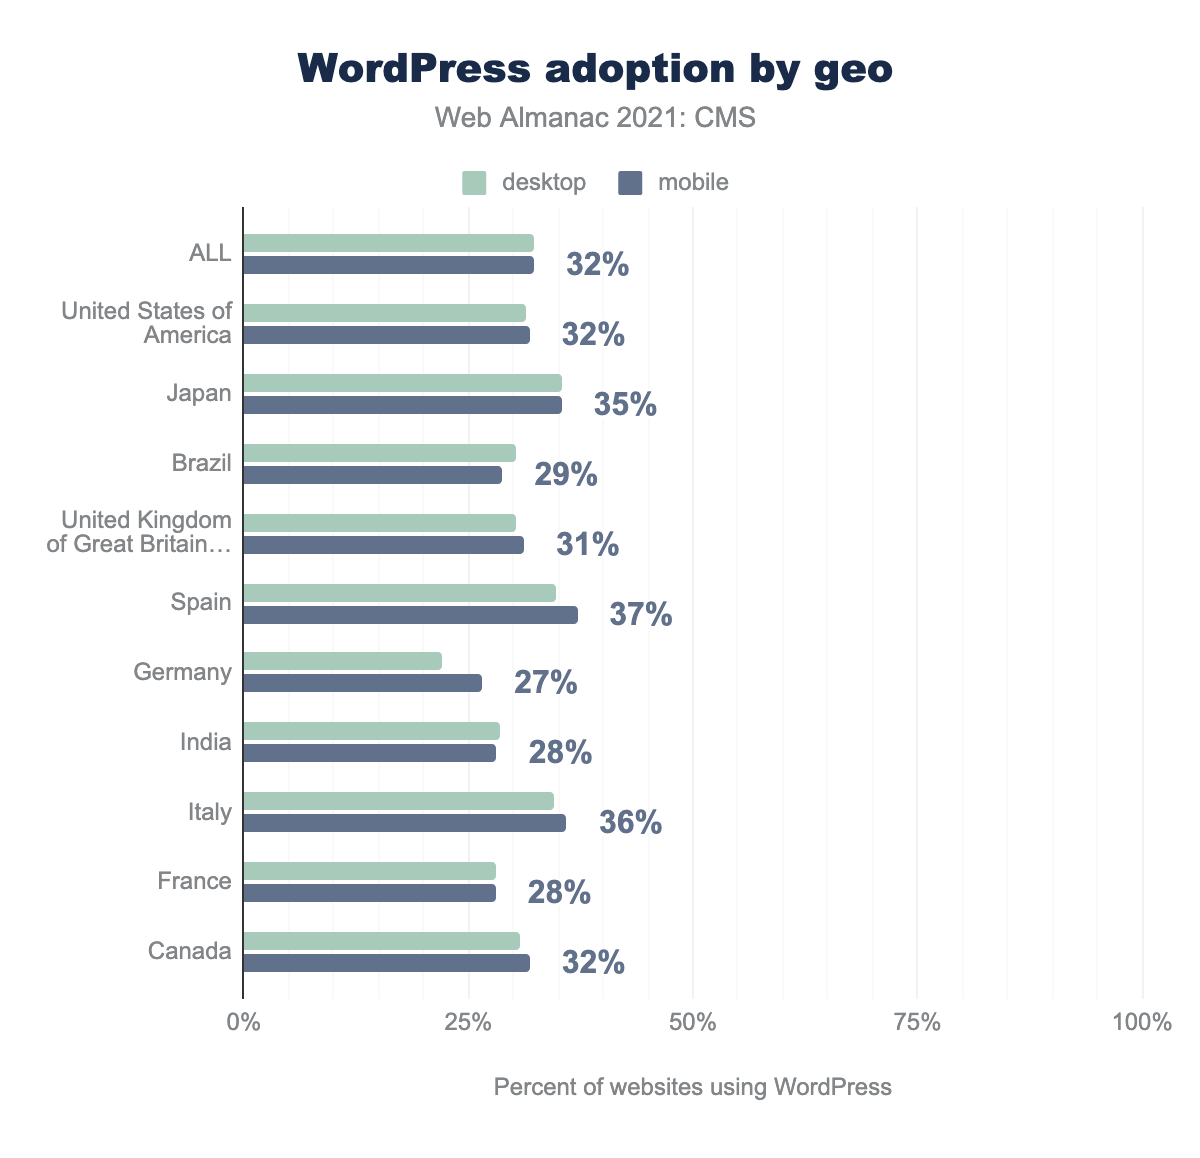
In the top 10 countries with the most sites in our dataset, WordPress had over 27% adoption. Spain had the highest WordPress adoption among these countries with 37% of mobile pages using WordPress, compared with Germany where only 28% of mobile pages used WordPress.
Passing CWVs by geography
Next, let’s look at the amount of WordPress origins with passing Core Web Vitals, but this time, breakdown by geography, for mobile devices.
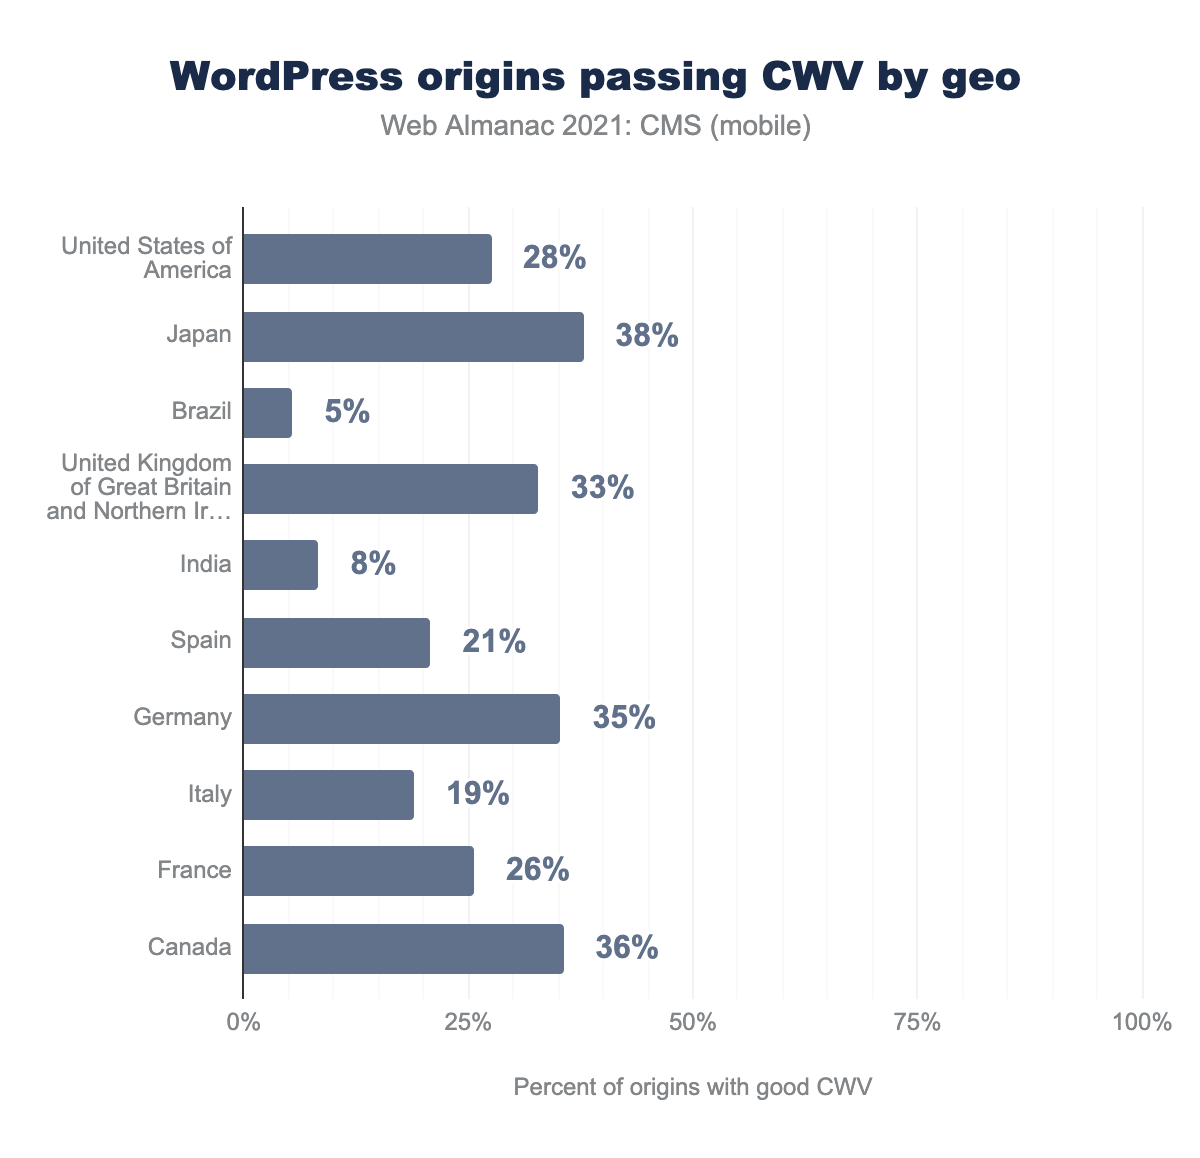
We can see that while WordPress was passing on 19% of the total origins counted across all countries, WordPress sites are passing in a very different percentage in various countries. In Japan, 38% of sites have good CWVs for mobile visitors, but in Brazil, only 5% have good CWVs.
This exposes a very interesting view of Core Web Vitals and hints at a geographical bias when comparing CWV for different platforms. If a CMS only has a presence in certain countries, comparing the aggregate percentage isn’t a fair comparison.
WordPress, with a very large adoption around the world, including countries with less powerful devices and slower connections, may suffer from this comparison in some cases, but likely has room to improve in all geographies. On the other hand, CMSs should strive to offer the best experience in the geography they are targeting, which sometimes means making sites fast enough to work well even under stricter conditions.
Plugins
We explored how WordPress sites use external resources and separated them between resources that are included in plugins, themes, and shipped in WordPress core (wp-includes).
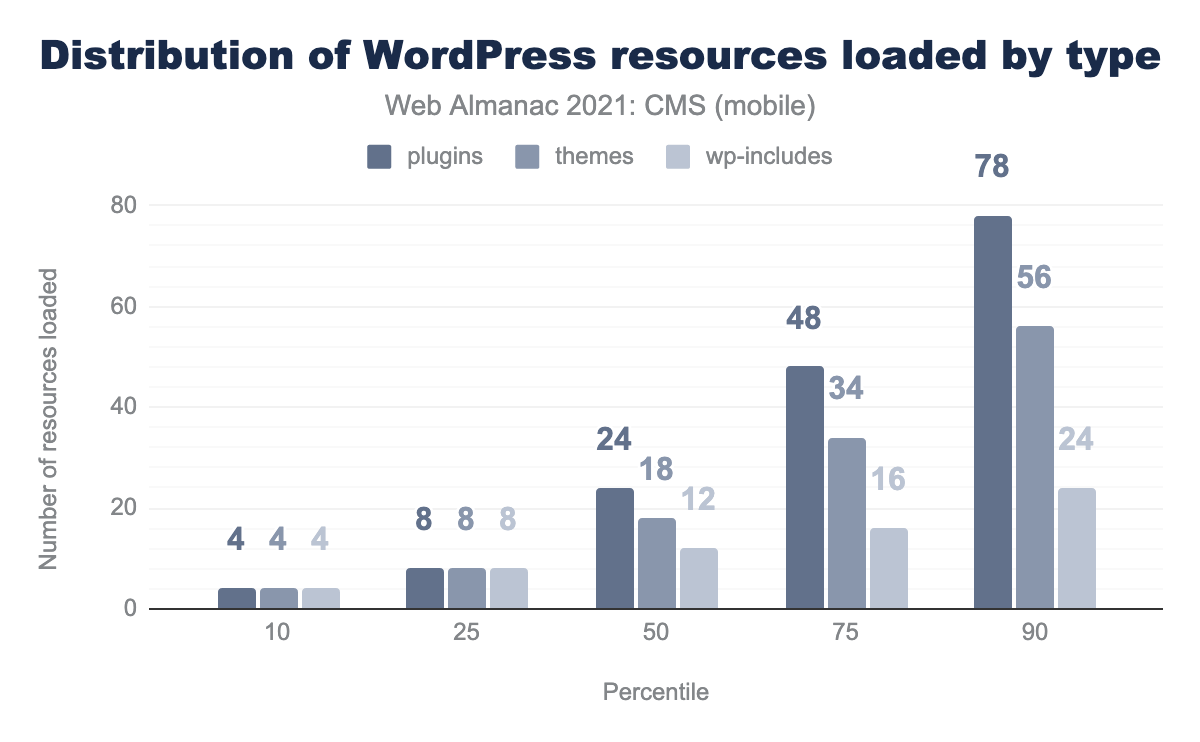
The median mobile WordPress page loads 24 resources under the /plugins/ path, 18 resources under the /themes/ path, and 12 resources under the /wp-includes/ path. In the 90th percentile, we see a huge amount of resource requests, with 78 plugin resources, 56 themes, and 24 wp-includes!
WordPress’s extension ecosystem provides extraordinary flexibility and may be a major contributor to its high adoption rate. On balance it also appears detrimental to performance in many cases, due to the number of plugins available and the many resources they depend on.
Conclusion
CMS platforms continue to grow and are becoming more ubiquitous year-over-year. They are essential for easily creating and consuming content on the internet, especially as more people and businesses establish an online presence.
The introduction of Core Web Vitals, along with the advancements in performance data visibility, has generated a focus on web performance across the web, and we hope these insights will help us all get a better understanding of the current state of the web, ultimately making the web a better place.
CMSs are doing great work and have a huge opportunity to further improve user experiences on the web at scale, by striving to enhance their infrastructure, experiment and integrate with new standards as they evolve, and follow best practices.
On the other hand, Core Web Vitals still have some progress and evolving to do.
We mentioned the thoughts towards a better responsiveness metric above. In addition, navigations between pages in a site should be better tracked and take into account the difference between Single-Page Applications (SPAs) and Multi-Page Applications (MPAs) architectures.
Let’s continue pushing forward.
