PWA

Introduction
Six years have passed since Frances Berriman and Alex Russell coined the term “Progressive Web App” (PWA), which represented their vision for web apps that can be just as immersive as native apps. The following attributes were listed to distinguish these types of experiences from traditional websites:
- Responsive
- Progressively enhanced with service workers
- Having app-like interactions
- Fresh
- Safe
- Discoverable
- Re-engageable
- Linkable
Over the last several years, the web platform has continued to evolve, reducing the gap between web apps and OS-specific experiences, and allowing developers to provide users with richer capabilities and new ways to stay engaged.
Despite that, it’s still difficult to draw a clear line between what is a PWA or not; some experts might give more importance to creating an “appy” experience, characteristic of the shell and content application model, while others focus more on certain components and behaviors, like having a service worker and a web app manifest, providing an offline experience, or other advanced functionalities.
In this year’s PWA chapter, we’ll focus on all the measurable aspects of a PWA: usage of service workers and its related APIs, web app manifests, and the most popular libraries and tools to build PWAs. A PWA can use all or some of these functionalities. We’ll look at the level of adoption of each component and API to get an idea of the level of penetration of these technologies in the web ecosystem.
Service workers
Service workers (introduced in December 2014) are one of the core components of a PWA. They act as a network proxy and allow for features like offline, push notifications, and background processing, which are characteristic of “app-like” experiences.
It took some time for service workers to become widely adopted, but today they are supported by most major browsers. However, this doesn’t mean that all service worker features work across browsers. For example, while most of the core functionalities like network proxying are available, APIs like Push are not yet available in WebKit.
Service workers usage
We estimate that between 1.22% to 3.22% of sites use service workers in 2021, depending on the type of measurement used. This year we have decided to take the 3.22% as the closest approximation—for reasons we’ll explain next.
Measuring whether a service worker is used is not as simple as might seem. For example, Lighthouse detects 1.5%, however it adds some extra checks in that definition rather than just service worker usage so could be seen as a lower bound. Chrome itself measures 1.22% sites using service workers, which is strangely less than Lighthouse for reasons that we have not been able to ascertain.
For this year’s PWA chapter, we’ve updated our measurement techniques by creating a new set of metrics. For example, we’re now using heuristics that check for several service worker characteristics, like having service worker registration calls and use of service worker specific methods, libraries, and events.
From the data we gathered, we can see that about 3.05% of desktop sites and 3.22% of mobile sites use service workers features, which suggests that service worker usage might be higher than measured in last year’s chapter (0.88% in desktop and 0.87% in mobile).
One might think that having a little more than 3% of sites registering a service worker in mobile and desktop is a low number, but how does this translate to web traffic?
Chrome Platform Status provides usage statistics obtained from the Chrome browser. According to those stats, service workers control 19.26% of page loads in July 2021. Compared to last year’s measurement of 16.6%, this represents a yearly growth of 12% in page loads controlled by service workers.
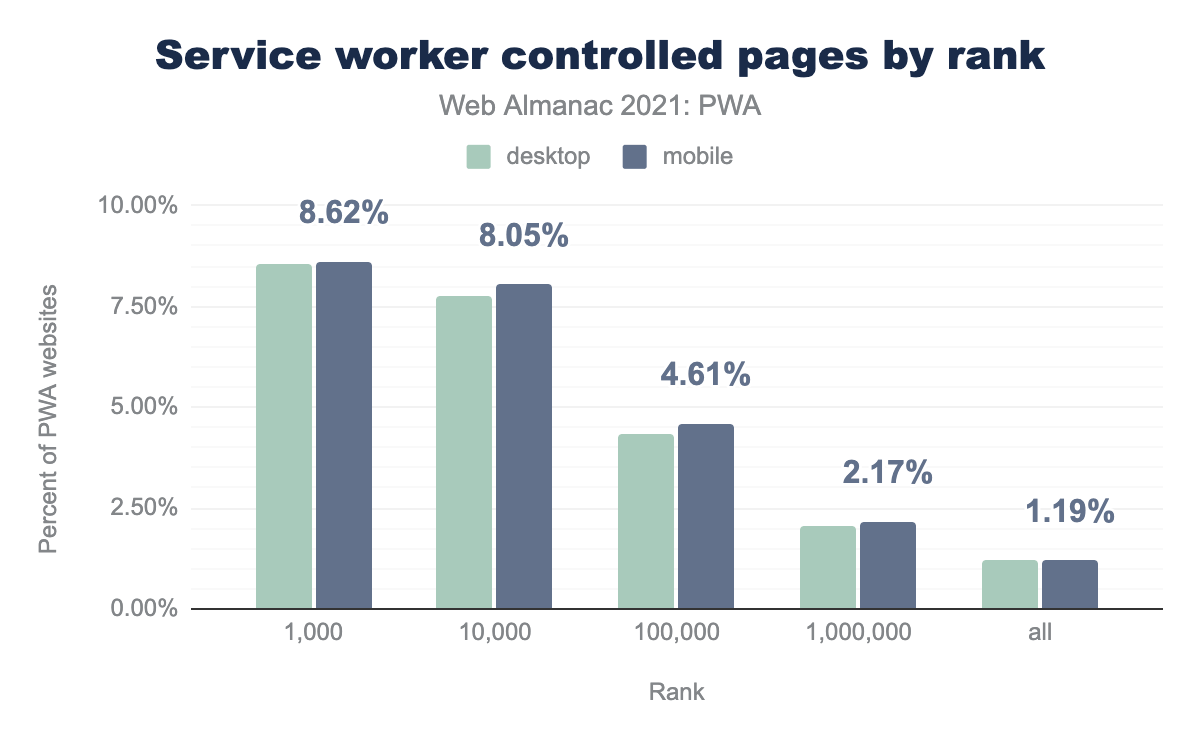
And how can we explain that approximately 3% of sites represent around 19% of the web traffic? Intuitively, one might think that high traffic websites have more reasons to adopt service workers. Having a larger user base means that users might arrive at the site from a variety of devices and connectivities, so the incentives to adopt APIs that provide performance benefits and reliability are higher. Also, these companies often have native apps, so there are more reasons to bridge the UX gap between platforms, by implementing advanced capabilities via service workers. The following data helps us prove that assumption:
When measuring the top 1,000 sites, 8.62% of them use service workers. As we broaden the number of sites under analysis, the overall percentage starts to decrease. This indicates that the most popular sites are more prone to use features like service workers and advanced capabilities.
Service worker features
In this section, we’ll analyze the adoption of various service worker features (events, properties, methods) for most common PWA tasks (offline, push notifications, background processing, etc.).
Service worker events
The ServiceWorkerGlobalScope interface represents the global execution context of a service worker and is governed by different events. One can listen to them in two ways: via event listeners or service worker properties.
For example, here are two ways of listening to the install event in a service worker:
// Via event listener:
this.addEventListener('install', function(event) {
  // …
});

// Via properties:
this.oninstall = function(event) {
  // …
};
We have measured and combined both ways of implementing event listeners and obtained the following stats:
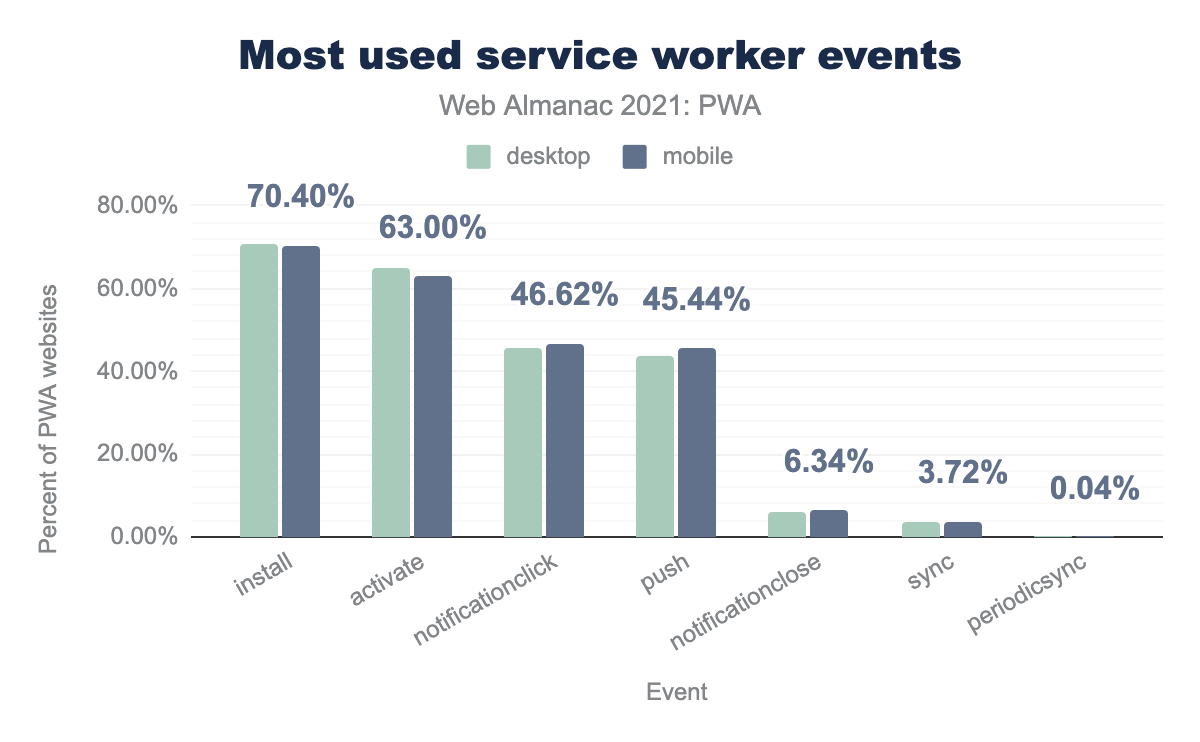
install is used by 70.73% of PWA pages, activate by 64.85%, notificationclick by 45.62%, push by 43.88%, notificationclose by 5.98%, sync by 3.75%, and periodicsync by 0.04%. For mobile install is used by 70.40% of PWA pages, activate by 63.00%, notificationclick by 46.62%, push by 45.44%, notificationclose by 6.34%, sync by 3.72%, and periodicsync by 0.04%.We can divide these events results into 3 subcategories:
- Lifecycle events
- Notification-related events
- Background processing events
Lifecycle events
The first two event listeners in the chart belong to lifecycle events. Implementing these event listeners allows you to optionally perform additional tasks when these events run. install is triggered as soon as the worker executes, and it’s only called once per service worker, allowing you to cache everything you need before the service worker takes control. activate fires once a new service worker can control clients and the old service worker is gone. This is a good time to do things such as clearing up old caches used by the previous service worker needed but that are no longer necessary.
Both event listeners have a high adoption: 70.40% of mobile and 70.73% of desktop PWAs implement an install event listener and 63.00% of mobile and 64.85% of desktop listen to activate. This is expected as the tasks that can be performed inside these events are critical for performance and reliability (for example, precaching). Reasons for not listening to lifecycle events include: using service workers only for notifications (without any caching strategy) or applying caching techniques only to requests made by the site while it is running, a technique called runtime caching which is frequently (but not exclusively) used in combination with precaching techniques.
Notification-related events
As shown in Figure 16.4 the next group of event listeners in popularity are push, notificationclick and notificationclose, which are related to Web Push Notifications. The most widely adopted is push, which lets you listen for push events sent by the server, and it is used by 43.88% of desktop and 45.44% of mobile sites with service workers. This demonstrates how popular web push notifications are in PWAs even when they are not yet available in all browsers.
Background processing events
The last group of events in Figure 16.4 allow you to run certain tasks in service workers in the background, for example, to synchronize data or retry tasks when the connectivity fails. Background Sync (via sync event listener) allows a web app to delegate a task to the service worker and automatically retry it if it fails or there’s no connectivity (in which case the service worker waits for connectivity to be back to automatically retry). Periodic Background Sync (via periodicSync) allows running tasks at periodic intervals in the service worker (for example, fetching and caching the top news every morning). Other APIs like Background Fetch, don’t show up in the chart, as their usage is still quite low.
As seen, background sync techniques don’t have wide adoption yet compared to the others. This is in part because use cases for background sync are less frequent, and the APIs are not yet available across all browsers. Periodic Background Sync also requires the PWA to be installed for it to be used, which makes it unavailable for sites that don’t provide “add to home screen” functionality.
Despite that, there are some important reasons for using background sync in modern web apps: one of them being offline analytics (Workbox Analytics uses Background Sync for this), or retrying failed queries due to lack of connectivity (as some search engines do).
Other popular service worker features
Besides event listeners, there are other important service worker functionalities that are interesting to call out, given their usefulness and popularity.
The following two events are quite popular and frequently used in tandem:
ServiceWorkerGlobalScope.skipWaiting()Clients.claim()
ServiceWorkerGlobalScope.skipWaiting() is usually called at the beginning of the install event and allows a newly installed service worker to immediately move to the active state, even if there’s another active service worker. Our analysis showed that it is used in 60.47% of desktop and 59.60% of mobile PWAs.
skipWaiting().
Clients.claim() is frequently used in combination with skipWaiting(), and it allows active service workers to “claim control” of all the clients under its scope. Appears in 48.98% of desktop pages and 47.14% of mobile.
clients.claim().
Combining both of the previous events means that a new service worker will immediately come into effect, replacing the previous one, without having to wait for active clients (for example, tabs) to be closed and reopen at a later point (for example, a new user session), which is the default behavior. Developers find this technique useful to ensure that every critical update goes through immediately, which explains its wide adoption.
Another interesting aspect to analyze are caching operations, which are frequently used in service workers and are at a core of a PWA experience, since they enable features like offline and help improving performance. The ServiceWorkerGlobalScope.caches property returns the CacheStorage object associated with a service worker allowing access to the different caches. We’ve found that it is used in 57.41% desktop and in 57.88% mobile sites that use service workers.
Its high usage is not unexpected as caching allows for reliable and performant web applications, which is often one of the main reasons why developers work on PWAs.
Finally, it’s worth taking a look at Navigation Preloads, which allows you to make the requests in parallel with the service worker boot-up time to avoid delaying the requests in those situations. The NavigationPreloadManager interface provides a set of methods to implement this technique, and according to our analysis, it is currently used in 11.02% of desktop and 9.78% of mobile sites that use service workers.
Navigation Preloads counts with a decent level of adoption, despite the fact that it’s not yet available in all browsers. It’s a technique that many developers could benefit from, and they can implement it as a progressive enhancement.
Web App Manifests
The Web App Manifest is a JSON file that contains metadata about a web application and it’s one of the main components of a PWA, as publishing a web app manifest is one of the preconditions to provide the “add to home screen” functionality, which allows users to install a web app on their device. Other conditions include serving the site via HTTPS, having an icon, and in some browsers (like Chrome and Edge), having a service worker. Take into account that different browsers have different criteria for installation.
Here are some usage stats about Web App Manifests. It’s useful to visualize them along with the service worker ones, to start having an idea of the potential percentage of “installable” web applications:
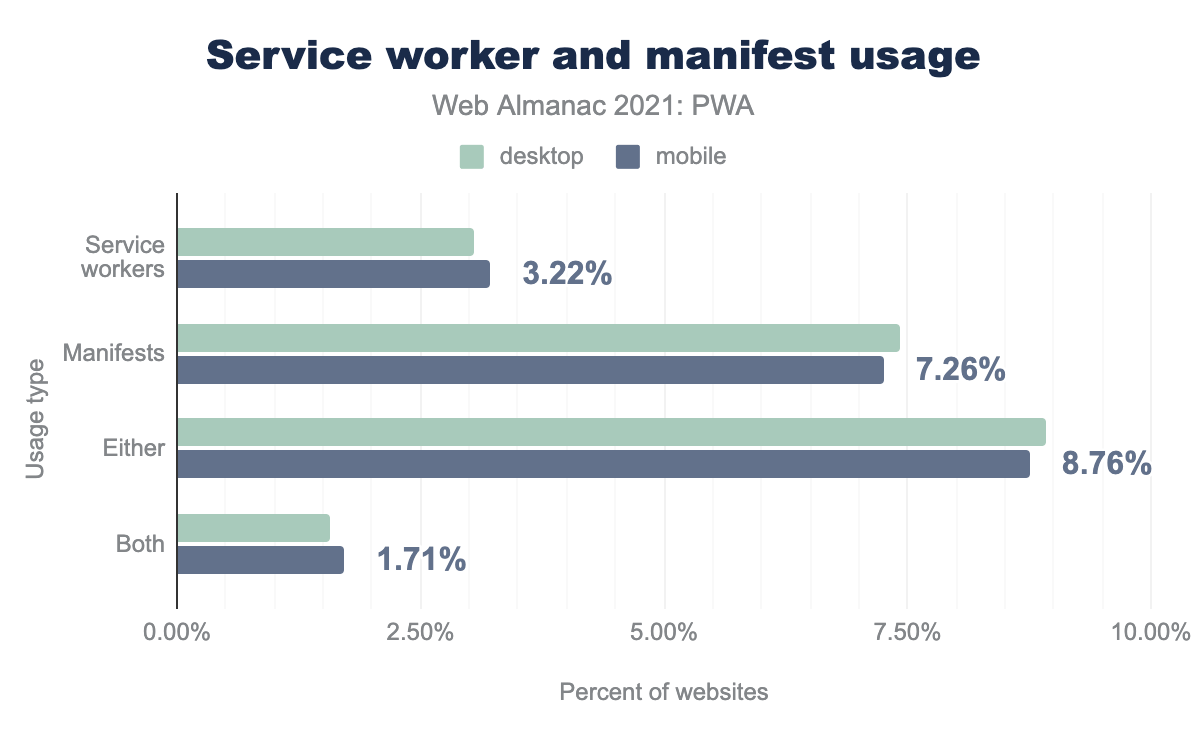
Manifests are used on more than twice as many pages as service workers. One of the reasons being that some platforms (like CMSs) automatically generate manifest files for sites, even those without service workers.
On the other hand, service workers can be used without a manifest. For example, some developers might want to add push notifications, caching or offline functionality to their sites, but might not be interested in installability, and therefore, not create a manifest.
In the figure above, we can see that 1.57% of desktop and 1.71% of mobile sites have both a service worker and a manifest. This is a first approximation to the potential percentage of “installable” websites.
Besides having a web app manifest and service worker, the content of the manifest also needs to meet some additional installability criteria for a web application to be installable. We’ll analyze each of its properties next.
Manifest properties
The following chart shows the usage of standard manifest properties, in the group of sites that also have a service worker.
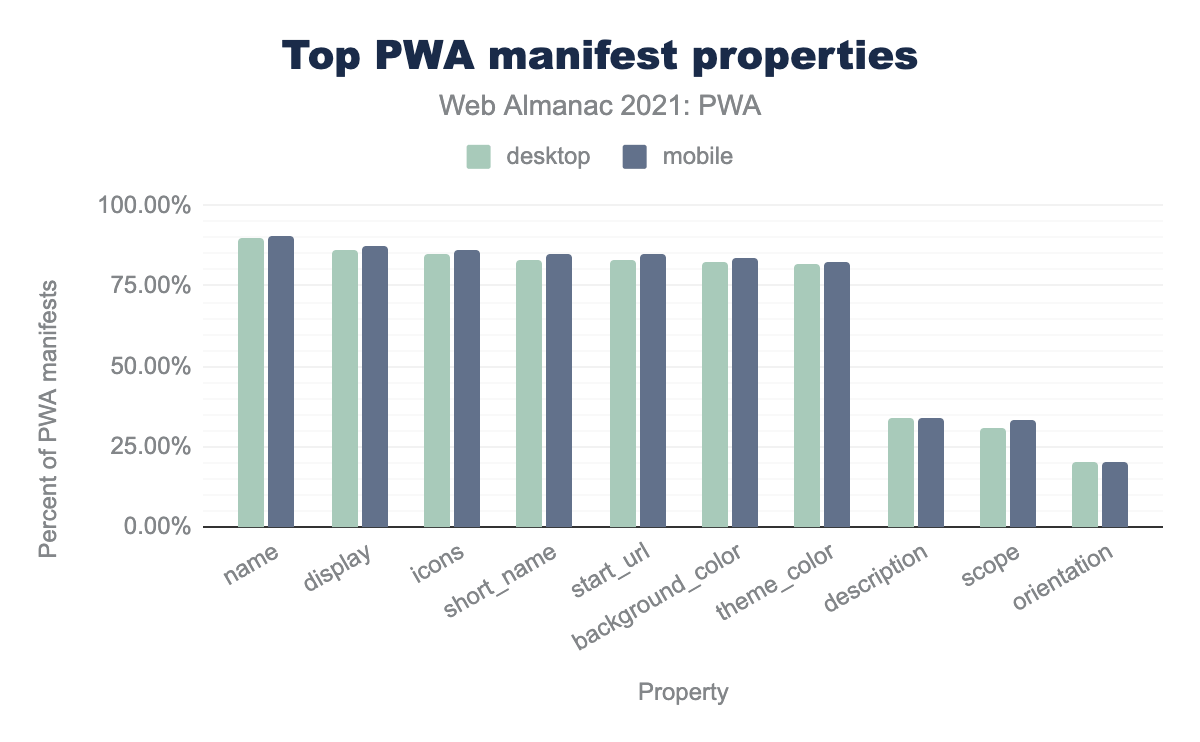
name is used by 94.78% of desktop PWA manifests and 94.61% of mobile, icons by 92.22% and 92.18% respectively, display by 72.77% and 74.27%, theme_color by 70.64% and 71.64%, background_color by 67.87% and 69.53%, short_name by 64.57% and 63.64%, start_url by 37.27% and 42.35%, description by 11.86% and 12.59%, scope by 10.20% and 11.66%, and finally orientation by 8.71% and 12.16%.This chart is interesting when combined with the Lighthouse Installable Manifests criteria. Lighthouse is a popular tool to analyze the quality of websites and, as we’ll see in the Lighthouse Insights section, 61.73% of PWA sites have an installable manifest based on these criteria.
Next we’ll analyze each of the Lighthouse installability requirements, one by one, according to the previous chart:
- A
nameorshort_name: Thenameproperty is present in 90% of sites, while theshort_nameappears on 83.08% and 84.69% of desktop and mobile sites respectively. The high usage of these properties makes sense as both are key attributes: thenameis displayed in the user’s home screen, but if it’s too long or the space in the screen is too small, theshort_namemight end up being displayed instead. icon: This property appears in 84.69% of desktop and 86.11% of mobile sites. Icons are used in various places: the home screen, the OS task switcher, etc. This explains its high adoption.start_url: This property exists in 82.84% of desktop and 84.66% mobile sites. This is another important property for PWAs, as it indicates what URL will be opened when the user launches the web application.display: This property is declared in 86.49% of desktop and 87.67% of mobile sites. It’s used to indicate the display mode of the website. If it’s not indicated, the default value isbrowser, which is the conventional browser tab, so most PWAs declare it to indicate that it should be opened instandalonemode instead. The ability to open in standalone mode is one of the things that help create an “app-like” experience.prefer_related_applications: This property appears in 6.87% of desktop and 7.66% of mobile sites, which seems like a low percentage compared to the rest of the properties in this list. The reason is that Lighthouse doesn’t require it to be present, it only suggests against having it set with a value oftrue.
Next, we’ll dig deeper into the properties that allow us to define a set of values. To understand which ones are the most widely used.
Top manifest icon sizes
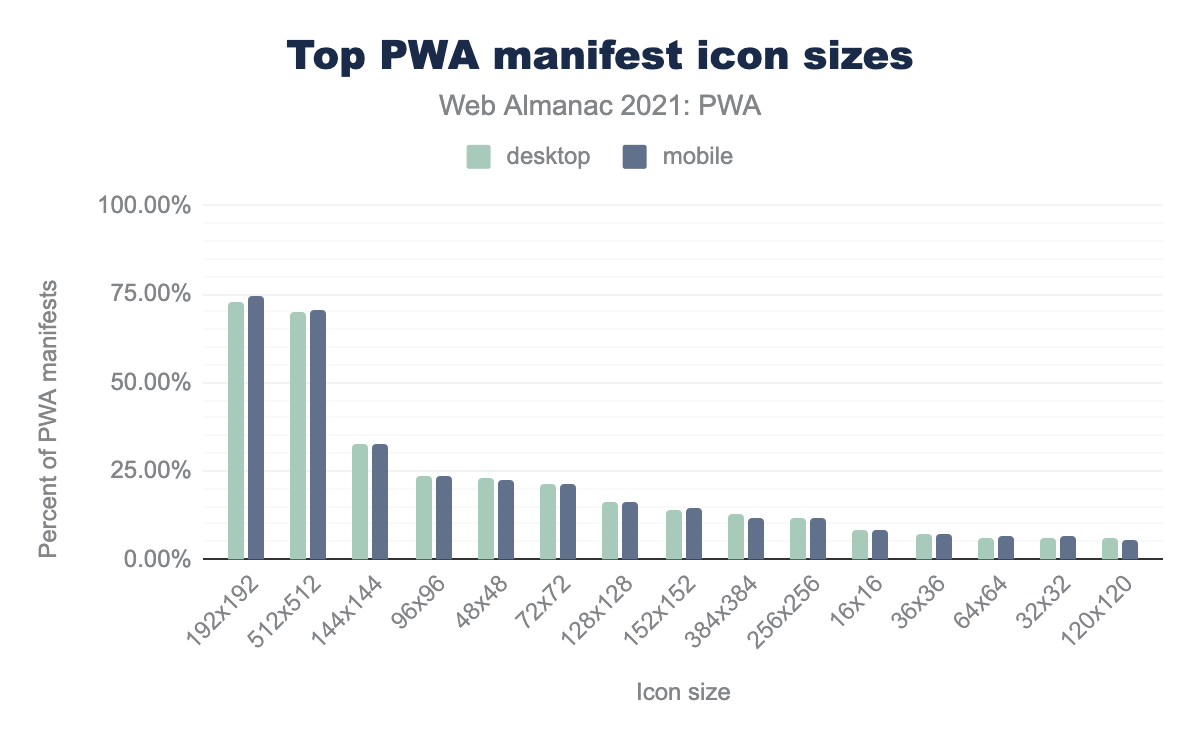
192x192 is used by 72.58% of desktop PWA sites and 74.20% mobile, 512x512 by 70.09% and 70.36% respectively,144x144 by 32.76% and 32.59%, 96x96 by 23.73% and 23.39%, 48x48 by 23.10% and 22.50%, 72x72 by 21.03% and 21.30%, 128x128 by 16.19% and 16.30%, 152x152 by 14.11% and 14.52%, 384x384 by 12.93% and 11.84%, 256x256 by 11.73% and 11.86%, 16x16 by 8.10% and 8.32%, 36x36 by 7.36% and 7.01%, 64x64 by 6.18% and 6.38%, 32x32 by 6.05% and 6.37%, and finally 120x120 by 6.14% and 5.61%.The most popular icon sizes, by far, are: 192x192 and 512x512, which are the sizes that Lighthouse recommends. In practice, developers also provide a variety of sizes, to make sure that they look good on various device screens.
Top manifest display values
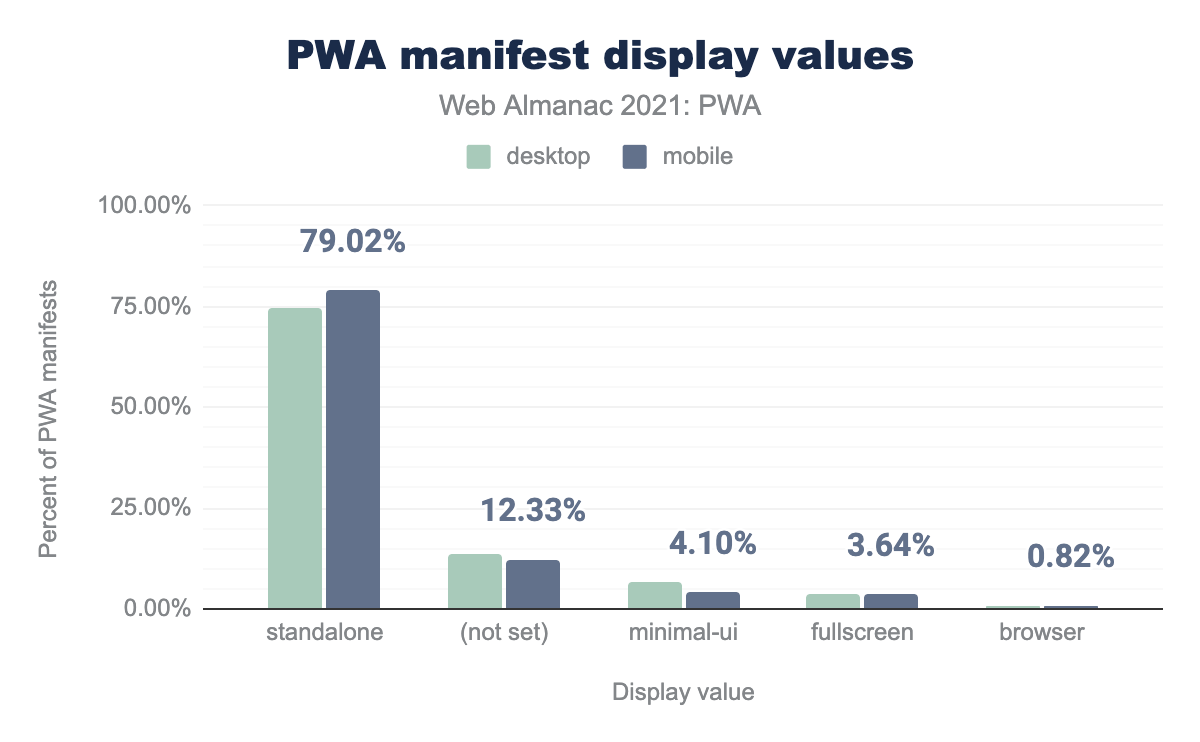
standalone is used by 74.83% of desktop PWA pages, and 79.02% of mobile, (not set) by 13.51% and 12.33% respectively, minimal-ui by 6.89% and 4.10%, fullscreen by 3.74% and 3.64%, and finally browser by 0.92% and 0.82%.The display property determines the developer’s preferred mode for the website. The standalone mode makes installed PWAs open without any browser UI element, making it “feel like an app”. The chart shows that the most sites with a service worker and manifest uses this value: 74.83% on desktop and 79.02% on mobile.
Manifests preferring native
Finally, we’ll analyze prefer_related_applications. If the value of this property is set to true, the browser might suggest installing one of the related applications instead of the web app.
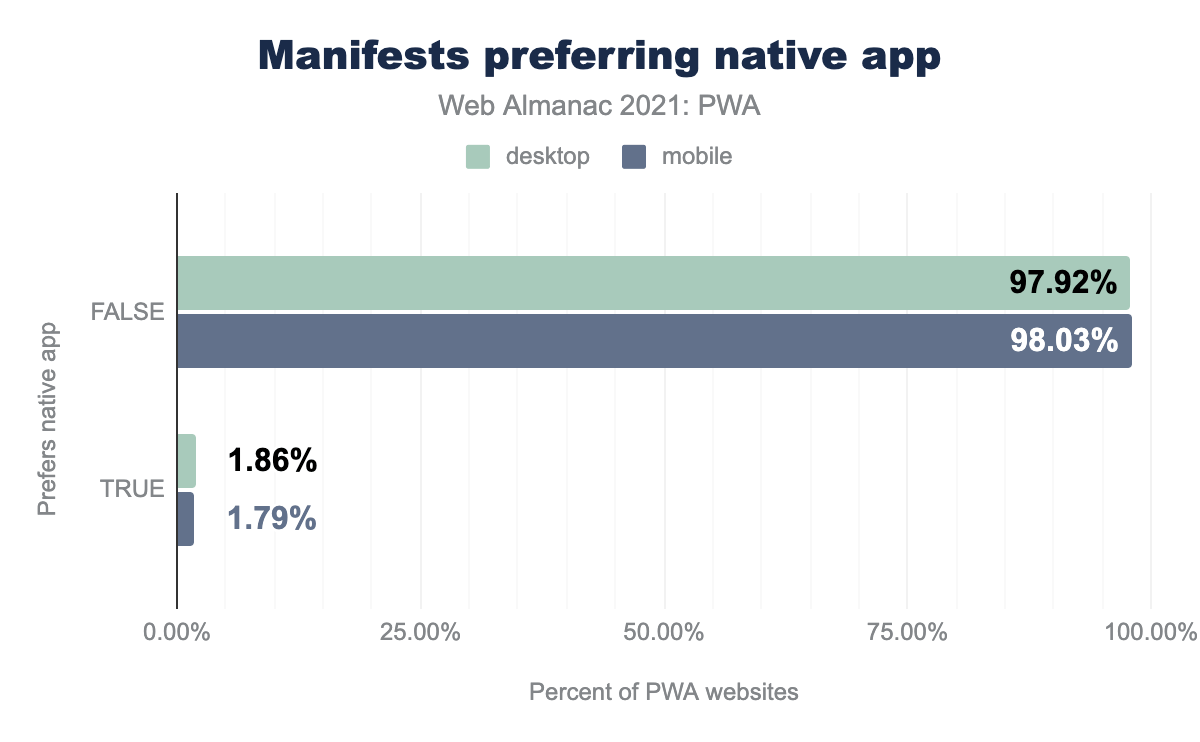
false, and only 1.86% of desktop pages, and 1.79% of mobile pages having it set to true.prefer_related_applications appears only in 6.87% of desktop and 7.66% of mobile sites. The chart shows that 97.92% of desktop and 93.03% of mobile sites that defined this property have a value of false. This indicates that most PWA developers prefer to offer the PWA experience rather than a native app.
Despite the fact that the vast majority of PWA developers prefer promoting their PWA experiences to native applications, some well-known PWAs (like Twitter), still prefer recommending the native app over the PWA experience. This might be due to a preference of the teams building these experiences, or some specific business needs (lack of some API in the web).
Top manifest categories
In last year’s PWA chapter we included a section about manifest categories, showing the percentage of PWAs per industry, based on the manifest categories property.
This year we decided not to rely on this property to determine how many PWAs of each category are out there, since the usage of this property is incredibly low (less than 1% of sites have this property set).
Given our lack of data on categories and industries using PWAs, we turn to external sources for this information. Mobsted recently published their own analysis of the use of PWAs, which analyzed the percentage of PWAs by industry, among other things:

According to Mobsted’s analysis, the most common categories are “Business & Industrial”, “Arts & Entertainment”, and “Home & Garden”.This seems to correlate with last year’s analysis of the “category” web manifest property, where the top three values were “shopping”, “business” and “entertainment”.
Lighthouse insights
In the manifest properties section we mentioned the installability requirements that Lighthouse has on web app manifest files. Lighthouse also provides checks for other aspects that make a PWA. It should be noted that the HTTP Archive currently only runs the Lighthouse tests as part of its mobile crawl, as noted in our Methodology.
The following chart shows the percentage of sites that pass each criteria, where “PWA sites” contains stats for sites that have a service worker and a manifest, “All sites” contains data for all the totality sites:
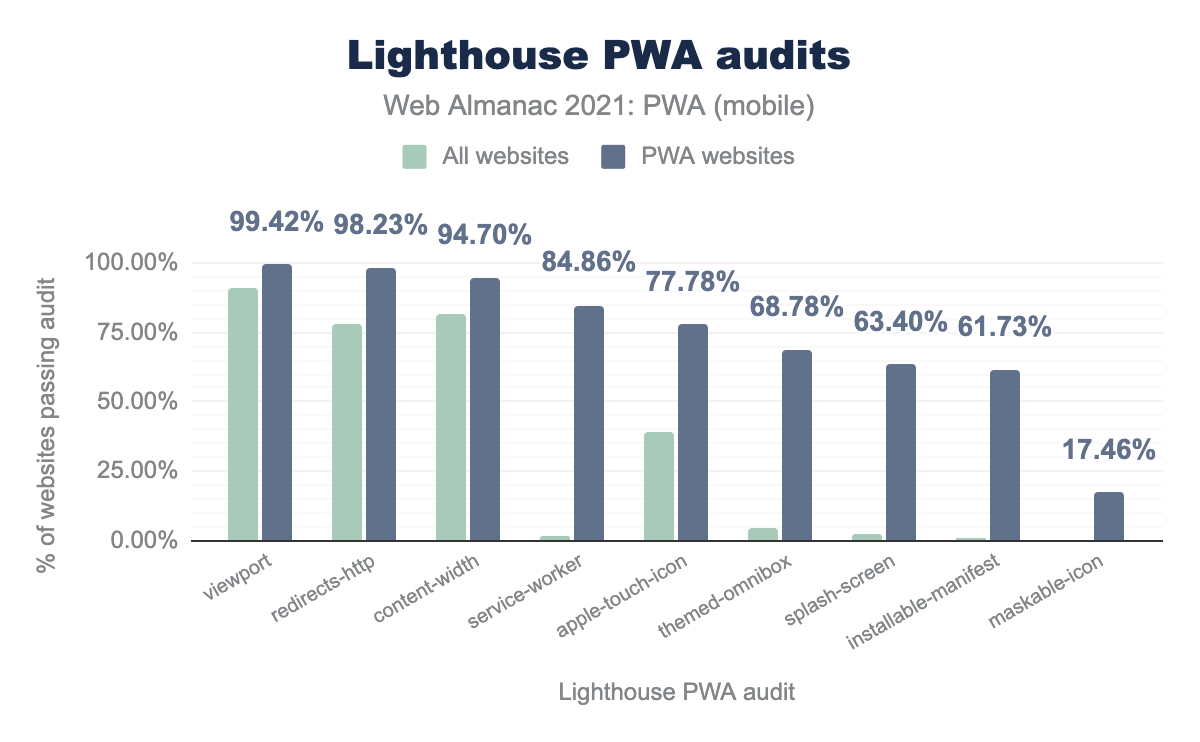
viewport audit is passed by 91.16% of all sites, and 99.42% of PWA sites, redirects-http by 78.01% and 98.23% respectively, content-width by 81.86% and 94.70%, service-worker by 1.50% and 84.86%, apple-touch-icon by 39.25% and 77.78%, themed-omnibox by 4.64% and 68.78%, splash-screen by 2.28% and 63.40%, installable-manifest by 1.08% and 61.73%, maskable-icon by 0.38% and 17.46%.As expected, the table shows that the group of sites that we have identified as PWAs (those having a service worker and manifest) tend to pass each Lighthouse PWA audit. While some audits that are non-PWA specific (for example, setting viewports, or redirecting HTTP to HTTPS) are scored highly by all sites, there is a distinct difference for the PWA-specific audits, with these really only being used by PWA sites.
It’s interesting to note that maskable icons have a low pass-rate even for PWA sites compared to the rest of the PWA audits. Using maskable icons lets you enhance the look and feel of icons in Android devices, making them fill up the entire shape assigned to it (like a responsive feature for icons). This feature is optional and mostly interesting for PWAs that offer an installable experience. Unlike other PWA features (like offline), sites that are not PWAs will rarely be interested in it.
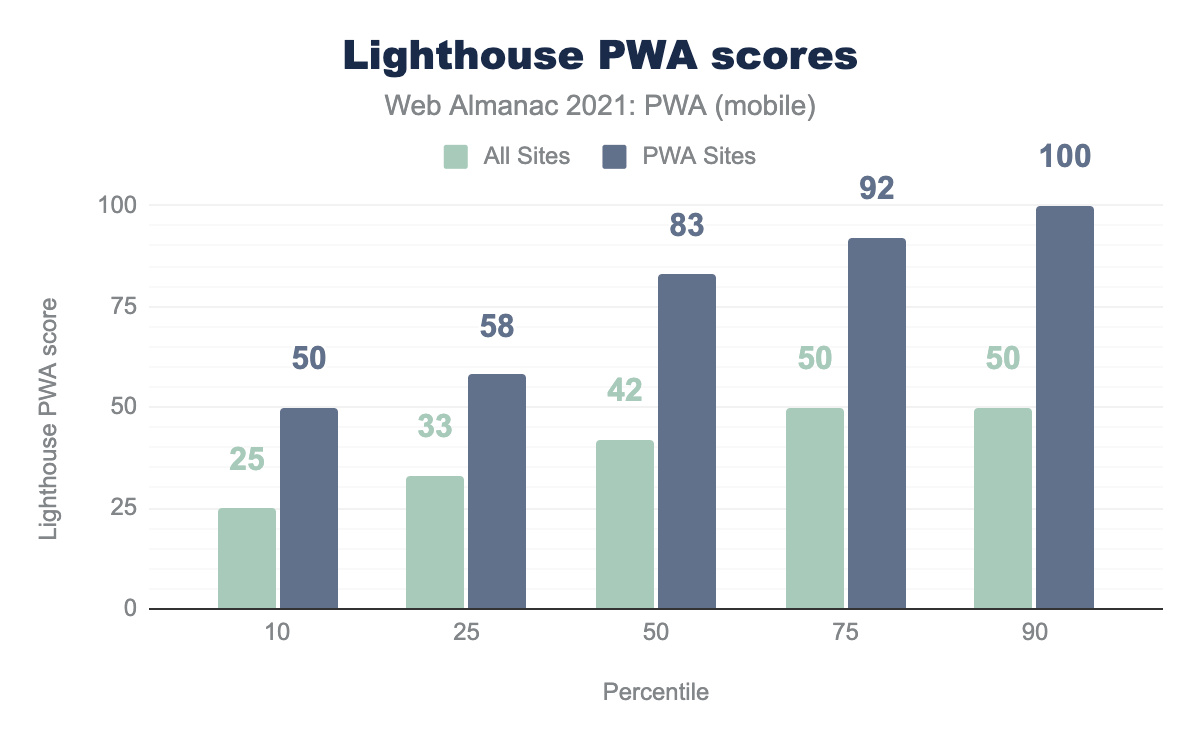
Lighthouse also provides a PWA score, based on the “pass rate” of all these audits. The following chart compares the resulting scores among the two groups analyzed before:
Here are some observations:
- The median score for “PWA sites” is 83, versus 42 for “All sites”.
- At the top end we see that for the “PWA sites”, at least 10% score the maximum (100) score for PWA. When looking at “All sites” the 75th and 90th percentile reach a value of, at most, 50.
- Taking a look at the lower end of the chart, 90% of “PWA sites” have a Lighthouse PWA score of, at least 50, compared to 25 when we look across all sites.
Once again, the difference between both groups is expected, as “PWA sites” are naturally prone to pass the PWA-specific requirements more often than “All sites”. In any case, the median score of 83 for PWA sites, suggests that a good portion of PWA developers are aligned with best practices.
Service worker libraries
Service workers can use libraries to take care of common tasks, functionalities and best practices (e.g., to implement caching techniques, push notifications, etc.). The most common way of doing this is by using importScripts(), which is the way of importing JavaScript libraries in workers. In other cases, build tools can also inject the code of libraries directly into service workers at build time.
Take into account that not all libraries can be used in worker contexts. Workers don’t have access to the Window, and therefore, the Document object, and have limited access to browser APIs. For that reason, service worker libraries are specifically designed to be used in these contexts.
In this section we’ll analyze the popularity of various service worker libraries.
Popular import scripts
The following chart shows the percentage of usage for the various libraries imported via importScripts().
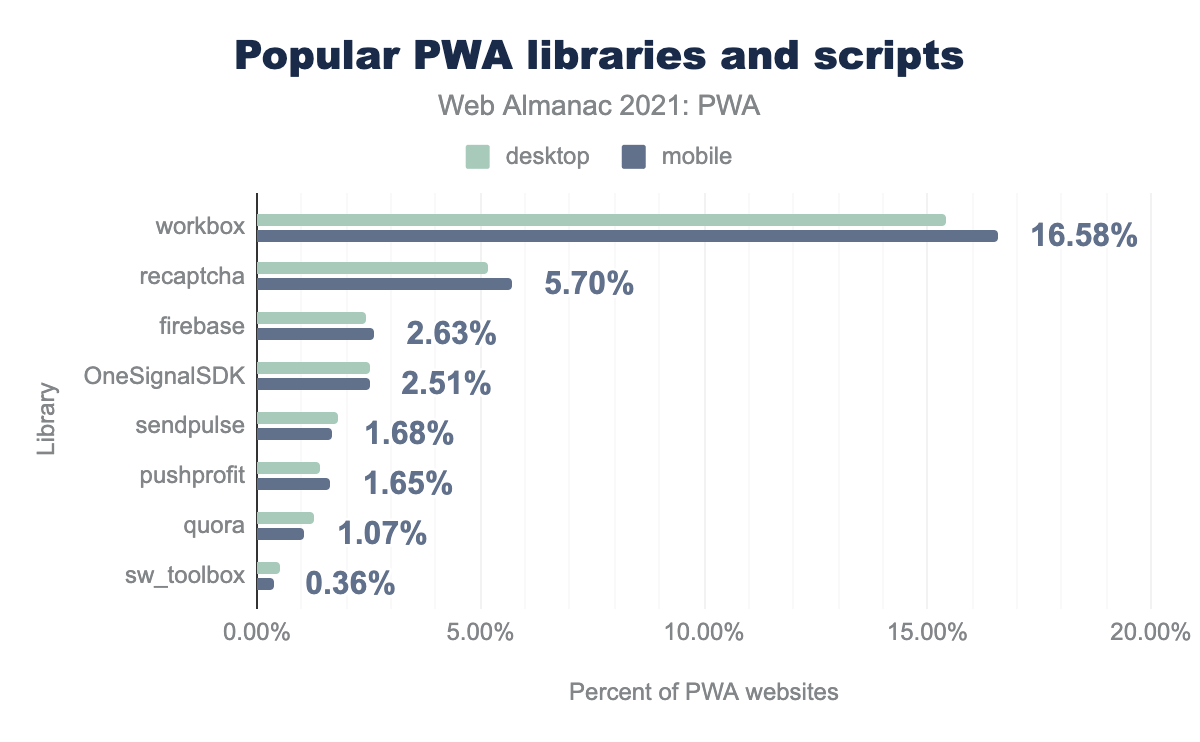
workbox dominatine at 15.43% of desktop and 16.58% of mobile, recaptcha at 5.19% and 5.70% respectively, firebase at 2.45% and 2.63%, OneSignalSDK at 2.53% and 2.51%, sendpulse at 1.83% and 1.68%, pushprofit at 1.42% and 1.65%, quora at 1.28% and 1.07%, and finally sw_toolbox by 0.51% on desktop and 0.36% on mobile.Workbox is still the most popular library, being used by 15.43% of desktop and 16.58% of mobile sites with service workers, although this may be interpreted as a proxy for Workbox adoption in general. The next section takes a more holistic and accurate approach to measuring adoption.
It’s also important to note that the Workbox predecessor sw_toolbox, which had 13.92% of usage in desktop and 12.84% in mobile last year dropped to 0.51% and 0.36% respectively this year. This is in part due to the fact that sw_toolbox was deprecated in 2019. It might have taken some time for some popular frameworks and build tools to remove this package, so we are seeing the drop in adoption more clearly this year. Also, our measurement has changed compared to 2020, by adding more sites, which made this metric decrease even more, making it difficult to do a direct year on year comparison.
Workbox usage
Workbox is a set of libraries that packages a set of common tasks and best practices for building PWAs. According to the previous chart, Workbox is the most popular library in service workers. So, let’s take a closer look at how it’s used in the wild.
Starting with Workbox 5, the Workbox team has encouraged developers to create custom bundles of the Workbox runtime instead of using importScripts() to load workbox-sw (the runtime). The Workbox team will continue supporting workbox-sw, but the new technique is now the recommended approach. In fact, the defaults for the build tools have switched to prefer that method.
Based on that, we measured sites using any type of Workbox features and found that the number of sites with service workers using it is much higher than noted above: 33.04% of desktop and 32.19% of mobile PWAs.
Workbox versions
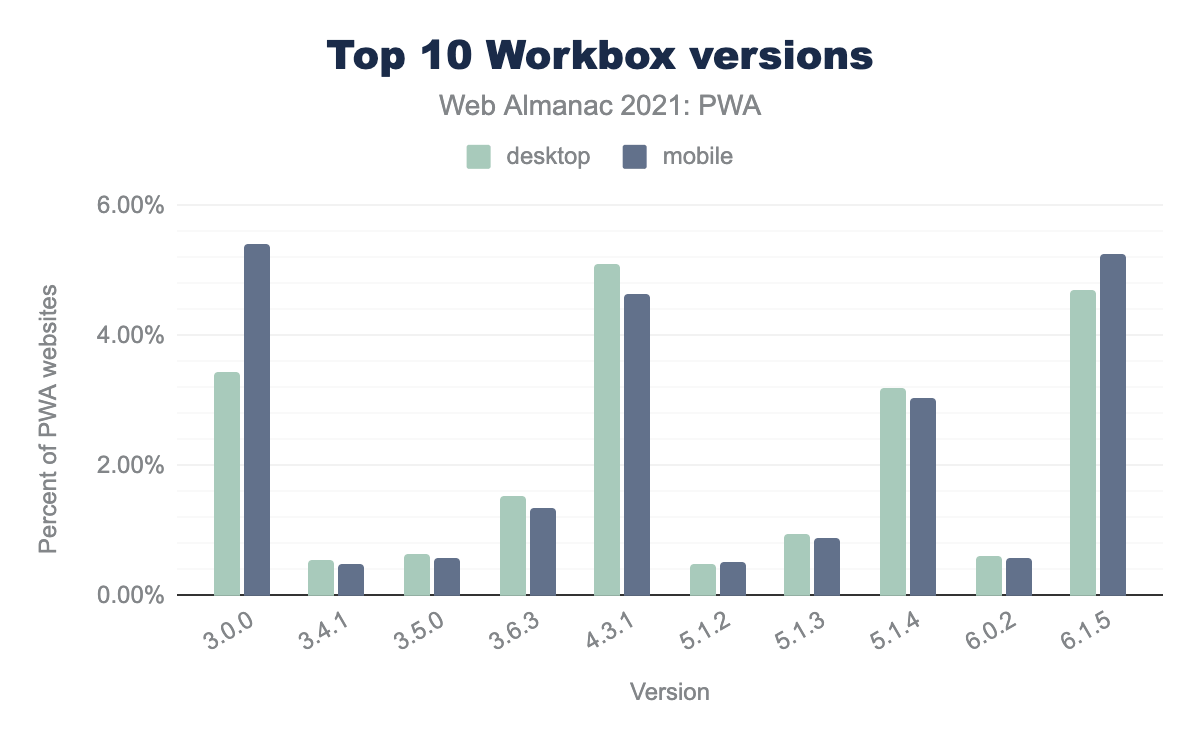
The chart shows that version 6.1.15 has the highest level of adoption compared to others. That version was released on April 13th, 2021, and was the latest version at the time of our crawl in July 2021.
There were more versions released since that time, and based on the behavior observed on the chart, we expect them to become the most widely used shortly after being launched.
There are also older versions that still count with wide adoption. The reason for that is that some popular tools have adopted older Workbox versions in the past and continue providing it, namely:
- Version 4.3.1 usage is mostly driven by create-react-app version 3.
- Version 3.0.0 similarly, is included in create-react-app version 2.
Workbox packages
The Workbox library is provided as a set of packages or modules that contain specific functionalities. Each package serves a specific need and can be used together or on its own.
The following table shows the usage of Workbox of the most popular packages:
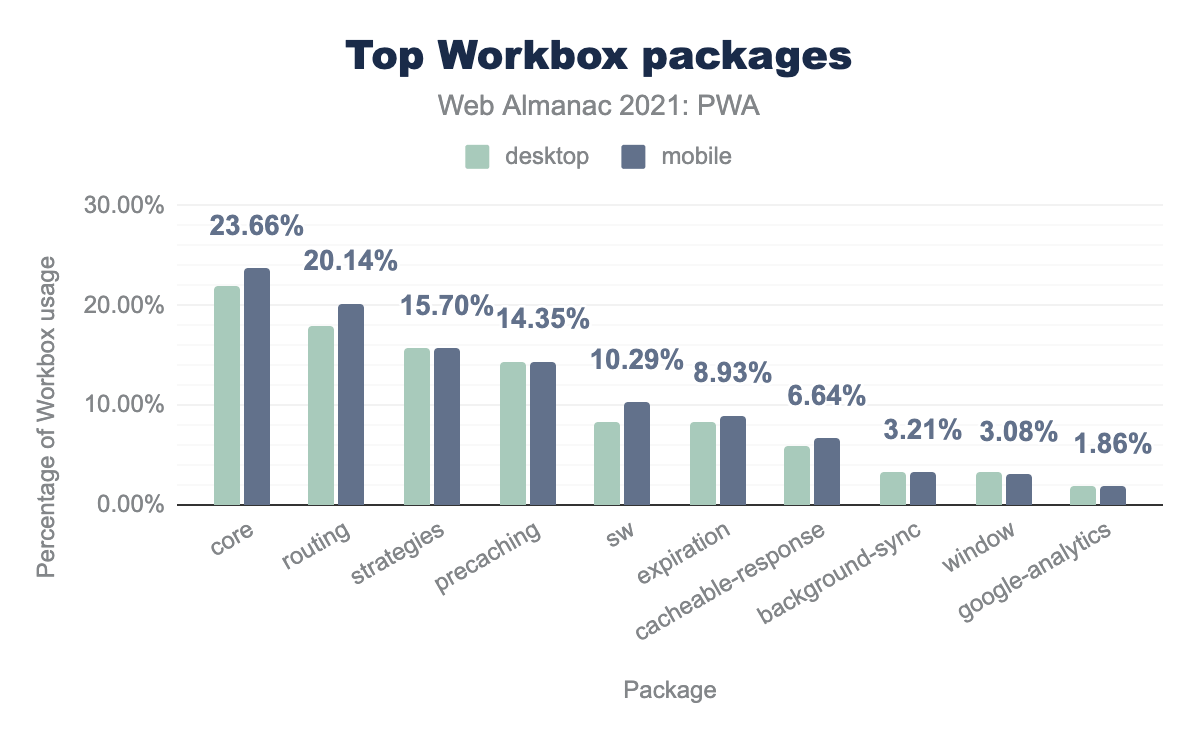
core is used by 21.96% of desktop Workbox usage and 23.66% of mobile, routing by 17.88% and 20.14%, strategies by 15.82% and 15.70%, precaching by 14.41% and 14.35%, sw by 8.38% and 10.29%, expiration by 8.30% and 8.93%, cacheable-response by 5.87% and 6.64%, background-sync by 3.27% and 3.21%, window by 3.36% and 3.08%, and finally google-analytics by 1.91% and 1.86%.The chart above shows that the following packages are the four most widely used:
- Workbox Core: This package contains the common code that each Workbox module relies on (for example, the code to interact with the console and throw meaningful errors). That’s why it’s the most widely used.
- Workbox Routing: This package allows to intercept requests and respond to them in different ways. It’s also a very common task inside a service worker, so it’s quite popular.
- Workbox Precaching: This package allows sites to save some files to the cache while the service worker is installing. This set of files usually constitute the “version” of a PWA (similar to the version of a native app).
- Workbox Strategies: Unlike precaching, which takes place at the service worker “install” event, this package enables runtime caching strategies to determine how a service worker generates a response after receiving a
fetchevent.
Workbox strategies
As mentioned, Workbox provides a set of built-in strategies to respond to network requests. The following chart helps us see the adoption of the most popular runtime caching strategies:
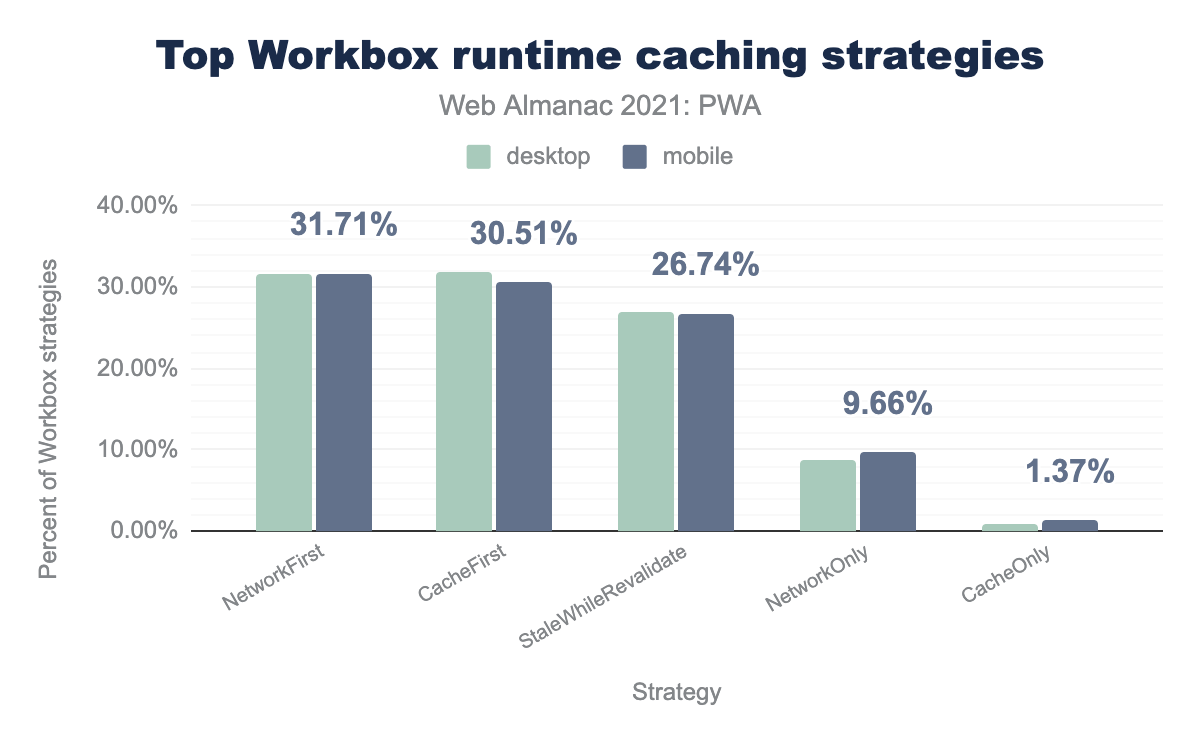
NetworkFirst is the caching strategy 31.52% of the time on desktop and 31.71% on mobile, CacheFirst by 31.72% and 30.51%, StaleWhileRevalidate by 27.03% and 26.74%, NetworkOnly by 8.81% and 9.66%, and finally CacheOnly by 0.92% and 1.37%.
NetworkFirst, CacheFirst and Stale While Revalidate are, by far, the most widely used. These strategies let you respond to requests by combining the network and the cache in different ways. For example: the most popular runtime caching strategy: NetworkFirst will try to fetch the latest response from the network. If the result is successful, it will put the result in the cache. If the network fails, the cache response will be used.
Other strategies, like NetworkOnly and CacheOnly will resolve a fetch() request by going either to the network or cache, without combining these two options. This might make them less attractive for PWAs, but there are still some use cases where they make sense. For example, they can be combined with plugins to extend their functionality.
Web Push notifications
Web Push notifications are one of the most powerful ways of keeping users engaged in a PWA. They can be sent to mobile and desktop users and can be received even when the web app is not in the foreground or even opened (either as a standalone app or in a browser tab).
Here are some usage stats for some most popular notification-related APIs:
Pages subscribe to notifications via the PushManager interface of the Push API, which is accessed via the pushManager property of the ServiceWorkerRegistration interface. It’s used by 44.14% of desktop and 45.09% of mobile PWAs.
pushManager property.
Also as shown in Figure 16.4 related to service worker events, the push event listener, which is used to receive push messages, is used by 43.88% of desktop and 45.44% of mobile PWAs.
The service worker interface also allows listening to some events to handle user interactions on notifications. Figure 16.4 shows that notificationclick (which captures clicks on notifications) is used by 45.64% of desktop and 46.62% of mobile PWAs. notificationclose is used less frequently: 5.98% of desktop and 6.34% of mobile PWAs. This is expected as there are fewer use cases where it makes sense to listen for the notification “close” event, than for notification “clicks”.
Web Push notification acceptance rates
For a notification to be useful it has to be timely, precise, and relevant. At the moment of showing the prompt to request permission, the user needs to understand the value of the service. Good notification updates have to provide something useful to the users and related to the reason why the permission was granted.
The following chart comes from the Chrome UX Report and shows the acceptance rates for notifications permission prompts:
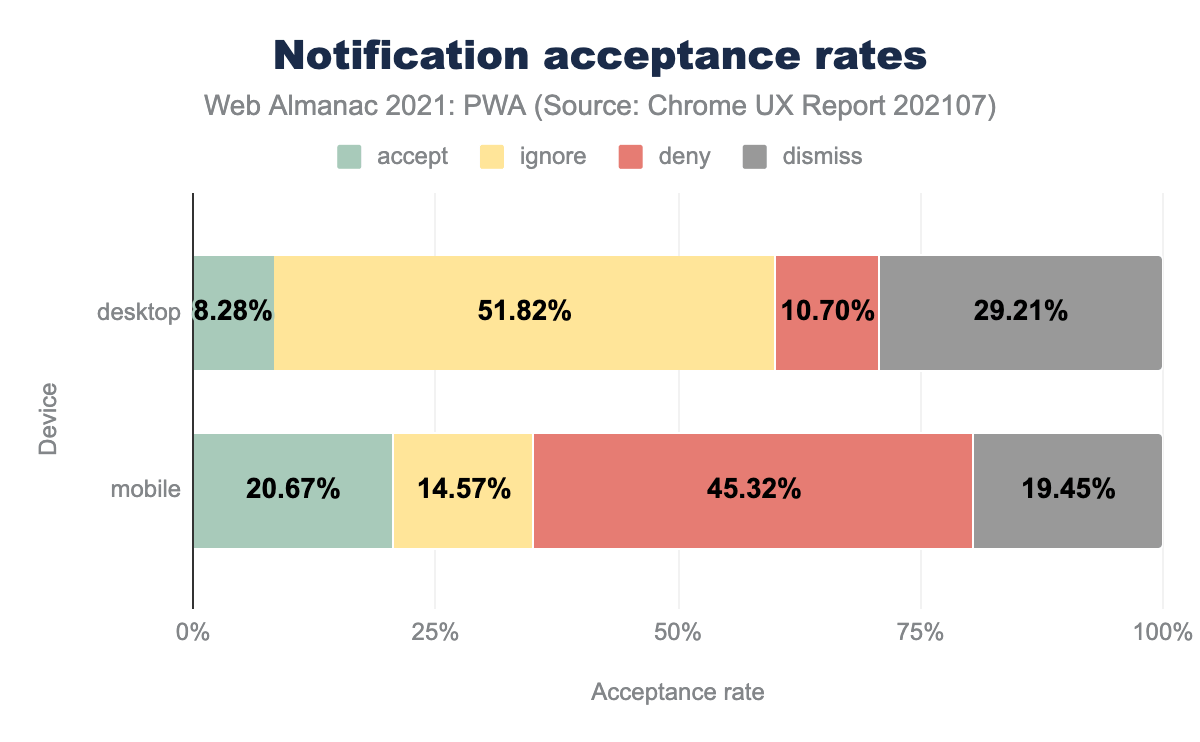
accept is 8.28%, ignore is 51.82%, deny is 10.70%, and dismiss 29.21%. On mobile accept is 20.67%, ignore is 14.57%, deny is 45.32%, and dismiss 19.45%.Mobile has a higher acceptance rate than desktop (20.67% vs 8.28%). This suggests that users tend to find mobile notifications more useful. We can attribute this to two reasons: (1) Users are more familiar with notifications on phones than on desktops, and the utility of a notification in the mobile context is more obvious and (2) the mobile UI for the notification prompt is typically more prominent.
Mobile also has a higher “deny” rate than desktop (45.32% vs 10.70%), and desktop users tend to “ignore” notifications more frequently (19.45% in mobile vs. 29.21 in desktop). The reason for this is that the mobile enrollment UI is much more intrusive than desktop, making the user more frequently decide for either accepting or rejecting the notification. Also, on Desktop devices there are situations when, if a user navigates away from the tab the prompt is dismissed, and the decision is recorded as “ignore” the space to click outside of the prompt to “ignore” the prompt is much bigger.
Distribution
An important aspect of a PWA is that it allows users to access the web experience in ways beyond typing a URL in the browser URL bar. Users can also install the web app in various ways and access it via a home screen icon. This is one of the most engaging features of native apps, that PWAs also make possible.
Ways to distribute this installable experience include:
- Prompting the user to install the PWA via the add to home screen functionality.
- Uploading the PWA to App Stores by packaging it with Trusted Web Activity (TWA) (currently available in any Android app store, including Google Play and Microsoft Store).
Next, we’ll share some stats related to these techniques, to have an idea of the usage and growth of these trends.
Add to home screen
So far, we have analyzed the pre-conditions for add to home screen, like having a service worker and an installable web app manifest.
In addition to the browser-provided install experience, developers can provide their own custom install flow directly within the app.
The onbeforeinstallprompt property of the Window object allows the document to capture the event fired when the user is about to be prompted to install a web application. Developers can then decide if they want to show the prompt directly or defer it to show it when they think it’s more appropriate.
Our analysis showed that beforeinstallprompt is being used in 0.48% of desktop and 0.63% of mobile sites that have a service worker and a manifest.
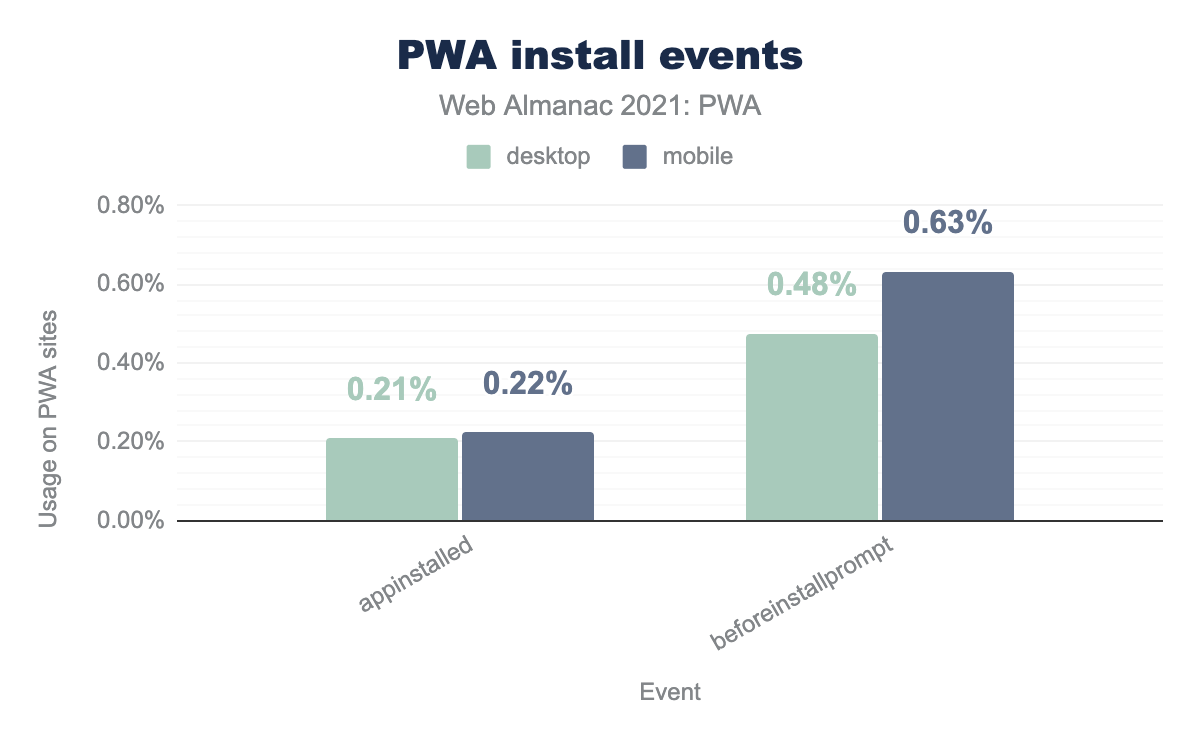
appinstalled is used by 0.21% of desktop, and 0.22% of mobile, while beforeinstallprompt is used by 0.48% of desktop and 0.63% of mobile.The BeforeInstallPromptEvent API is not yet available in all browsers, which explains the relatively low usage. Let’s take a look now at the percentage of traffic that this represents:
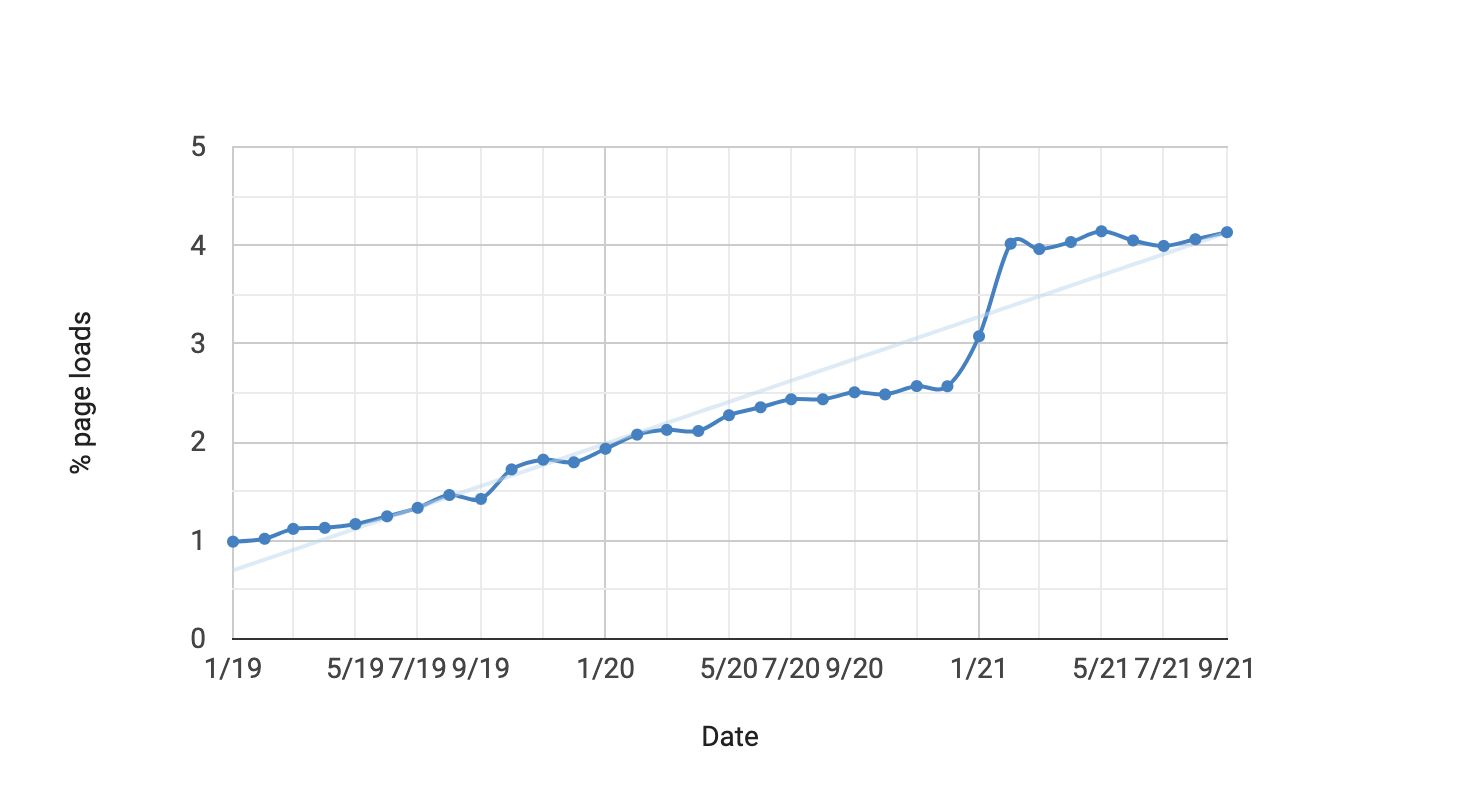
beforeinstallprompt (Source: Chrome Platform Status)
According to Chrome Platform Status, the percentage of page loads using this feature is near 4%, which suggests that some high traffic sites might be using it. Additionally, we can see that there was a 2.5 percentage point growth in adoption compared to last year.
App Store distribution
Historically, developers have built web-based mobile applications and uploaded them to App Stores as an alternative to building apps with OS-specific languages (Java or Kotlin for Android, Objective-C or Swift for iOS). The most common approach is to use a cross-platform, hybrid solution like Cordova that allows one to write the code once and generate multiple versions of it for various platforms. The resulting code usually uses the WebView to render web content, but also provides a series of non-standard APIs that can access features from the device.
WebView-based apps may look similar to native apps, but certainly there are some caveats. Since a WebView is just a rendering engine, users may have different experiences than in a full browser. The latest browser APIs might not be available and most importantly, cookies are not shareable between WebViews and browsers.
TWAs allow you to package your PWA into a native application shell and upload it to some App Stores. Unlike WebView-based solutions, a TWA is not just a rendering engine; it’s the full browser running in fullscreen mode. For that reason, it’s feature-complete and evergreen, meaning that it’s always up to date and will give you access to the latest web APIs.
Developers can package their PWAs into native apps with TWA directly, by using Android Studio, but there are several tools that make this task much easier. Next, we’ll analyze two of them: PWA Builder and Bubblewrap.
PWA Builder
PWA Builder is an open-source project that can help web developers to build Progressive Web Apps and package them for app stores like the Microsoft Store and Google Play Store. It starts by reviewing a provided URL to check for an available manifest, service worker, and SSL.
PWA Builder reviewed 200k URLs over a 3-month timeslot and discovered that:
- 75% had a manifest detected
- 11.5% had a service worker detected
- 9.6% are installable PWAs from the browser (manifest and SW and https)
Bubblewrap
Bubblewrap is a set of tools and libraries designed to help developers to create, build, and update projects for Android apps that launch PWAs using TWA.
By using Bubblewrap, developers don’t need to be aware of any details around Android tools (like Android Studio), which makes it very easy to use for web developers.
While we don’t have usage stats for Bubblewrap, there are some notable tools that are known to rely on it. For example, PWA Builder and PWA2APK are powered by Bubblewrap.
Conclusion
Six years after the term “Progressive Web Apps” was coined, the adoption of its core technologies continues to grow. Service workers will soon control 20% of web traffic, and sites continue adding more capabilities each year.
In 2021, developers have a diverse range of options to build and distribute their web applications, including tools that allow them to take on the most common tasks, and offer easy ways of uploading these experiences to app stores.
Year over year the web continues demonstrating that applications that used to be built only with OS-specific languages can be developed with web technologies and companies continue investing in bringing these app-like experiences to the web.
We hope this analysis will assist you in making more informed decisions around your PWA projects. We are looking forward to seeing how much all these trends will grow in 2022!
