PWA
Introduction
In 1990 the first ever browser called the “WorldWideWeb” was launched and ever since, the web and the browser have been evolving. For the web to progress itself into native application behavior is a big win especially in this era of mobile domination. URLs and web browsers have provided a ubiquitous way to distribute information and so a technology which provides native app capabilities to the browser is a game changer. Progressive Web Apps provide such advantages for the web to compete with other applications.
Simply put, a web application which give native-like application experience can be considered as a PWA. It is built using common web technologies including HTML, CSS and JavaScript and can operate seamlessly across devices and environments on a standards-compliant browser.
The crux of a progressive web app is the service worker, which can be thought of as a proxy sitting between the browser and user. A service worker gives the developer total control over the network, rather than the network controlling the application.
As last year’s chapter stated, it started in December 2014 when Chrome 40 first implemented the meat of what is now known as Progressive Web Apps (PWA). This was a collaborative effort for the web standards body and the term PWA was coined by Frances Berriman and Alex Russell in 2015.
In this chapter of Web Almanac we will be looking into each of the components that make PWA what it is, from a data-driven perspective.
Service workers
Service workers are at the very center of progressive web apps. They help developers control the network requests.
Service worker usage
From the data we gathered we can see that about 0.88% desktop sites and 0.87% mobile sites use a service worker. This was for the month of August 2020 and, to put that into perspective, that equates to 49,305 (out of 5,593,642) desktop sites and 55,019 (out of 6,347,919) mobile sites.
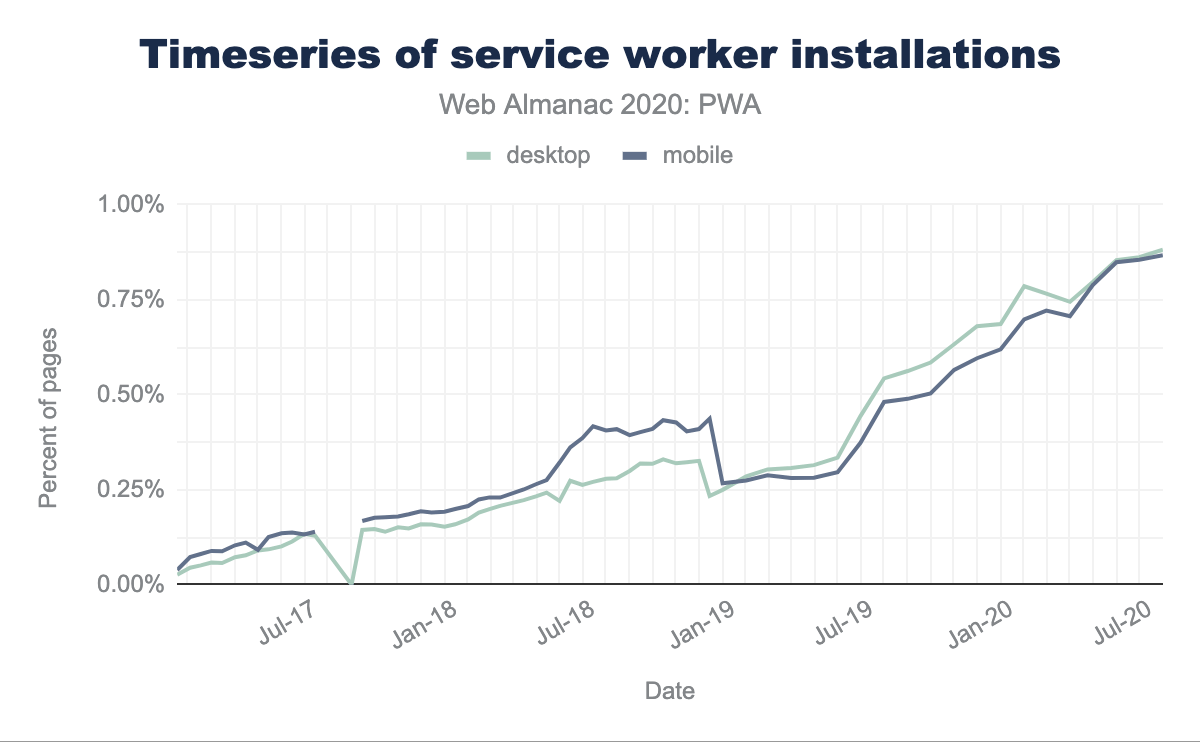
While that usage may seem low, it is important that we realize that other measurements equate that to 16.6% of the web traffic–the difference being due to high traffic websites tending to use service workers more.
Lighthouse insights
Lighthouse provides automated auditing, performance metrics, and best practices for the web and has been instrumental in shaping web’s performance. We looked at the PWA category audits gathered for over 6,782,042 pages and this has given us great insights on a few important touch points.
| Lighthouse Audit | Weight | Percentage |
|---|---|---|
load-fast-enough-for-pwa |
7 | 27.97%* |
works-offline |
5 | 0.86% |
installable-manifest |
2 | 2.21% |
is-on-https |
2 | 66.67% |
redirects-http |
2 | 70.33% |
viewport |
2 | 88.43% |
apple-touch-icon |
1 | 34.75% |
content-width |
1 | 79.37% |
maskable-icon |
1 | 0.11% |
offline-start-url |
1 | 0.75% |
service-worker |
1 | 1.03% |
splash-screen |
1 | 1.90% |
themed-omnibox |
1 | 4.00% |
without-javascript |
1 | 97.57% |
A fast page load ensures a good mobile user experience, particularly when slower cellular networks are taken into consideration. 27.56% of pages loaded fast enough for a PWA. Given how geographically distributed the web is, having a fast load time with lighter pages matter the most of the next billion users of the web, most of whom will be introduced to the internet via a mobile device.
If you’re building a Progressive Web App, consider using a service worker so that your app can work offline 0.92% of pages were offline ready.
Browsers can proactively prompt users to add your app to their home screen, which can lead to higher engagement. 2.21% of pages had an installable manifest. Manifest plays an important role in how the application starts, the looks and feel of the icon on the home screen and as an impact on the engagement rate directly.
All sites should be protected with HTTPS, even ones that don’t handle sensitive data. This includes avoiding mixed content, where some resources are loaded over HTTP despite the initial request being served over HTTPS. HTTPS prevents intruders from tampering with or passively listening in on the communications between your app and your users and is a prerequisite for service workers and many new web platform features and APIs like HTTP/2. The is-on-https check shows that 67.27% of sites were on HTTPS without mixed content and it is surprising that we haven’t reached higher yet. The Security chapter shows that 86.91% of sites are using HTTPS, suggesting that mixed content may be the bigger issue now. This number will get better as browsers mandate the applications to be on HTTPS and scrutinize those which are not on HTTPS more.
If you’ve already set up HTTPS, make sure that you redirect all HTTP traffic to HTTPS in order to enable secure connection the users without changing the URL: only 69.92% of the sites pass this audit. Redirecting all the HTTP to HTTPS on your application should be simple steps towards robustness, though the HTTP redirection to HTTPS has a decent number of sites passing, it can do better.
By adding <meta name="viewport"> tag you optimize your app for mobile screens. 88.43% of the sites have the viewport meta tag. It is not surprising that the usage of viewport meta tag is on the higher side as most developers and tools are aware of viewport optimization.
For ideal appearance on iOS, your progressive web app should define an apple-touch-icon meta tag. It must point to a non-transparent 192px (or 180px) square PNG. 32.34% of the sites pass the apple touch icon check.
If the width of your app’s content doesn’t match the width of the viewport, your app might not be optimized for mobile screens. 79.18% of the sites have the content-width set correctly.
A maskable icon ensures that the image fills the entire shape without being letterboxed when adding the progressive web app to the home screen. Only 0.11% of sites use this, but given that it is a brand new feature, having any usage here is encouraging. As it has just been introduced we were expecting the numbers to be very low and these should improve in the coming years.
A service worker enables your web app to be reliable in unpredictable network conditions. 0.77% of sites have an offline start URL to allow the app to run even when not connected to the network. This is one of the most important features for a PWA, as flaky networks are the most common issue that the users of web applications face.
The service worker is the feature that enables your app to use many Progressive Web App features, such as offline usage and push notifications. 1.05% of pages have service workers enabled. Given the powerful features that can be addressed with service workers, and that it has been supported for some time now, it is surprising that number is still so low.
A themed splash screen ensures a native-like experience when users launch your app from their home screens. 1.95% of pages had splash screens.
The browser address bar can be themed to match your site. 4.00% of pages had themed omnibox.
Your app should display some content when JavaScript is disabled, even if it is just a warning to the user that JavaScript is required to use the app. 97.57% pages show more than just a blank page with JavaScript disabled. Given that we only survey the home pages, it’s perhaps more surprising that 3.43% of sites fail this audit!
Service worker events
In a service worker one can listen for a number of events:
install, which occurs upon service worker installation.activate, which occurs upon service worker activation.fetch, which occurs whenever a resource is fetched.push, which occurs when a push notification arrives.notificationclick, which occurs when a notification is being clicked.notificationclose, which occurs when a notification is being closed.message, which occurs when a message sent via postMessage() arrives.sync, which occurs when a background sync event occurs.
We have examined which of these events are being listened to by service workers in our dataset.
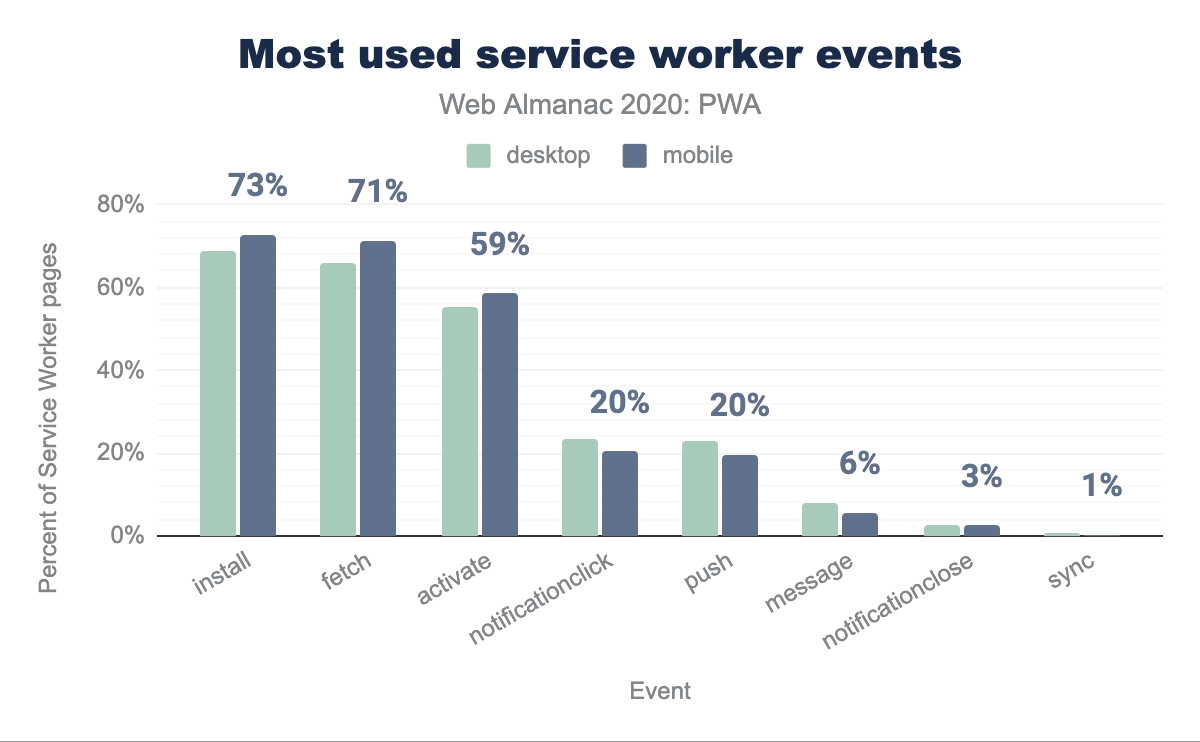
install used by 69% of desktop sites with service workers and 73% of mobile sites, fetch used by 66% and 71%, activate used by 55% and 59%, notificationclick by 24% and 20%, push by 23% and 20%, message by 8% and 6%, notificationclose by 3% for both desktop and mobile, and sync used by 1% of bothThe results for mobile and desktop are very similar with install, fetch, and activate being the three most popular events, followed by message, notification click, push and sync. If we interpret these results, offline use cases that service workers enable are the most attractive feature for app developers, far ahead of push notifications. Due to its limited availability, and less common use case, background sync doesn’t play a significant role at this time.
Web app manifests
The web app manifest is a JSON-based file that provides developers with a centralized place to put metadata associated with a web application. It dictates how the application should behave on desktop or mobile in terms of the icon, orientation, theme color and likes.
In order for a PWA to be fruitful it needs to have a manifest and a service worker. It is interesting to note that manifests are used a lot more than service workers. This is due, in large part, to the fact that CMS like WordPress, Drupal and Joomla have manifests by default.
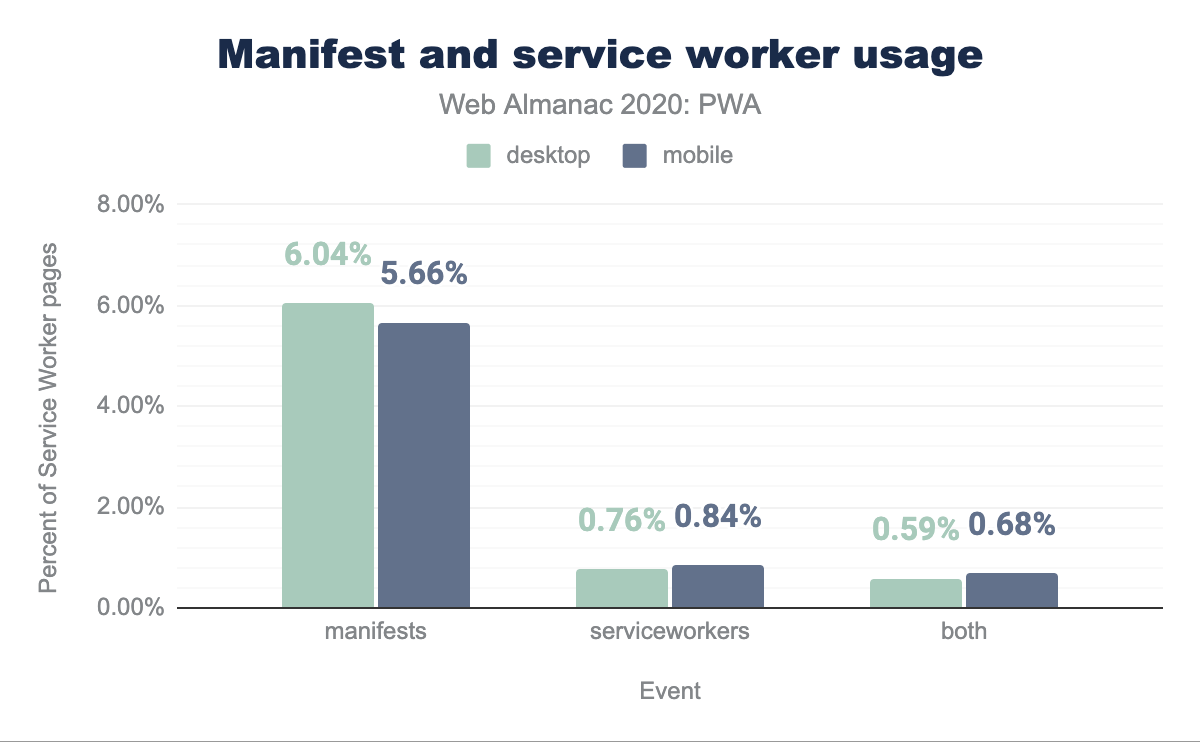
Having a web app manifest does not necessarily indicate the site is a progressive web app, as they can exist independently of service worker usage. However, as we are interested in PWAs in this chapter, we have investigated only those manifests for sites where a service worker also exists. This is different than the approach taken in last year’s PWA chapter which looked at overall manifest usage, so you may notice some differences in results this year.
Manifest Properties
Web manifest dictates the applications meta properties. We looked at the different properties defined by the Web App Manifest specification, and also considered non-standard proprietary properties.
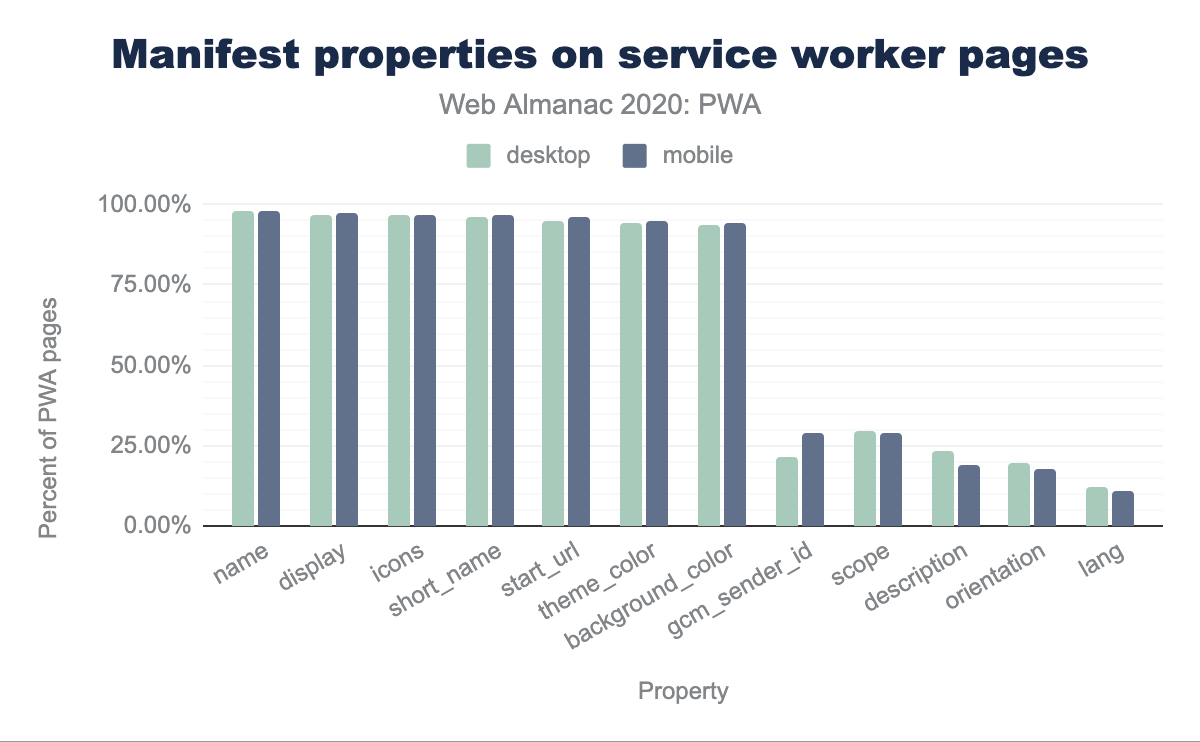
name, display, icons, short_name, start_url, theme_color, and background_color) are used by 93 to 98% of both desktop and mobile. After this there is a sharp drop off for the remaining properties with gcm_sender_id used by 21.66% of desktop sites and 28.98% of mobile sites, scope used by 29.32% of desktop and 28.77% of mobile, description used by 23.32% of desktop and 18.84% mobile, orientation by 19.45% of desktop and 17.65% of mobile, and finally lang used by 12.31% of desktop and 11.01% of mobile.According to the spec, the following properties are valid properties:
background_colorcategoriesdescriptiondirdisplayiarc_rating_idiconslangnameorientationprefer_related_applicationsrelated_applicationsscopescreenshotsshort_nameshortcutsstart_urltheme_color
There were very little differences between mobile and desktop stats.
The proprietary properties we encountered frequently were gcm_sender_id used by Google Cloud Messaging (GCM) service. We also found other interesting attributes like: browser_action, DO_NOT_CHANGE_GCM_SENDER_ID (which was basically a comment, used as JSON doesn’t allow comments), scope, public path, cacheDigest.
On both platforms, however, there’s a long tail of properties that are not interpreted by browsers yet contain potentially useful metadata.
We also found a non-trivial number of mistyped properties; our favorite ones being variation of theme-color, Theme_color, theme-color, Theme_color and orientation.
Top Manifest display values
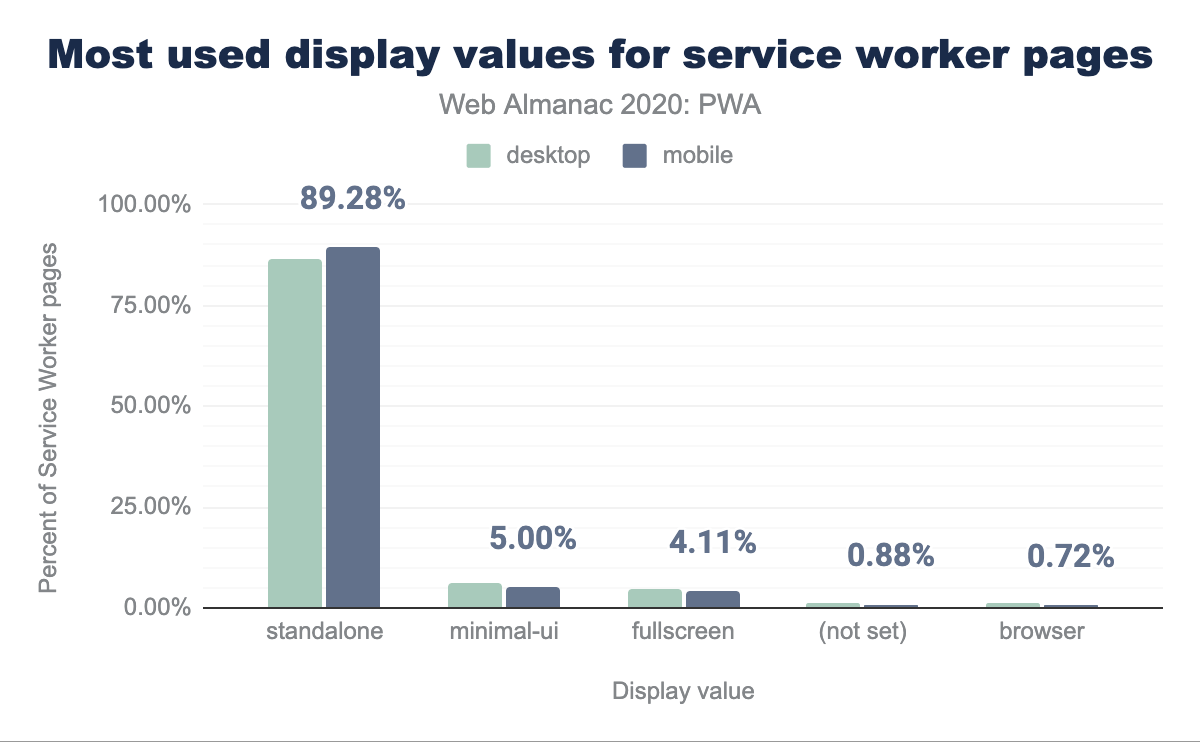
display values, dominated by standalone which is used by 86.73% of desktop and 89.28% of mobile pages, minimal-ui is used by 6.30% of desktop and 5.00% of mobile, fullscreen by 4.80% of desktop and 4.11% of mobile, 1.15% of desktop pages and 0.88% of mobile pages do not set a display value, and finally 1.00% of desktop and 0.72% of mobile set this to browser.display values for service worker pages.
Out of the five most common display values, standalone dominated the list with 86.73% of desktop and 89.28% of mobile pages using this. This isn’t surprising at all as this mode provides the native app-like feel. Next in the list was minimal-ui with 6.30% of desktop and 5.00% of mobile sites opting for them. This is similar to standalone except for the fact that some browser UI is retained.
Top manifest categories
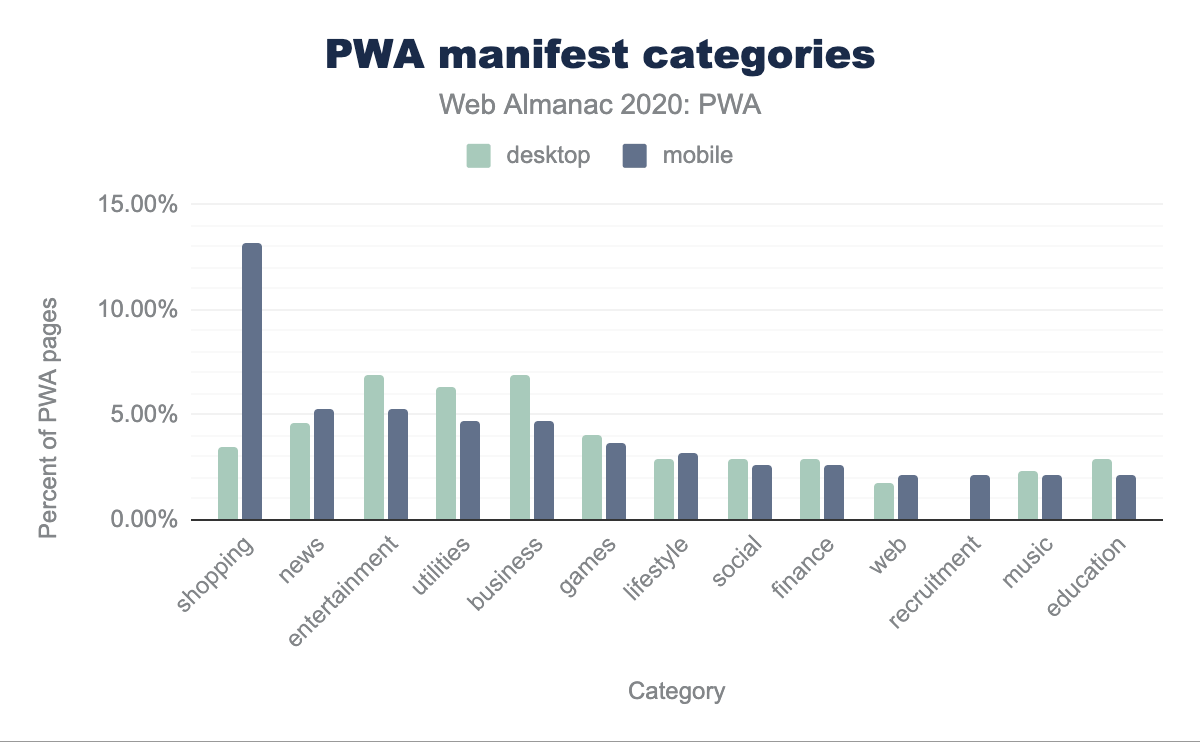
Out of all the top categories, shopping stood at the top at with 13.16% on the mobile traffic, which is not unexpected as PWAs are e-commerce applications. news was next with 5.26% on the mobile traffic.
Manifests preferring native
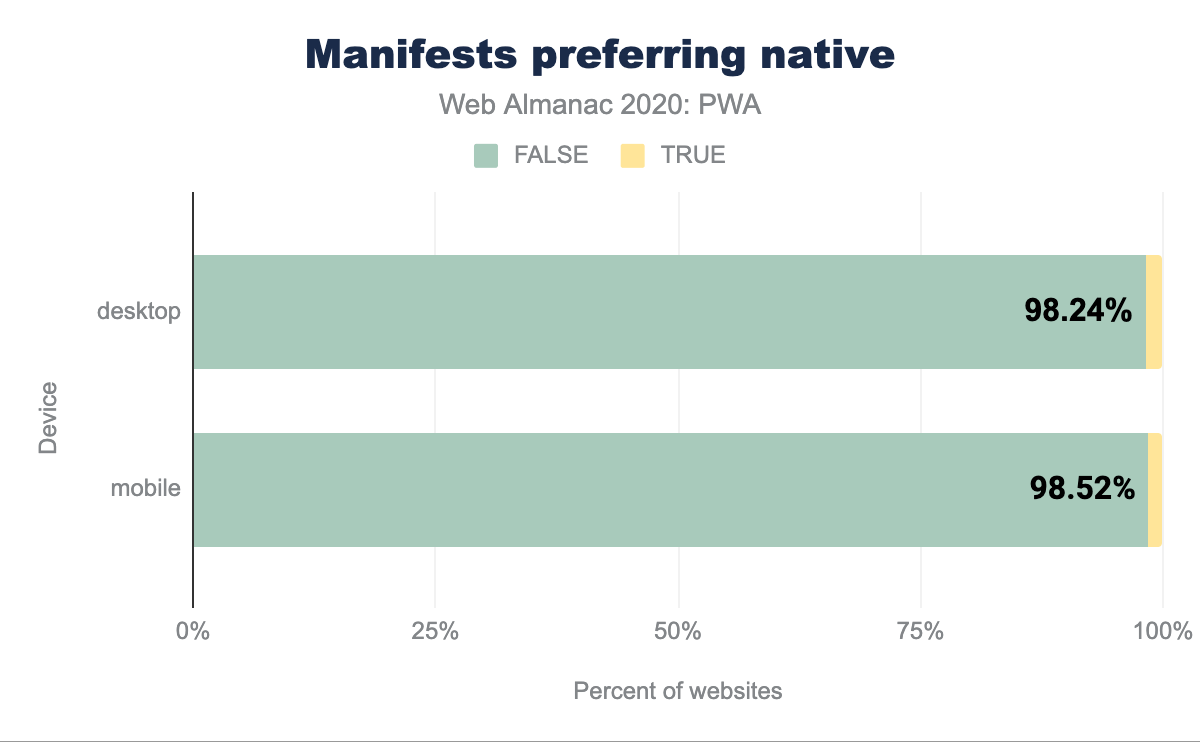
98.24% of desktop PWA sites and 98.52% of mobile PWA sites set the preferred_related_applications manifest property to not prefer native apps, but instead use web version where they exist. For the small percentage where this is set to true this is a signal that there are many web applications that just have a manifest but aren’t really full PWAs yet.
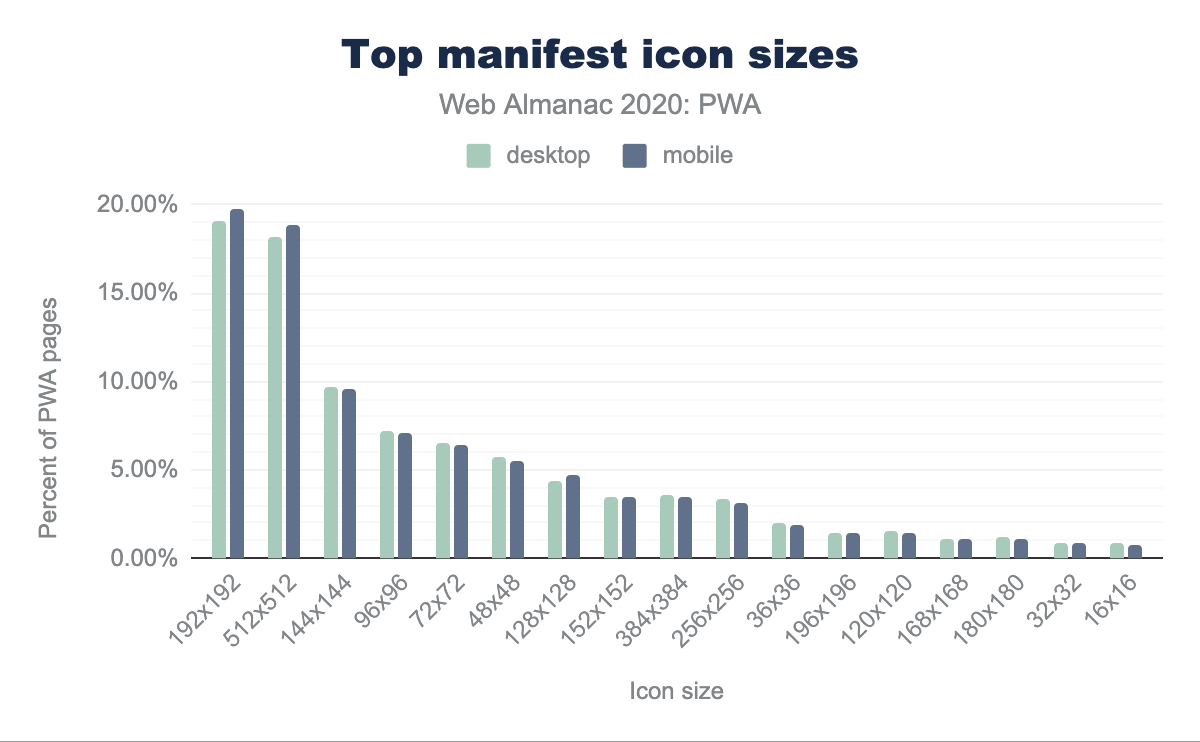
Top manifest icon sizes
Lighthouse requires at least an icon sized 192x192 pixels, but common favicon generation tools create a plethora of other sizes, too. It is always better to use the recommended icon sizes for each device so it is encouraging to see such a widespread usage of different icon sizes.
Top manifest orientations
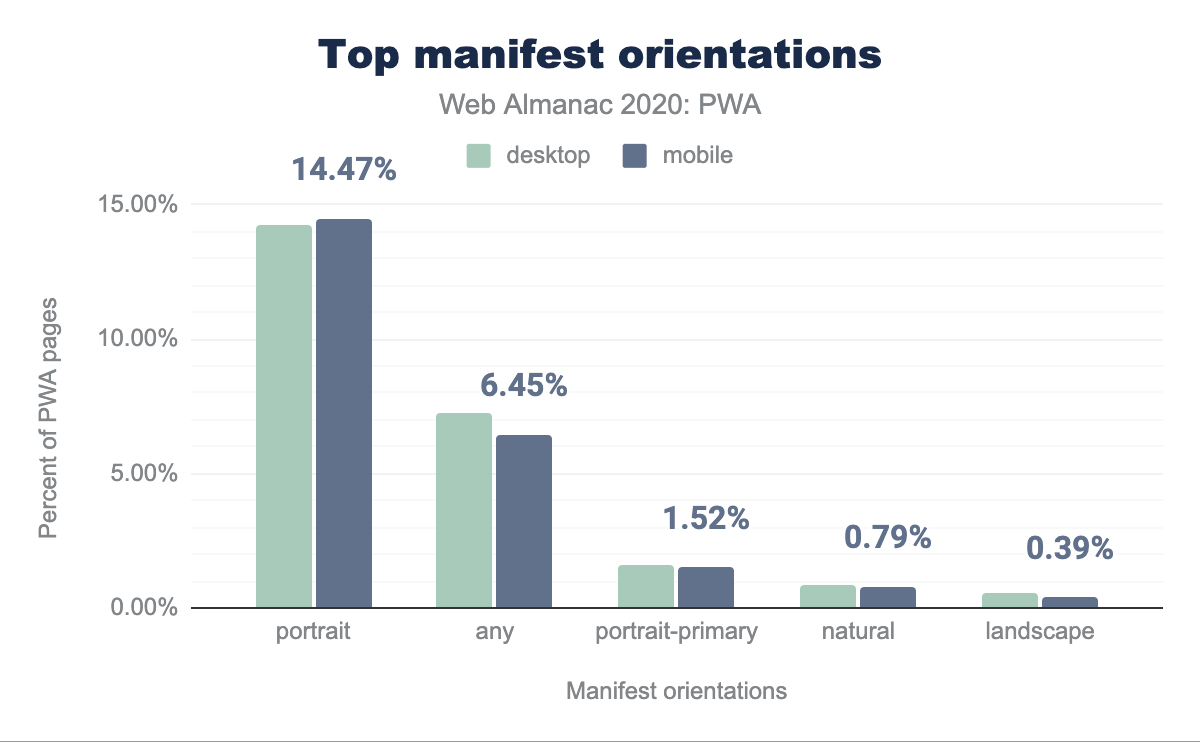
portrait used by 14.25% of desktop sites and 14.47% of mobile, any used by 7.25% of desktop and 6.45% of mobile, portrait-primary used by 1.56% of desktop and 1.52% mobile, natural used by 0.86% of desktop and 0.79% of mobile, and finally landscape is used by 0.53% of desktop and 0.39% of mobile.The valid values for the orientation property are defined in the Screen Orientation API specification. Currently, they are:
anynaturallandscapeportraitportrait-primaryportrait-secondarylandscape-primarylandscape-secondary
Out of which we noticed that portrait, any and portrait-primary properties took precedence.
Service worker libraries
There are many cases, where the service workers use libraries as dependencies, be it external dependencies or the application’s internal dependencies. These are usually fetched to the service worker via the importScripts() API. In this section we will look into stats on such libraries.
Popular import scripts
The importScripts() API of the WorkerGlobalScope interface synchronously imports one or more scripts into the worker’s scope. The same is used to import external dependencies to the service worker.
| Script | Desktop | Mobile |
|---|---|---|
Uses importScripts() |
29.60% | 23.76% |
Workbox
|
17.70% | 15.25% |
sw_toolbox
|
13.92% | 12.84% |
firebase
|
3.40% | 3.09% |
OneSignalSDK
|
4.23% | 2.76% |
najva
|
1.89% | 1.52% |
upush
|
1.45% | 1.23% |
cache_polyfill
|
0.70% | 0.72% |
analytics_helper
|
0.34% | 0.39% |
| Other Library | 0.27% | 0.15% |
| No Library | 58.81% | 64.44% |
Around 30% of desktop PWA sites and 25% of mobile PWA sites uses importScripts(), of which workbox, sw_toolbox and firebase take the first three positions respectively.
Workbox usage
Out of many libraries available, Workbox was the most heavily used with an adoption rate of 12.86% and 15.29% of PWA sites on mobile and desktop respectively.
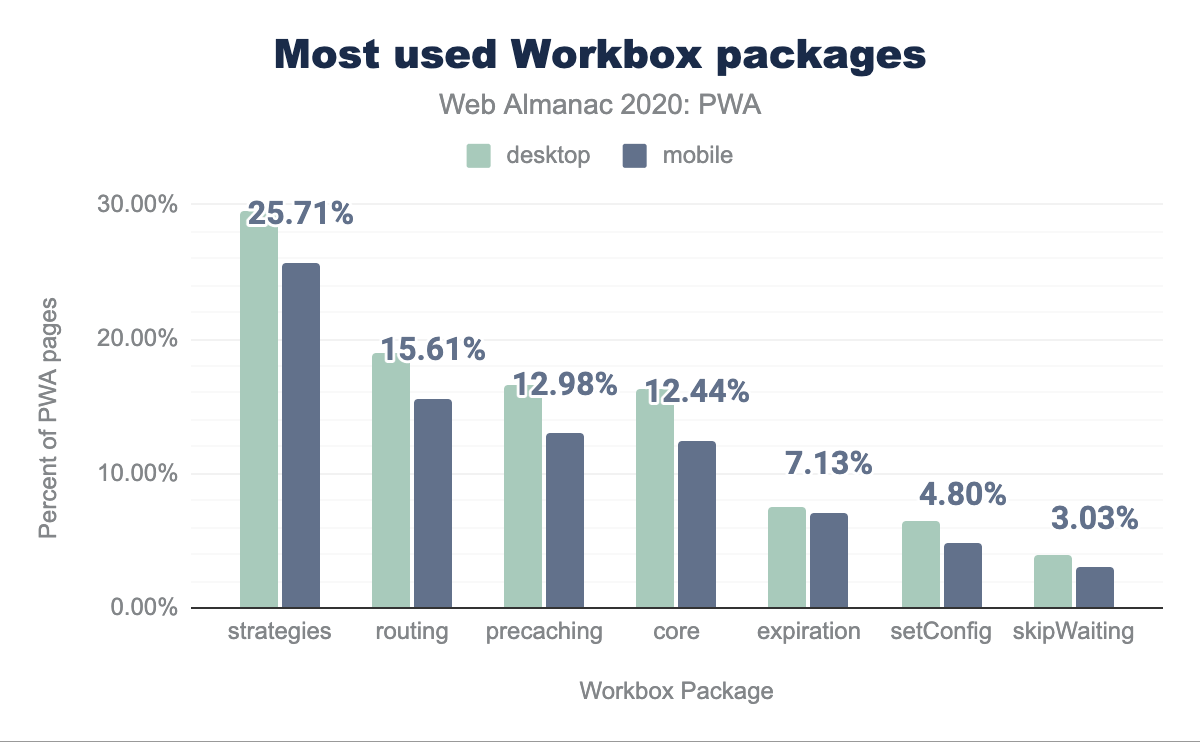
strategies is used by 29.53% of desktop service worker pages, and 25.71% of mobile, routing by 18.91% and 15.61% respectively, precaching by 16.54% and 12.98%, core by 16.28% 12.44%, expiration by 7.49% 7.13%,setConfig by 6.54% 4.80%, and skipWaiting is used by 3.89% of desktop service worker sites and 3.03% of mobile.Out of many methods that Workbox provides, we noticed that strategies were used by 29.53% of desktop and 25.71% on mobile, routing followed it with 18.91% and 15.61% adoption and finally precaching were next most used with 16.54% and 12.98% on desktop and mobile respectively.
This indicated that the strategies API, as one of the most complicated requirements for the developers, played a very important role when they decided to code themselves or rely on libraries like Workbox.
Conclusion
The stats in this chapter show that PWAs are still continuing to grow in adoption, due to the advantages they give for performance and greater control over caching particularly for mobile. With those advantages and ever increasing capabilities, means we still have a lot of potential for growth. We expect to see even more progress in 2021!
More and more browsers and platforms are supporting the technologies powering PWAs. This year, we saw that Edge gained support for the Web App Manifest. Depending on your use case and target market, you may find that the majority of your users (close to 96%) have PWA support. That is a great improvement! In all cases, it is important to approach technologies such as service workers and Web App Manifest as progressive enhancements. You can use these technologies to provide an exceptional user experience and, with the above stats, we’re excited for another year of PWA growth!
