JavaScript
Introduction
JavaScript has come a long way from its humble origins as the last of the three web cornerstones—alongside CSS and HTML. Today, JavaScript has started to infiltrate a broad spectrum of the technical stack. It is no longer confined to the client-side and it’s an increasingly popular choice for build tools and server-side scripting. JavaScript is also creeping its way into the CDN layer as well thanks to edge computing solutions.
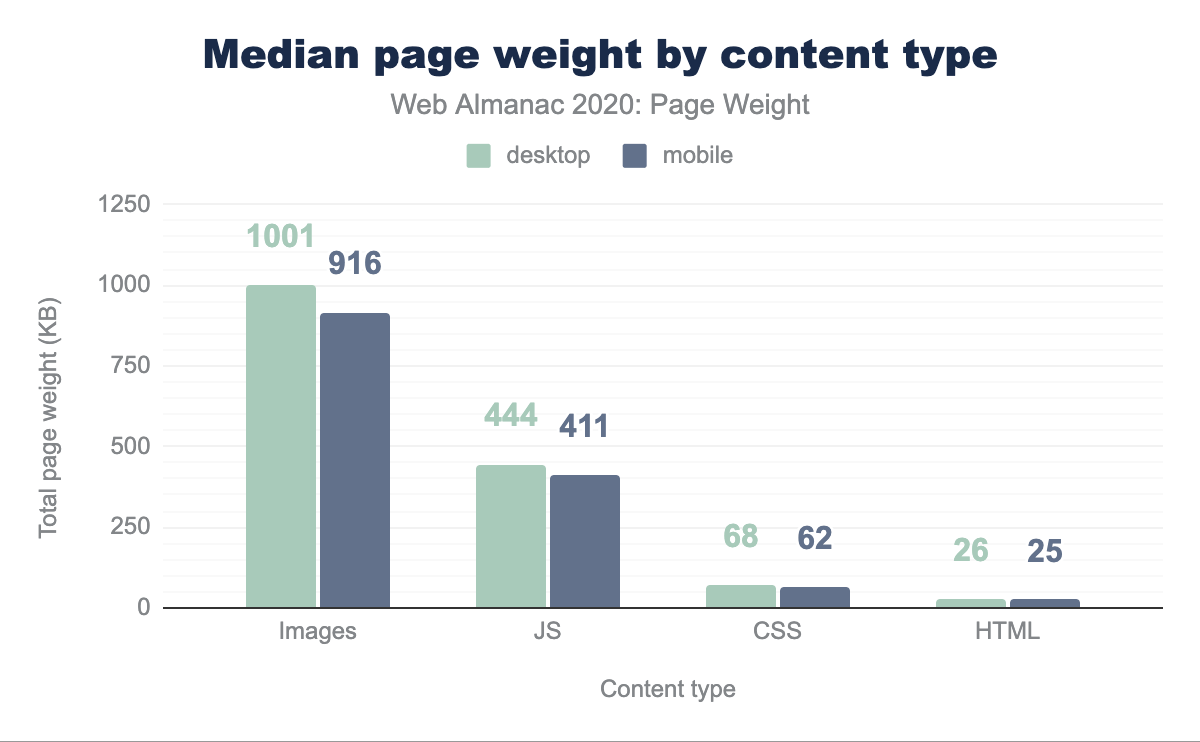
Developers love us some JavaScript. According to the Markup chapter, the script element is the 6th most popular HTML element in use (ahead of elements like p and i, among countless others). We spend around 14 times as many bytes on it as we do on HTML, the building block of the web, and 6 times as many bytes as CSS.
But nothing is free, and that’s especially true for JavaScript—all that code has a cost. Let’s dig in and take a closer look at how much script we use, how we use it, and what the fallout is.
How much JavaScript do we use?
We mentioned that the script tag is the 6th most used HTML element. Let’s dig in a bit deeper to see just how much JavaScript that actually amounts to.
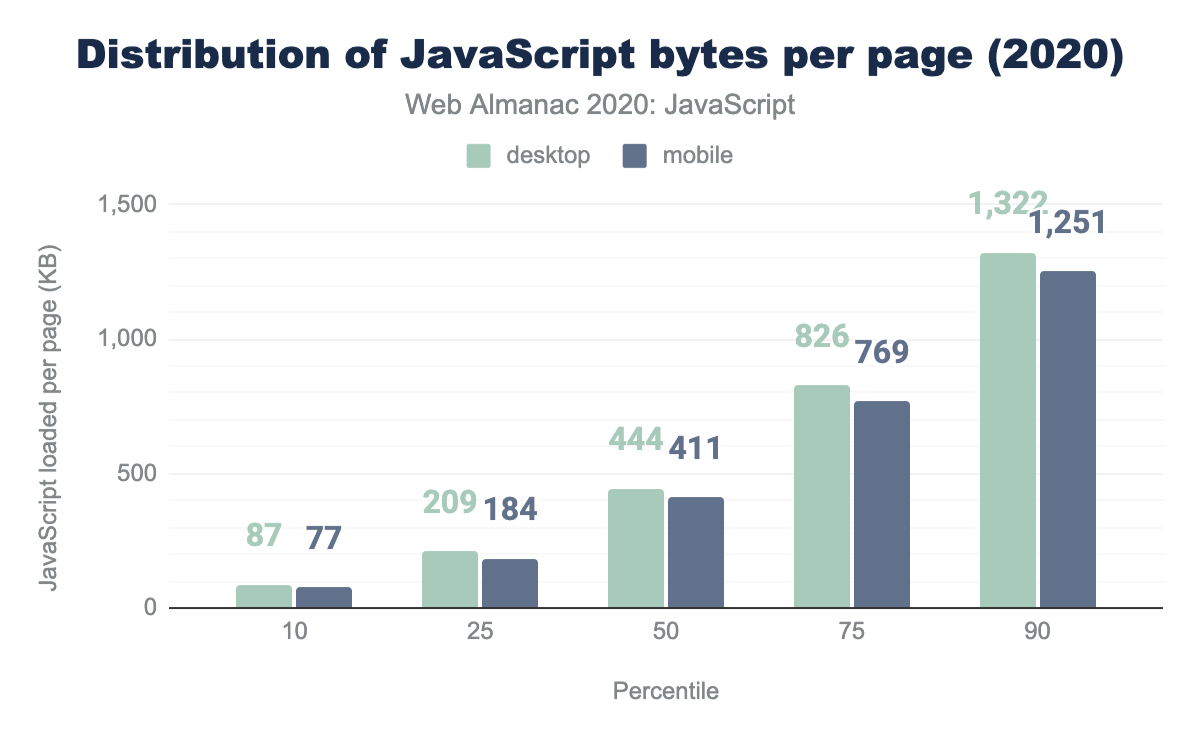
The median site (the 50th percentile) sends 444 KB of JavaScript when loaded on a desktop device, and slightly fewer (411 KB) to a mobile device.
It’s a bit disappointing that there isn’t a bigger gap here. While it’s dangerous to make too many assumptions about network or processing power based on whether the device in use is a phone or a desktop (or somewhere in between), it’s worth noting that HTTP Archive mobile tests are done by emulating a Moto G4 and a 3G network. In other words, if there was any work being done to adapt to less-than-ideal circumstances by passing down less code, these tests should be showing it.
The trend also seems to be in favor of using more JavaScript, not less. Comparing to last year’s results, at the median we see a 13.4% increase in JavaScript as tested on a desktop device, and a 14.4% increase in the amount of JavaScript sent to a mobile device.
| Client | 2019 | 2020 | Change |
|---|---|---|---|
| Desktop | 391 | 444 | 13.4% |
| Mobile | 359 | 411 | 14.4% |
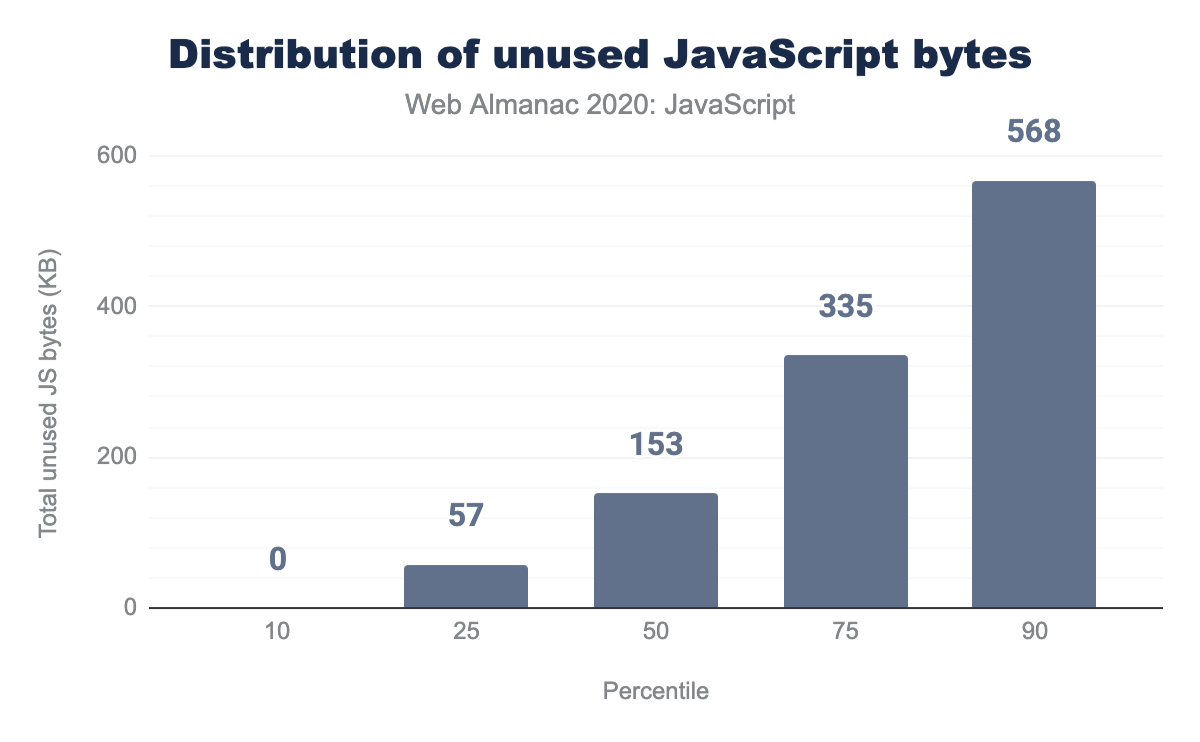
At least some of this weight seems to be unnecessary. If we look at a breakdown of how much of that JavaScript is unused on any given page load, we see that the median page is shipping 152 KB of unused JavaScript. That number jumps to 334 KB at the 75th percentile and 567 KB at the 90th percentile.
As raw numbers, those may or may not jump out at you depending on how much of a performance nut you are, but when you look at it as a percentage of the total JavaScript used on each page, it becomes a bit easier to see just how much waste we’re sending.
That 153 KB equates to ~37% of the total script size that we send down to mobile devices. There’s definitely some room for improvement here.
module and nomodule
One mechanism we have to potentially reduce the amount of code we send down is to take advantage of the module/nomodule pattern. With this pattern, we create two sets of bundles: one bundle intended for modern browsers and one intended for legacy browsers. The bundle intended for modern browsers gets a type=module and the bundle intended for legacy browsers gets a type=nomodule.
This approach lets us create smaller bundles with modern syntax optimized for the browsers that support it, while providing conditionally loaded polyfills and different syntax to the browsers that don’t.
Support for module and nomodule is broadening, but still relatively new. As a result, adoption is still a bit low. Only 3.6% of mobile pages use at least one script with type=module and only 0.7% of mobile pages use at least one script with type=nomodule to support legacy browsers.
Request count
Another way of looking at how much JavaScript we use is to explore how many JavaScript requests are made on each page. While reducing the number of requests was paramount to maintaining good performance with HTTP/1.1, with HTTP/2 the opposite is the case: breaking JavaScript down into smaller, individual files is typically better for performance.
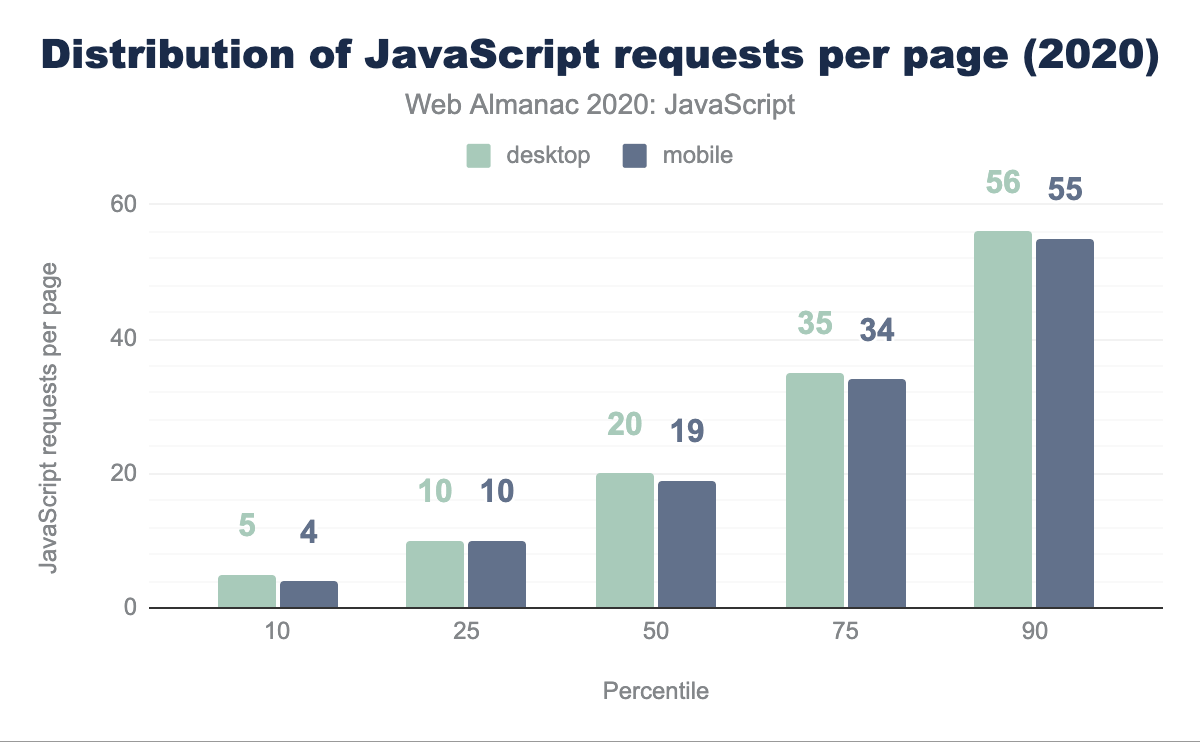
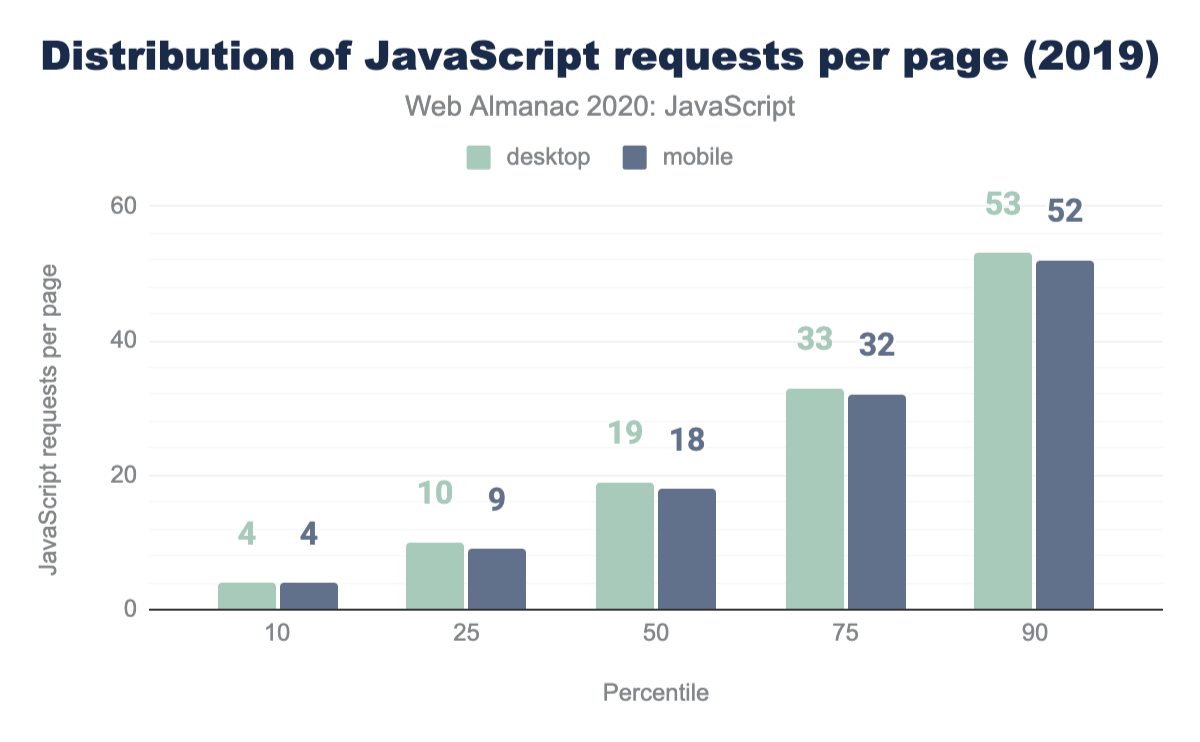
At the median, pages make 20 JavaScript requests. That’s only a minor increase over last year, when the median page made 19 JavaScript requests.
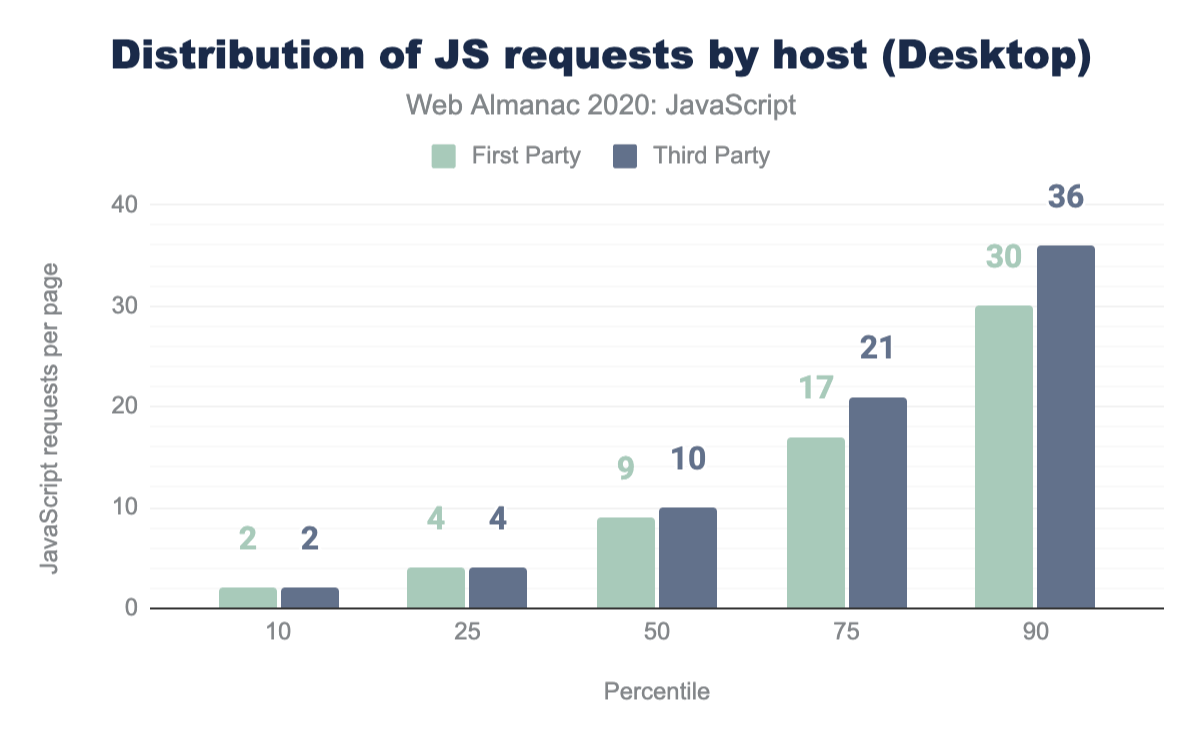
Where does it come from?
One trend that likely contributes to the increase in JavaScript used on our pages is the seemingly ever-increasing amount of third-party scripts that get added to pages to help with everything from client-side A/B testing and analytics, to serving ads and handling personalization.
Let’s drill into that a bit to see just how much third-party script we’re serving up.
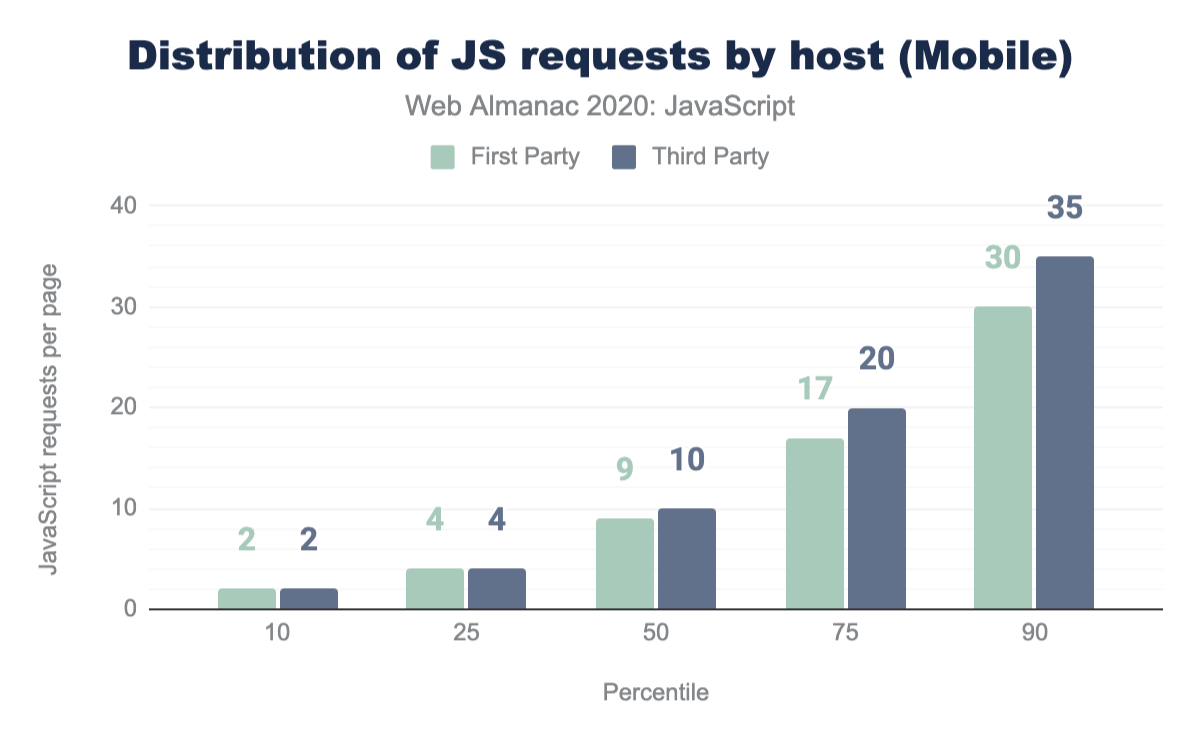
Right up until the median, sites serve roughly the same number of first-party scripts as they do third-party scripts. At the median, 9 scripts per page are first-party, compared to 10 per page from third-parties. From there, the gap widens a bit: the more scripts a site serves in the total, the more likely it is that the majority of those scripts are from third-party sources.
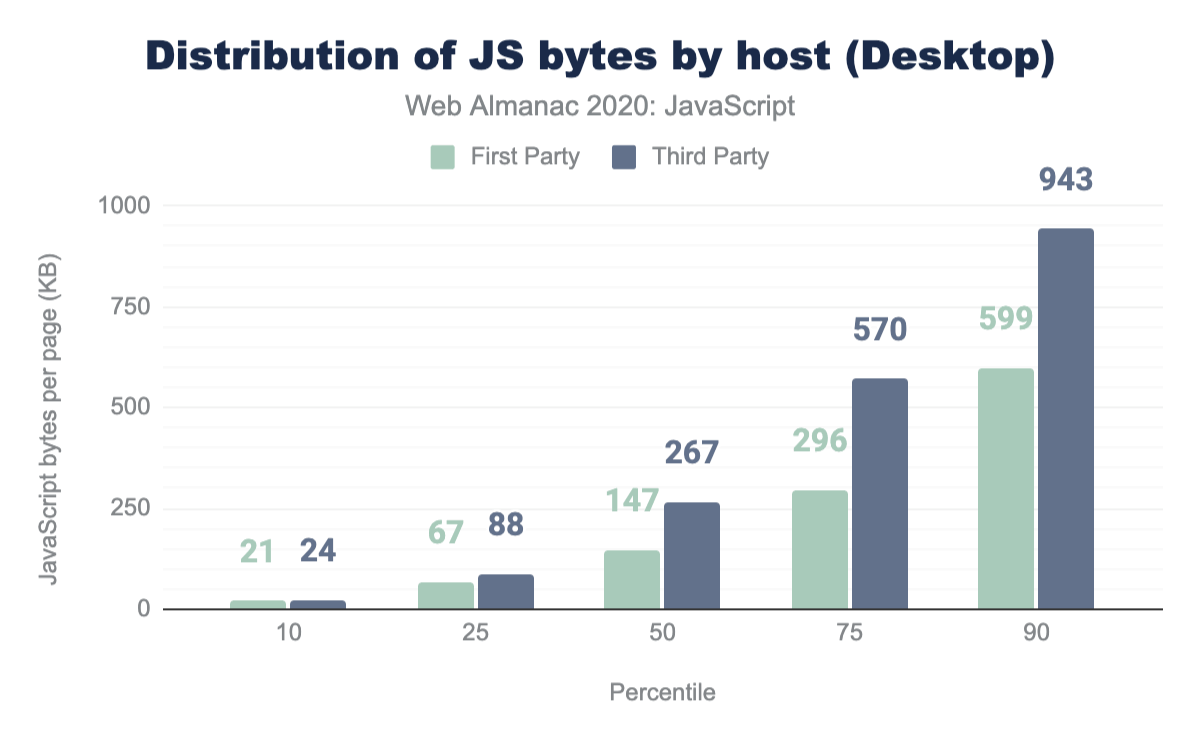
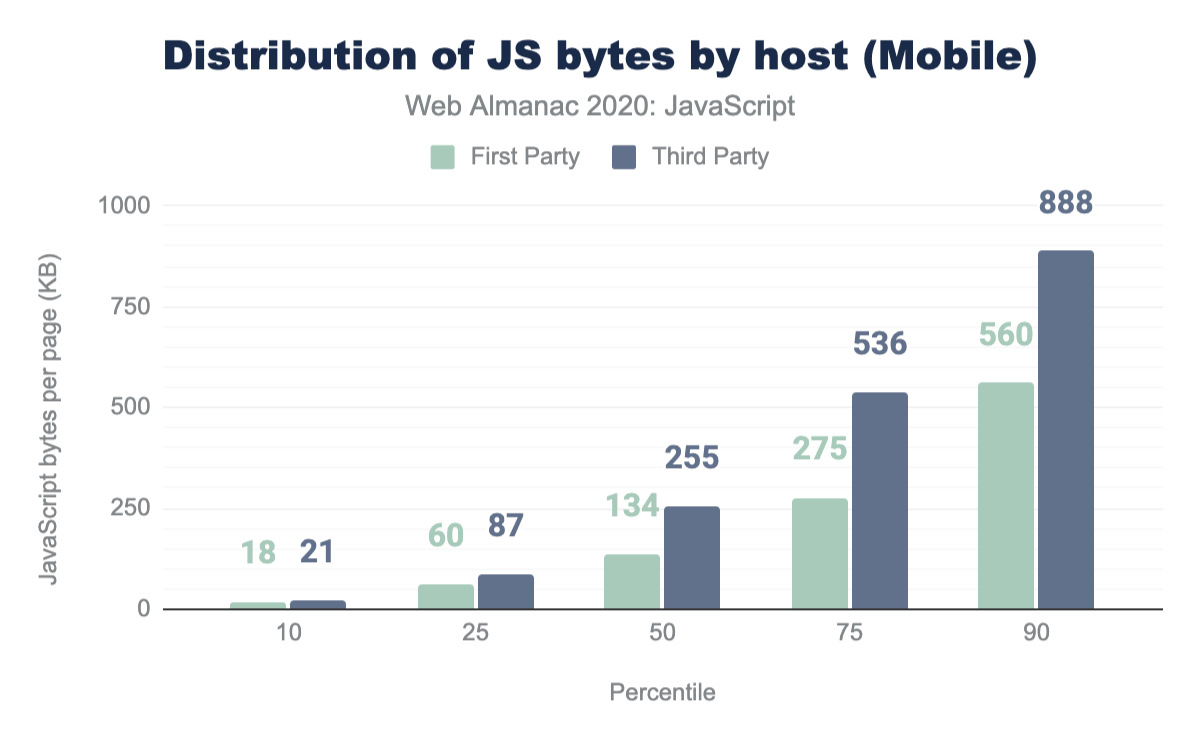
While the amount of JavaScript requests are similar at the median, the actual size of those scripts is weighted (pun intended) a bit more heavily toward third-party sources. The median site sends 267 KB of JavaScript from third-parties to desktop devices ,compared to 147 KB from first-parties. The situation is very similar on mobile, where the median site ships 255 KB of third-party scripts compared to 134 KB of first-party scripts.
How do we load our JavaScript?
The way we load JavaScript has a significant impact on the overall experience.
By default, JavaScript is parser-blocking. In other words, when the browser discovers a script element, it must pause parsing of the HTML until the script has been downloaded, parsed, and executed. It’s a significant bottleneck and a common contributor to pages that are slow to render.
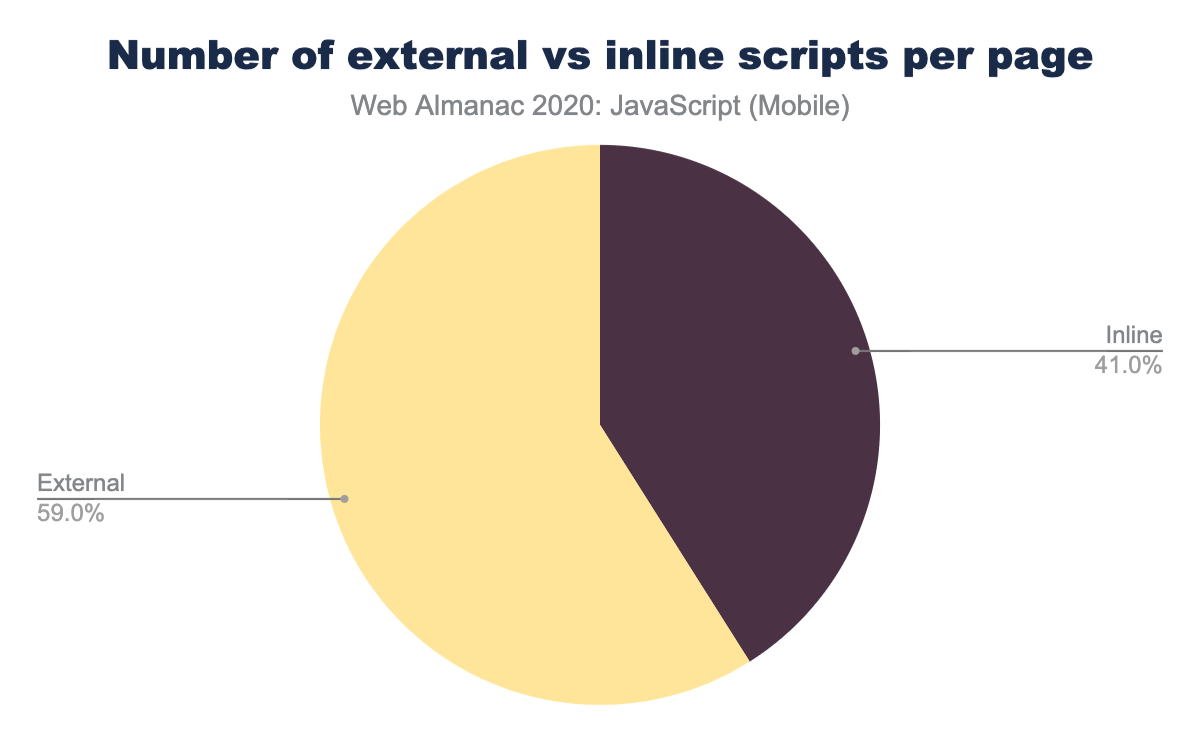
We can start to offset some of the cost of loading JavaScript by loading scripts either asynchronously (with the async attribute), which only halts the HTML parser during the parse and execution phases and not during the download phase, or deferred (with the defer attribute), which doesn’t halt the HTML parser at all. Both attributes are only available on external scripts—inline scripts cannot have them applied.
On mobile, external scripts comprise 59.0% of all script elements found.
Of those external scripts, only 12.2% of them are loaded with the async attribute and 6.0% of them are loaded with the defer attribute.
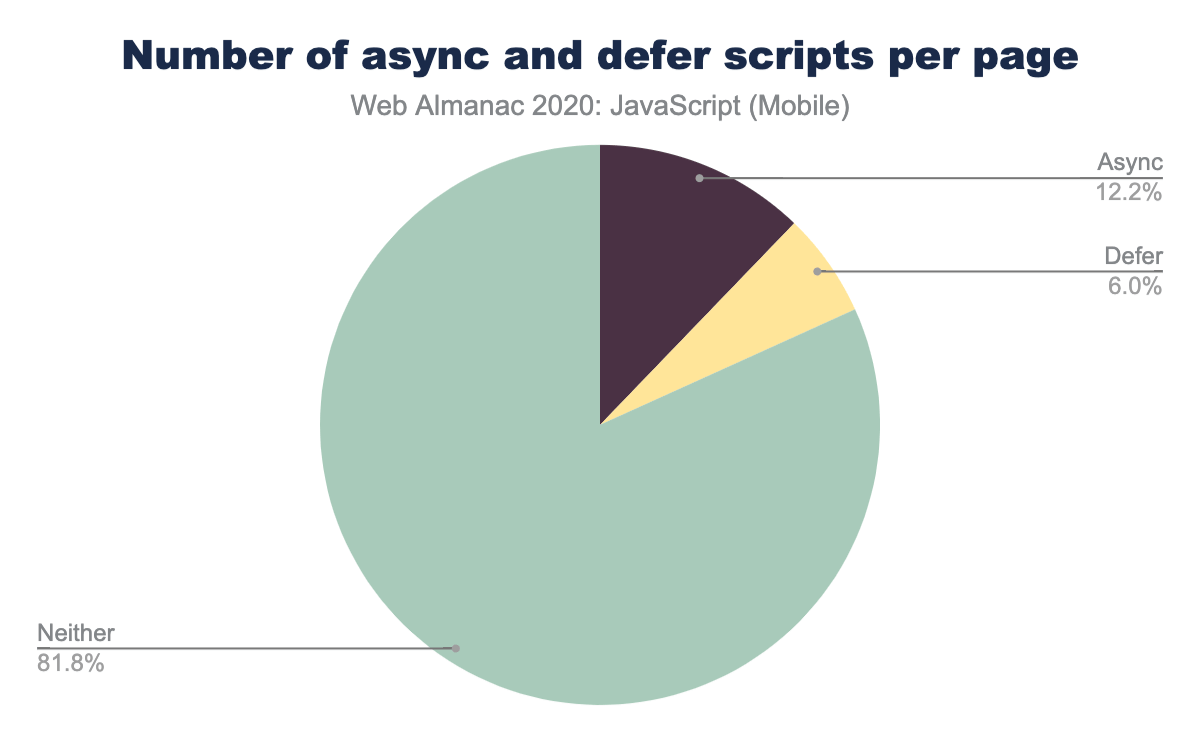
async and defer scripts per mobile page.
Considering that defer provides us with the best loading performance (by ensuring downloading the script happens in parallel to other work, and execution waits until after the page can be displayed), we would hope to see that percentage a bit higher. In fact, as it is that 6.0% is slightly inflated.
Back when supporting IE8 and IE9 was more common, it was relatively common to use both the async and defer attributes. With both attributes in place, any browser supporting both will use async. IE8 and IE9, which don’t support async will fall back to defer.
Nowadays, the pattern is unnecessary for the vast majority of sites and any script loaded with the pattern in place will interrupt the HTML parser when it needs to be executed, instead of deferring until the page has loaded. The pattern is still used surprisingly often, with 11.4% of mobile pages serving at least one script with that pattern in place. In other words, at least some of the 6% of scripts that use defer aren’t getting the full benefits of the defer attribute.
There is an encouraging story here, though.
Harry Roberts tweeted about the anti-pattern on Twitter, which is what prompted us to check to see how frequently this was occurring in the wild. Rick Viscomi checked to see who the top culprits were, and it turns out “stats.wp.com” was the source of the most common offenders. @Kraft from Automattic replied, and the pattern will now be removed going forward.
One of the great things about the openness of the web is how one observation can lead to meaningful change and that’s exactly what happened here.
Resource hints
Another tool we have at our disposal for offsetting some of the network costs of loading JavaScript are resource hints, specifically, prefetch and preload.
The prefetch hint lets developers signify that a resource will be used on the next page navigation, therefore the browser should try to download it when the browser is idle.
The preload hint signifies that a resource will be used on the current page and that the browser should download it right away at a higher priority.
Overall, we see 16.7% of mobile pages using at least one of the two resource hints to load JavaScript more proactively.
Of those, nearly all of the usage is coming from preload. While 16.6% of mobile pages use at least one preload hint to load JavaScript, only 0.4% of mobile pages use at least one prefetch hint.
There’s a risk, particularly with preload, of using too many hints and reducing their effectiveness, so it’s worth looking at the pages that do use these hints to see how many they’re using.
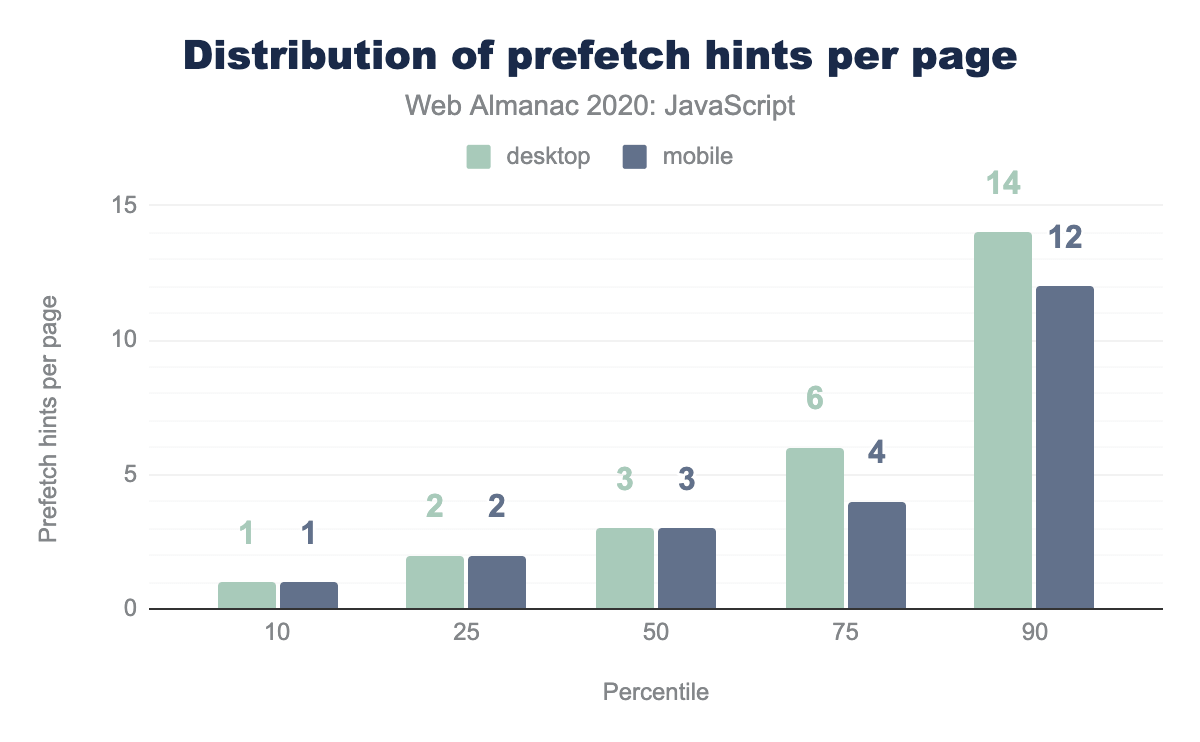
prefetch hints per page with any prefetch hints.
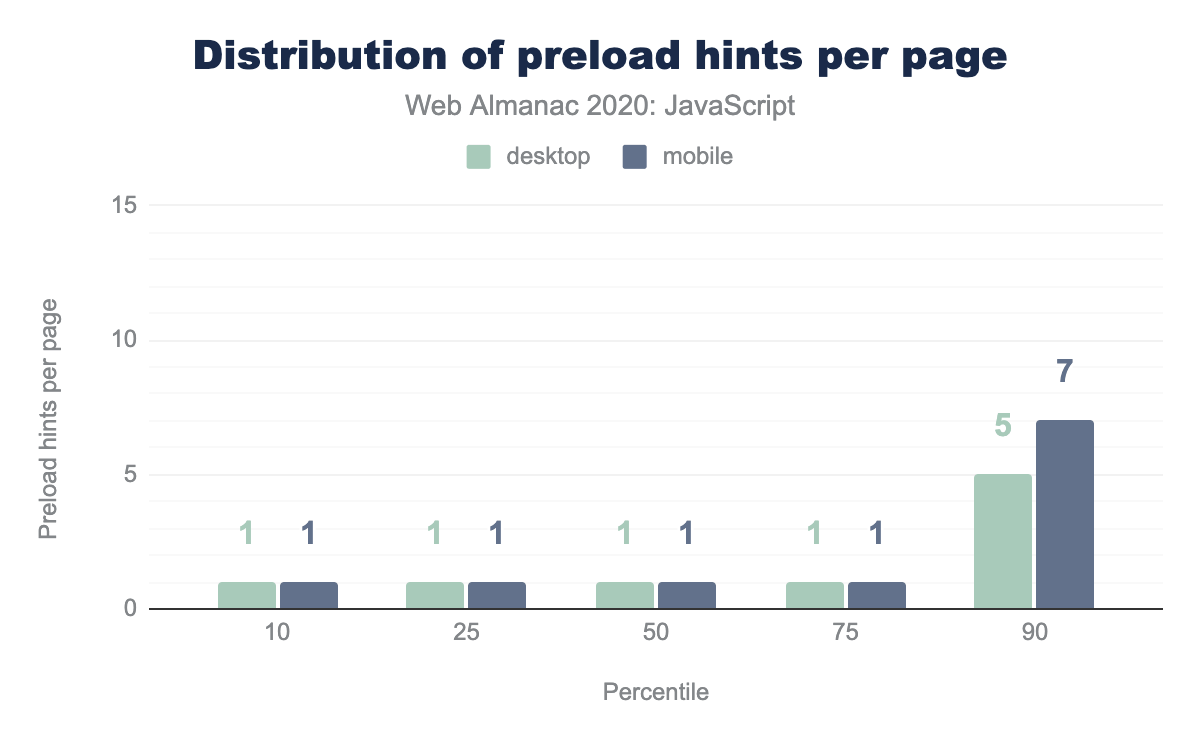
preload hints per page with any preload hints.
At the median, pages that use a prefetch hint to load JavaScript use three, while pages that use a preload hint only use one. The long tail gets a bit more interesting, with 12 prefetch hints used at the 90th percentile and 7 preload hints used on the 90th as well. For more detail on resource hints, check out this year’s Resource Hints chapter.
How do we serve JavaScript?
As with any text-based resource on the web, we can save a significant number of bytes through minimization and compression. Neither of these are new optimizations—they’ve been around for quite awhile—so we should expect to see them applied in more cases than not.
One of the audits in Lighthouse checks for unminified JavaScript, and provides a score (0.00 being the worst, 1.00 being the best) based on the findings.
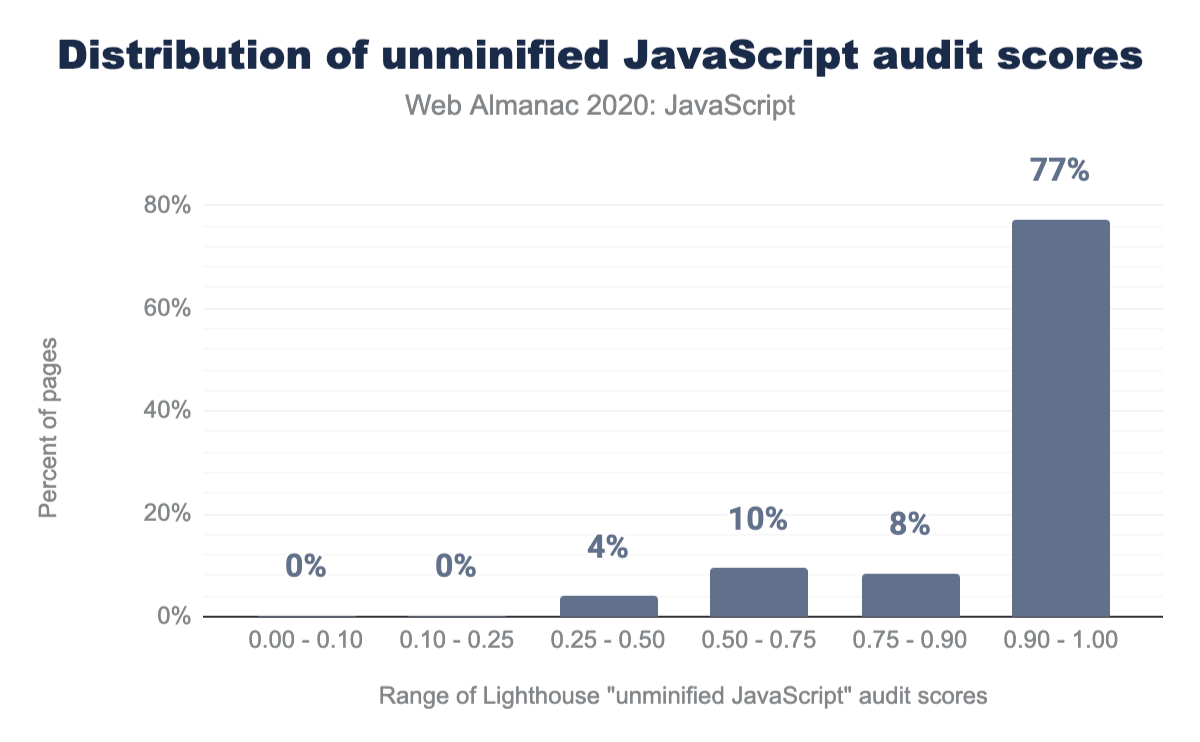
The chart above shows that most pages tested (77%) get a score of 0.90 or above, meaning that few unminified scripts are found.
Overall, only 4.5% of the JavaScript requests recorded are unminified.
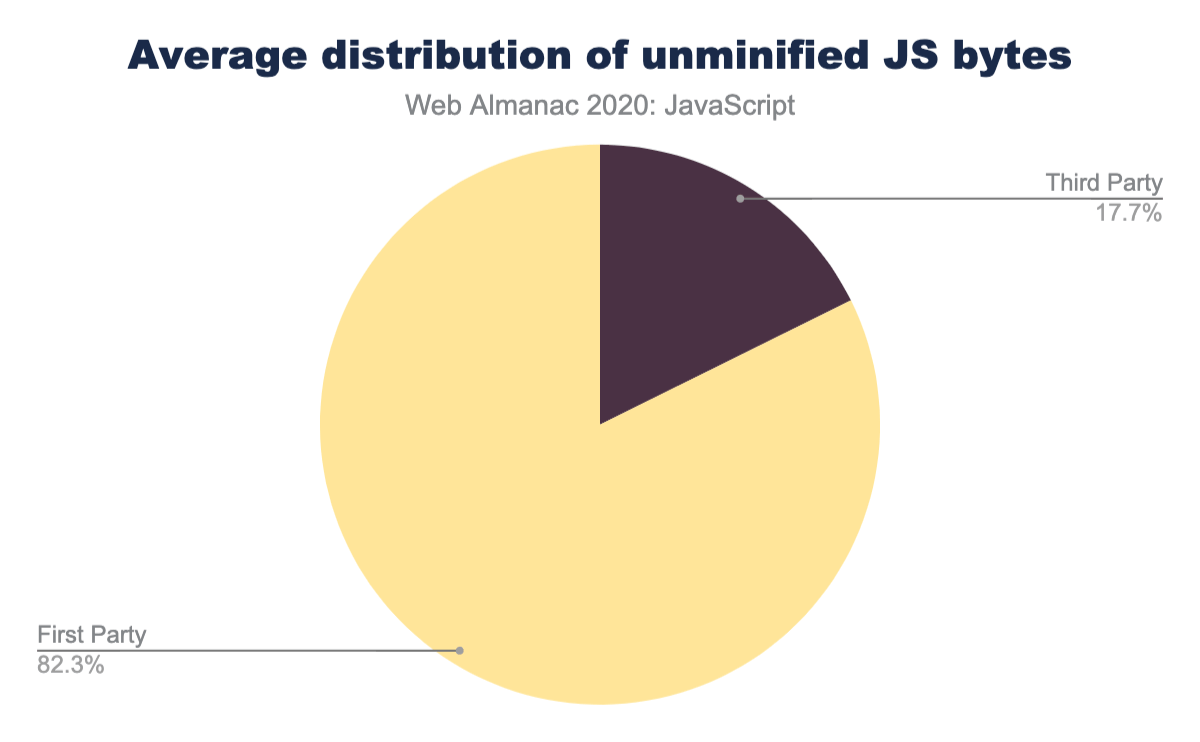
Interestingly, while we’ve picked on third-party requests a bit, this is one area where third-party scripts are doing better than first-party scripts. 82% of the average mobile page’s unminified JavaScript bytes come from first-party code.
Compression
Minification is a great way to help reduce file size, but compression is even more effective and, therefore, more important—it provides the bulk of network savings more often than not.
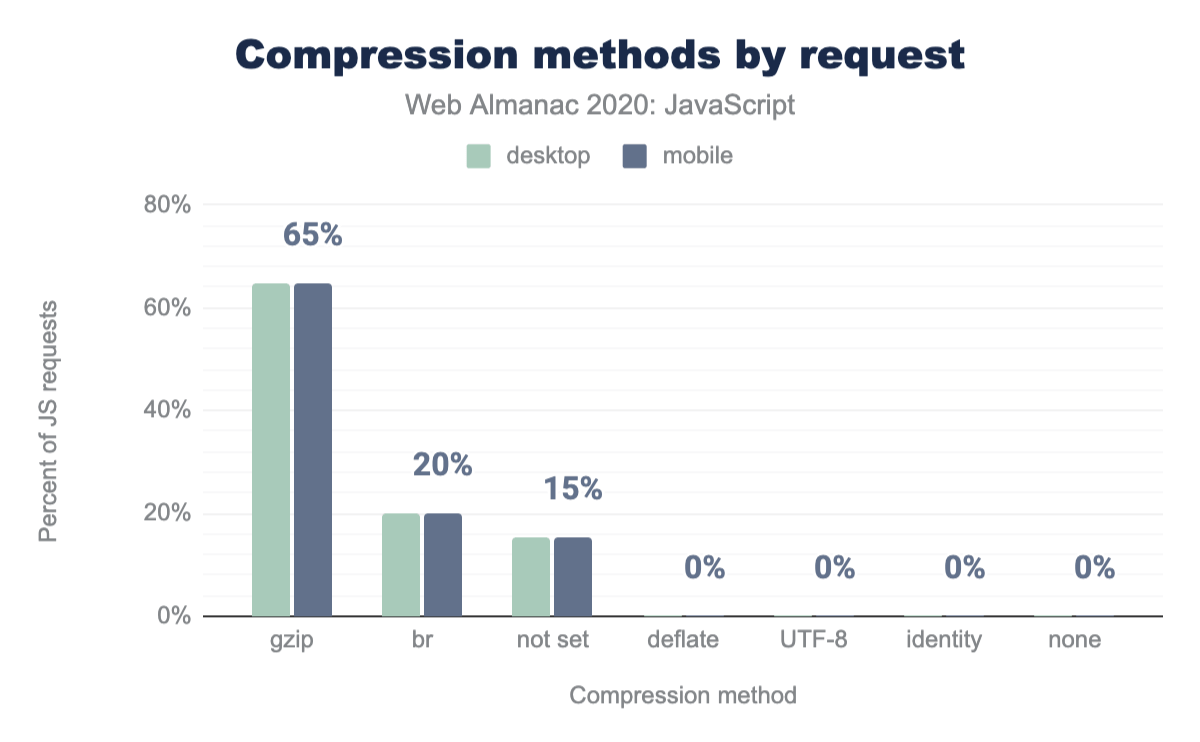
85% of all JavaScript requests have some level of network compression applied. Gzip makes up the majority of that, with 65% of scripts having Gzip compression applied compared to 20% for Brotli (br). While the percentage of Brotli (which is more effective than Gzip) is low compared to its browser support, it’s trending in the right direction, increasing by 5 percentage points in the last year.
Once again, this appears to be an area where third-party scripts are actually doing better than first-party scripts. If we break the compression methods out by first- and third-party, we see that 24% of third-party scripts have Brotli applied, compared to only 15% of first-party scripts.
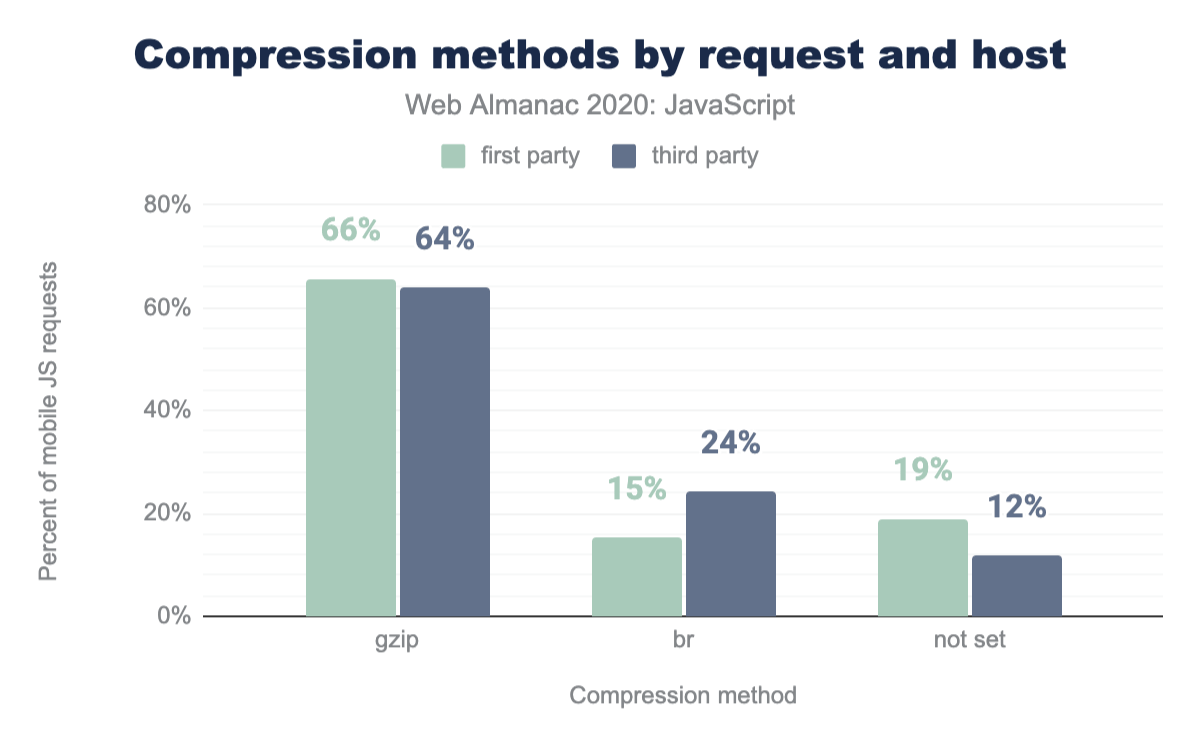
Third-party scripts are also least likely to be served without any compression at all: 12% of third-party scripts have neither Gzip nor Brotli applied, compared to 19% of first-party scripts.
It’s worth taking a closer look at those scripts that don’t have compression applied. Compression becomes more efficient in terms of savings the more content it has to work with. In other words, if the file is tiny, sometimes the cost of compressing the file doesn’t outweight the miniscule reduction in file size.
Thankfully, that’s exactly what we see, particularly in third-party scripts where 90% of uncompressed scripts are less than 5 KB in size. On the other hand, 49% of uncompressed first-party scripts are less than 5 KB and 37% of uncompressed first-party scripts are over 10 KB. So while we do see a lot of small uncompressed first-party scripts, there are still quite a few that would benefit from some compression.
What do we use?
As we’ve increasingly used more JavaScript to power our sites and applications, there has also been an increasing demand for open-source libraries and frameworks to help with improving developer productivity and overall code maintainability. Sites that don’t wield one of these tools are definitely the minority on today’s web—jQuery alone is found on nearly 85% of the mobile pages tracked by HTTP Archive.
It’s important that we think critically about the tools we use to build the web and what the trade-offs are, so it makes sense to look closely at what we see in use today.
Libraries
HTTP Archive uses Wappalyzer to detect technologies in use on a given page. Wappalazyer tracks both JavaScript libraries (think of these as a collection of snippets or helper functions to ease development, like jQuery) and JavaScript frameworks (these are more likely scaffolding and provide templating and structure, like React).
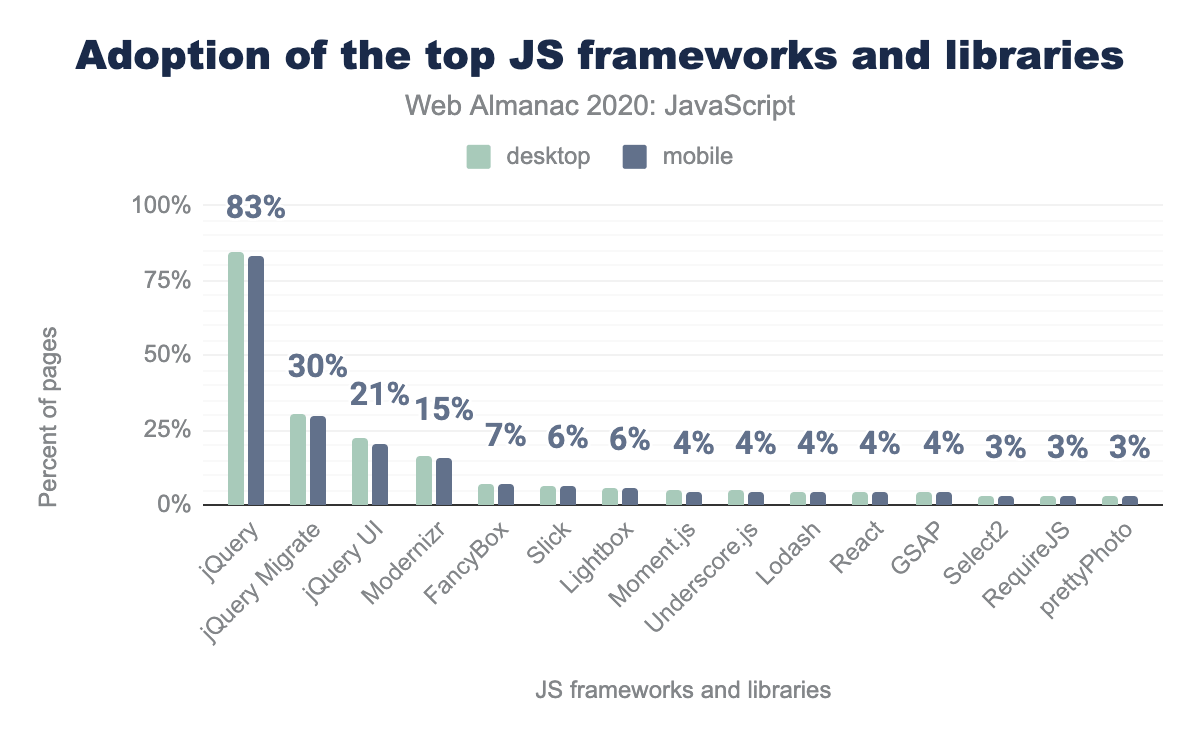
The popular libraries in use are largely unchanged from last year, with jQuery continuing to dominate usage and only one of the top 21 libraries falling out (lazy.js, replaced by DataTables). In fact, even the percentages of the top libraries has barely changed from last year.
Last year, Houssein posited a few reasons for why jQuery’s dominance continues:
WordPress, which is used in more than 30% of sites, includes jQuery by default. Switching from jQuery to a newer client-side library can take time depending on how large an application is, and many sites may consist of jQuery in addition to newer client-side libraries.
Both are very sound guesses, and it seems the situation hasn’t changed much on either front.
In fact, the dominance of jQuery is supported even further when you stop to consider that, of the top 10 libraries, 6 of them are either jQuery or require jQuery in order to be used: jQuery UI, jQuery Migrate, FancyBox, Lightbox and Slick.
Frameworks
When we look at the frameworks, we also don’t see much of a dramatic change in terms of adoption in the main frameworks that were highlighted last year. Vue.js has seen a significant increase, and AMP grew a bit, but most of them are more or less where they were a year ago.
It’s worth noting that the detection issue that was noted last year still applies, and still impacts the results here. It’s possible that there has been a significant change in popularity for a few more of these tools, but we just don’t see it with the way the data is currently collected.
What it all means
More interesting to us than the popularity of the tools themselves is the impact they have on the things we build.
First, it’s worth noting that while we may think of the usage of one tool versus another, in reality, we rarely only use a single library or framework in production. Only 21% of pages analyzed report only one library or framework. Two or three frameworks are pretty common, and the long-tail gets very long, very quickly.
When we look at the common combinations that we see in production, most of them are to be expected. Knowing jQuery’s dominance, it’s unsurprising that most of the popular combinations include jQuery and any number of jQuery-related plugins.
| Combinations | Pages | (%) |
|---|---|---|
| jQuery | 1,312,601 | 20.7% |
| jQuery, jQuery Migrate | 658,628 | 10.4% |
| jQuery, jQuery UI | 289,074 | 4.6% |
| Modernizr, jQuery | 155,082 | 2.4% |
| jQuery, jQuery Migrate, jQuery UI | 140,466 | 2.2% |
| Modernizr, jQuery, jQuery Migrate | 85,296 | 1.3% |
| FancyBox, jQuery | 84,392 | 1.3% |
| Slick, jQuery | 72,591 | 1.1% |
| GSAP, Lodash, React, RequireJS, Zepto | 61,935 | 1.0% |
| Modernizr, jQuery, jQuery UI | 61,152 | 1.0% |
| Lightbox, jQuery | 60,395 | 1.0% |
| Modernizr, jQuery, jQuery Migrate, jQuery UI | 53,924 | 0.8% |
| Slick, jQuery, jQuery Migrate | 51,686 | 0.8% |
| Lightbox, jQuery, jQuery Migrate | 50,557 | 0.8% |
| FancyBox, jQuery, jQuery UI | 44,193 | 0.7% |
| Modernizr, YUI | 42,489 | 0.7% |
| React, jQuery | 37,753 | 0.6% |
| Moment.js, jQuery | 32,793 | 0.5% |
| FancyBox, jQuery, jQuery Migrate | 31,259 | 0.5% |
| MooTools, jQuery, jQuery Migrate | 28,795 | 0.5% |
We do also see a fair amount of more “modern” frameworks like React, Vue, and Angular paired with jQuery, for example as a result of migration or inclusion by third-parties.
| Combination | Without jQuery | With jQuery |
|---|---|---|
| GSAP, Lodash, React, RequireJS, Zepto | 1.0% | |
| React, jQuery | 0.6% | |
| React | 0.4% | |
| React, jQuery, jQuery Migrate | 0.4% | |
| Vue.js, jQuery | 0.3% | |
| Vue.js | 0.2% | |
| AngularJS, jQuery | 0.2% | |
| GSAP, Hammer.js, Lodash, React, RequireJS, Zepto | 0.2% | |
| Grand Total | 1.7% | 1.4% |
More importantly, all these tools typically mean more code and more processing time.
Looking specifically at the frameworks in use, we see that the median JavaScript bytes for pages using them varies dramatically depending on what is being used.
The graph below shows the median bytes for pages where any of the top 35 most commonly detected frameworks were found, broken down by client.
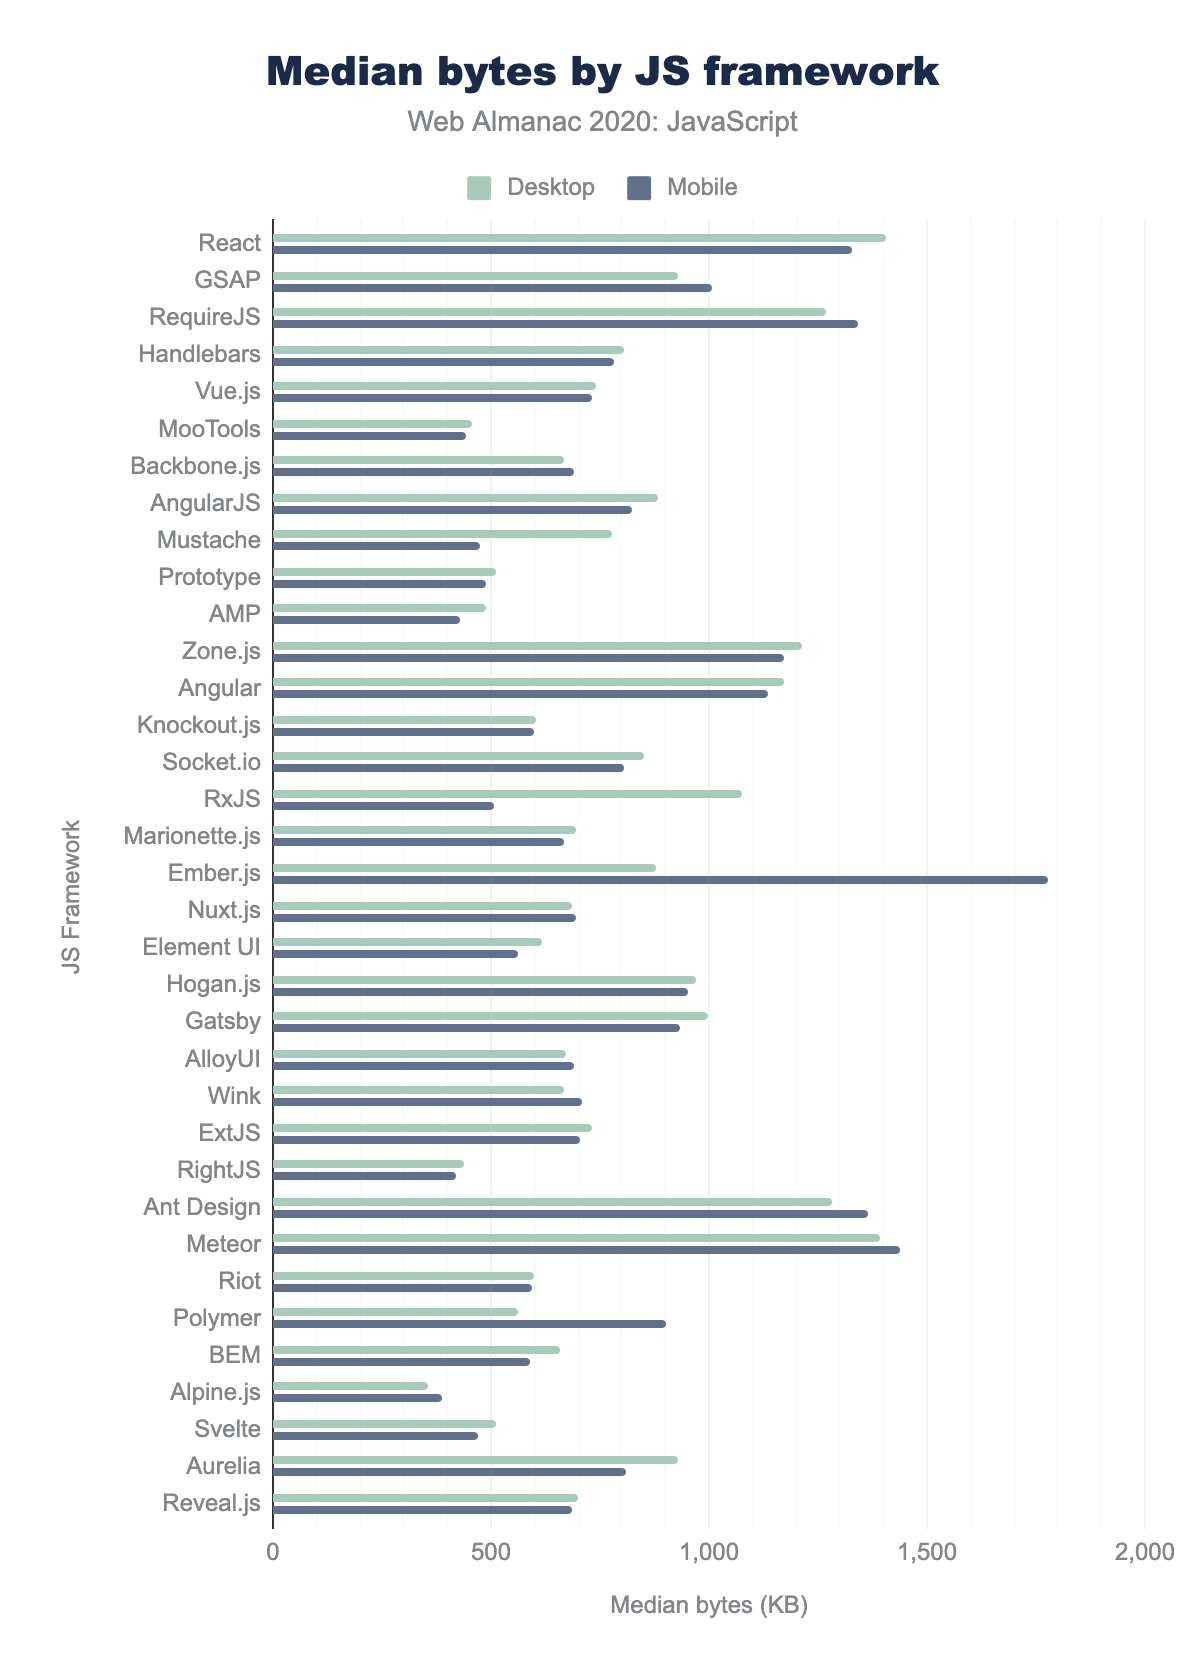
On one of the spectrum are frameworks like React or Angular or Ember, which tend to ship a lot of code regardless of the client. On the other end, we see minimalist frameworks like Alpine.js and Svelte showing very promising results. Defaults are very important, and it seems that by starting with highly performant defaults, Svelte and Alpine are both succeeding (so far… the sample size is pretty small) in creating a lighter set of pages.
We get a very similar picture when looking at main thread time for pages where these tools were detected.
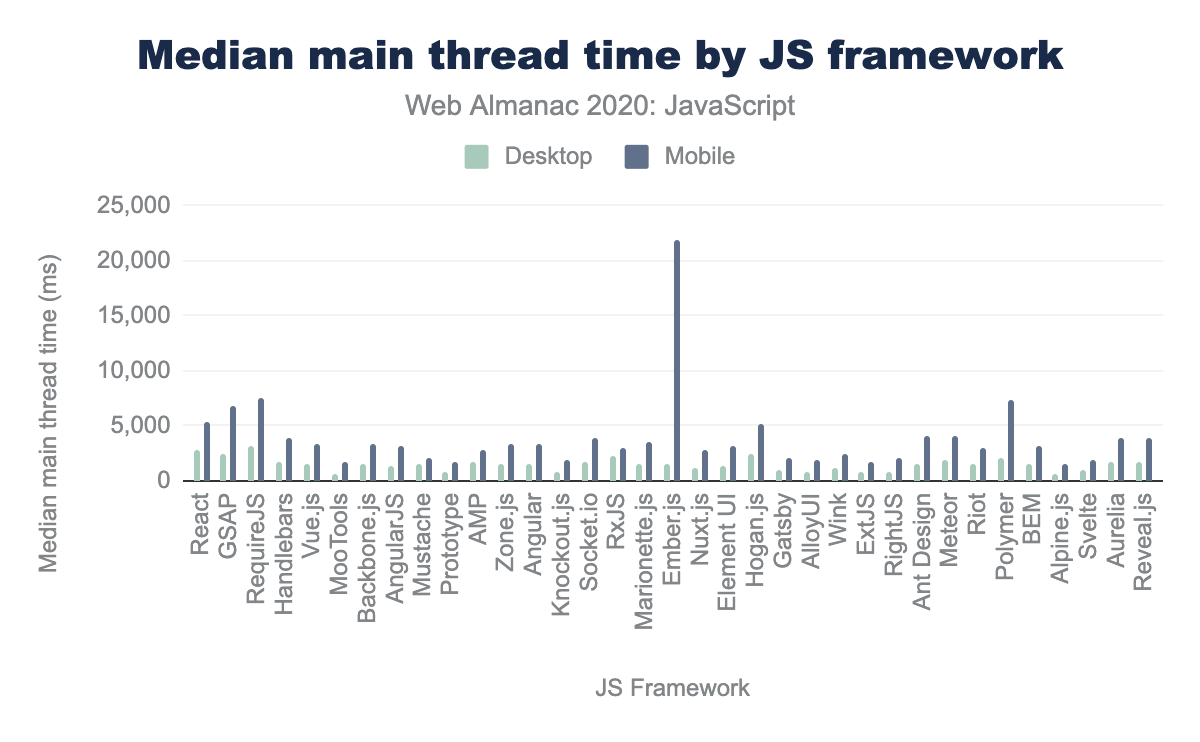
Ember’s mobile main thread time jumps out and kind of distorts the graph with how long it takes. (I spent some more time looking into this and it appears to be heavily influenced by one particular platform using this framework inefficiently, rather than an underlying problem with Ember itself.) Pulling it out makes the picture a bit easier to understand.
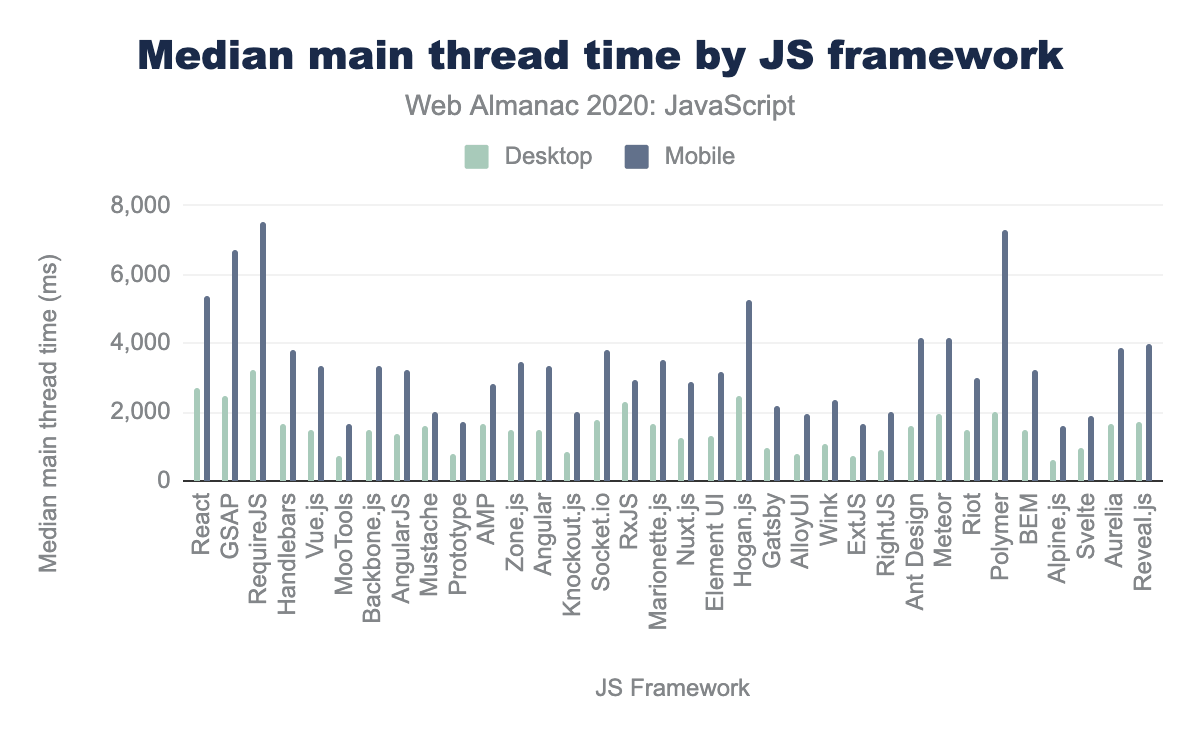
Tools like React, GSAP, and RequireJS tend to spend a lot of time on the main thread of the browser, regardless of whether it’s a desktop or mobile page view. The same tools that tend to lead to less code overall—tools like Alpine and Svelte—also tend to lead to lower impact on the main thread.
The gap between the experience a framework provides for desktop and mobile is also worth digging into. Mobile traffic is becoming increasingly dominant, and it’s critical that our tools perform as well as possible for mobile pageviews. The bigger the gap we see between desktop and mobile performance for a framework, the bigger the red flag.
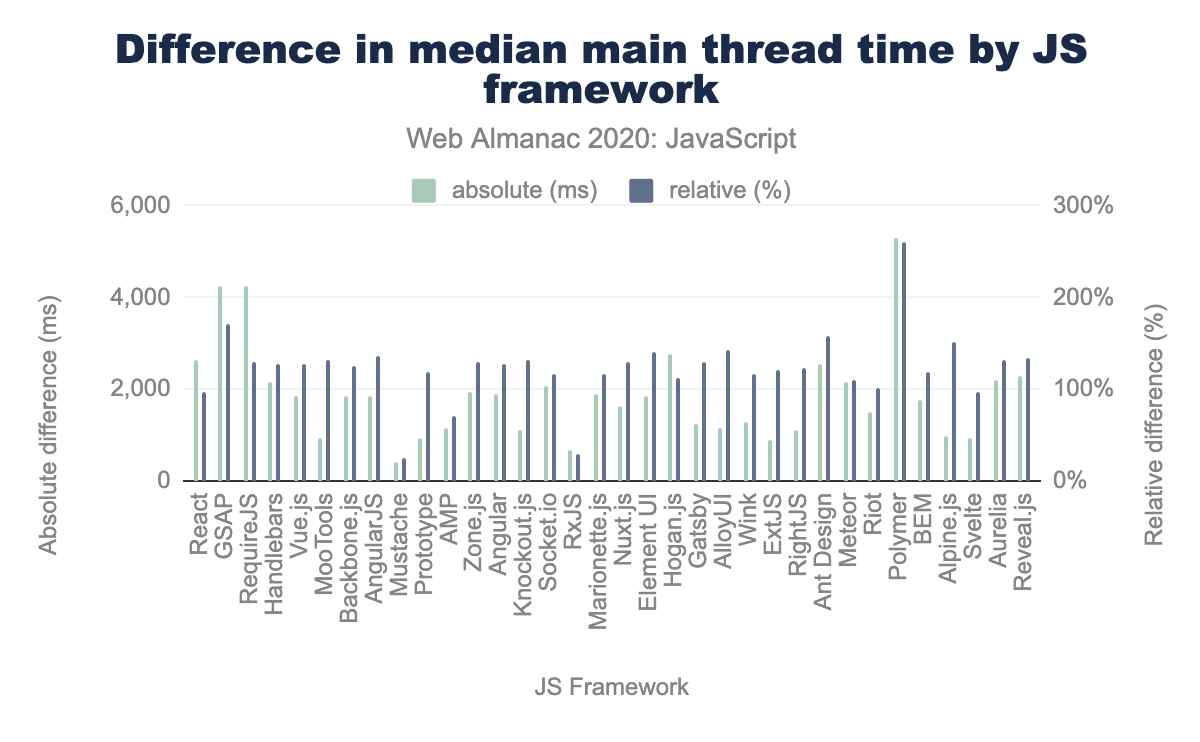
As you would expect, there’s a gap for all tools in use due to the lower processing power of the emulated Moto G4. Ember and Polymer seem to jump out as particularly egregious examples, while tools like RxJS and Mustache vary only minorly from desktop to mobile.
What’s the impact?
We have a pretty good picture now of how much JavaScript we use, where it comes from, and what we use it for. While that’s interesting enough on its own, the real kicker is the “so what?” What impact does all this script actually have on the experience of our pages?
The first thing we should consider is what happens with all that JavaScript once its been downloaded. Downloading is only the first part of the JavaScript journey. The browser still has to parse all that script, compile it, and eventually execute it. While browsers are constantly on the lookout for ways to offload some of that cost to other threads, much of that work still happens on the main thread, blocking the browser from being able to do layout or paint-related work, as well as from being able to respond to user interaction.
If you recall, there was only a 30 KB difference between what is shipped to a mobile device versus a desktop device. Depending on your point of view, you could be forgiven for not getting too upset about the small gap in the amount of code sent to a desktop browser versus a mobile one—after all, what’s an extra 30 KB or so at the median, right?
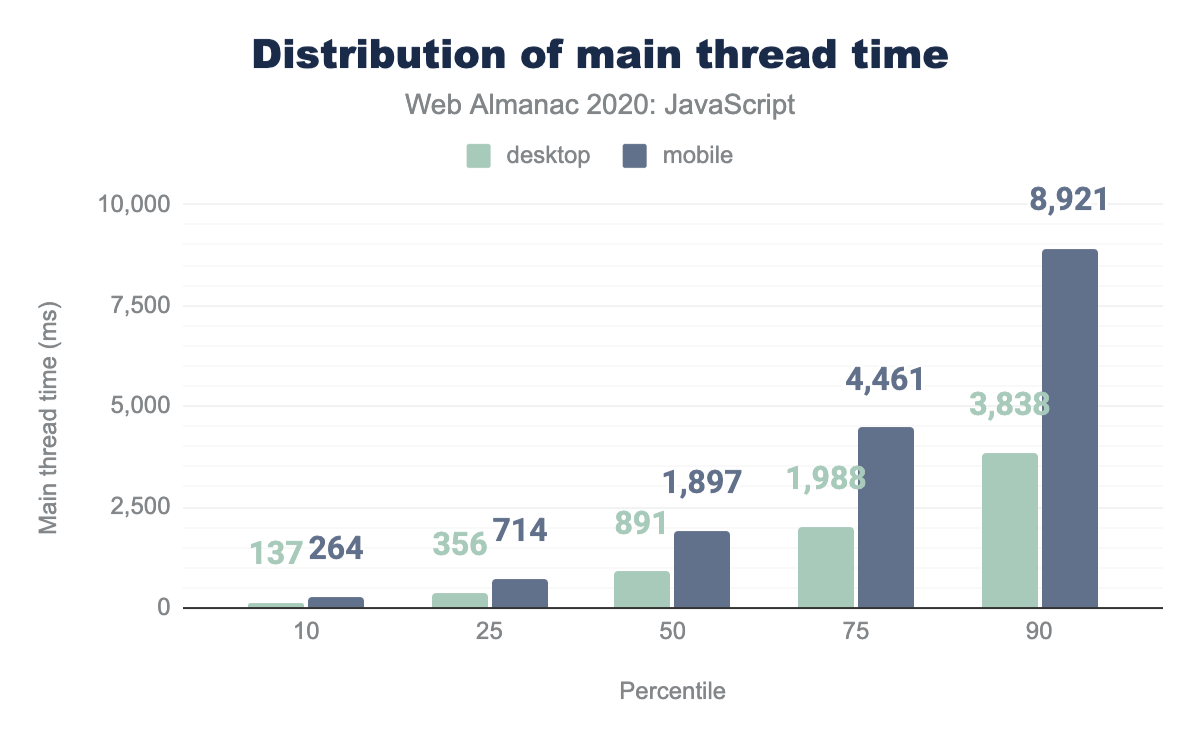
The biggest problem comes when all of that code gets served to a low-to-middle-end device, something a bit less like the kind of devices most developers are likely to have, and a bit more like the kind of devices you’ll see from the majority of people across the world. That relatively small gap between desktop and mobile is much more dramatic when we look at it in terms of processing time.
The median desktop site spends 891 ms on the main thread of a browser working with all that JavaScript. The median mobile site, however, spends 1,897 ms—over two times the time spent on the desktop. It’s even worse for the long tail of sites. At the 90th percentile, mobile sites spend a staggering 8,921 ms of main thread time dealing with JavaScript, compared to 3,838 ms for desktop sites.
Correlating JavaScript use to Lighthouse scoring
One way of looking at how this translates into impacting the user experience is to try to correlate some of the JavaScript metrics we’ve identified earlier with Lighthouse scores for different metrics and categories.
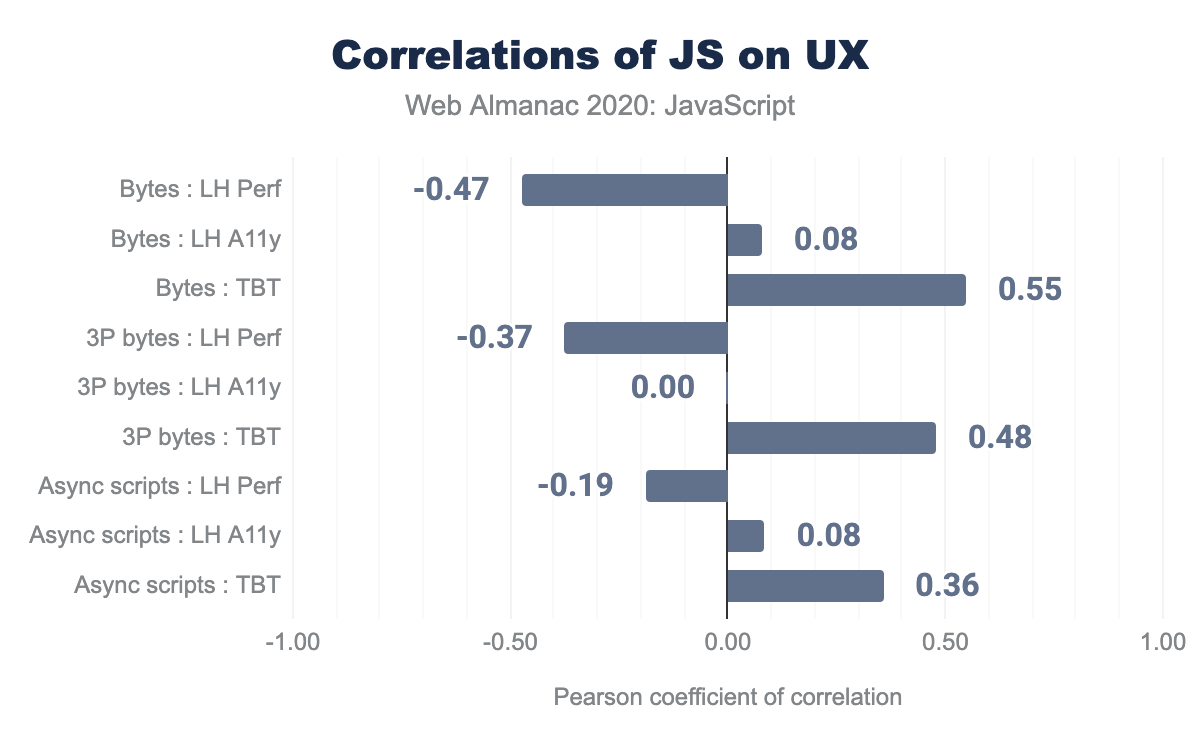
The above chart uses the Pearson coefficient of correlation. There’s a long, kinda complex definition of what that means precisely, but the gist is that we’re looking for the strength of the correlation between two different numbers. If we find a coefficient of 1.00, we’d have a direct positive correlation. A correlation of 0.00 would show no connection between two numbers. Anything below 0.00 indicates a negative correlation—in other words, as one number goes up the other one decreases.
First, there doesn’t seem to be much of a measurable correlation between our JavaScript metrics and the Lighthouse accessibility (“LH A11y” in the chart) score here. That stands in stark opposition to what’s been found elsewhere, notably through WebAim’s annual research.
The most likely explanation for this is that Lighthouse’s accessibility tests aren’t as comprehensive (yet!) as what is available through other tools, like WebAIM, that have accessibility as their primary focus.
Where we do see a strong correlation is between the amount of JavaScript bytes (“Bytes”) and both the overall Lighthouse performance (“LH Perf”) score and Total Blocking Time (“TBT”).
The correlation between JavaScript bytes and Lighthouse performance scores is -0.47. In other words, as JS bytes increase, Lighthouse performance scores decrease. The overall bytes has a stronger correlation than the amount of third-party bytes (“3P bytes”), hinting that while they certainly play a role, we can’t place all the blame on third-parties.
The connection between Total Blocking Time and JavaScript bytes is even more significant (0.55 for overall bytes, 0.48 for third-party bytes). That’s not too surprising given what we know about all the work browsers have to do to get JavaScript to run in a page—more bytes means more time.
Security vulnerabilities
One other helpful audit that Lighthouse runs is to check for known security vulnerabilities in third-party libraries. It does this by detecting which libraries and frameworks are used on a given page, and what version is used of each. Then it checks Snyk’s open-source vulnerability database to see what vulnerabilities have been discovered in the identified tools.
According to the audit, 83.5% of mobile pages use a JavaScript library or framework with at least one known security vulnerability.
This is what we call the jQuery effect. Remember how we saw that jQuery is used on a whopping 83% of pages? Several older versions of jQuery contain known vulnerabilities, which comprises the vast majority of the vulnerabilities this audit checks.
Of the roughly 5 million or so mobile pages that are tested against, 81% of them contain a vulnerable version of jQuery—a sizeable lead over the second most commonly found vulnerable library—jQuery UI at 15.6%.
| Library | Vulnerable pages |
|---|---|
| jQuery | 80.86% |
| jQuery UI | 15.61% |
| Bootstrap | 13.19% |
| Lodash | 4.90% |
| Moment.js | 2.61% |
| Handlebars | 1.38% |
| AngularJS | 1.26% |
| Mustache | 0.77% |
| Dojo | 0.58% |
| jQuery Mobile | 0.53% |
In other words, if we can get folks to migrate away from those outdated, vulnerable versions of jQuery, we would see the number of sites with known vulnerabilities plummet (at least, until we start finding some in the newer frameworks).
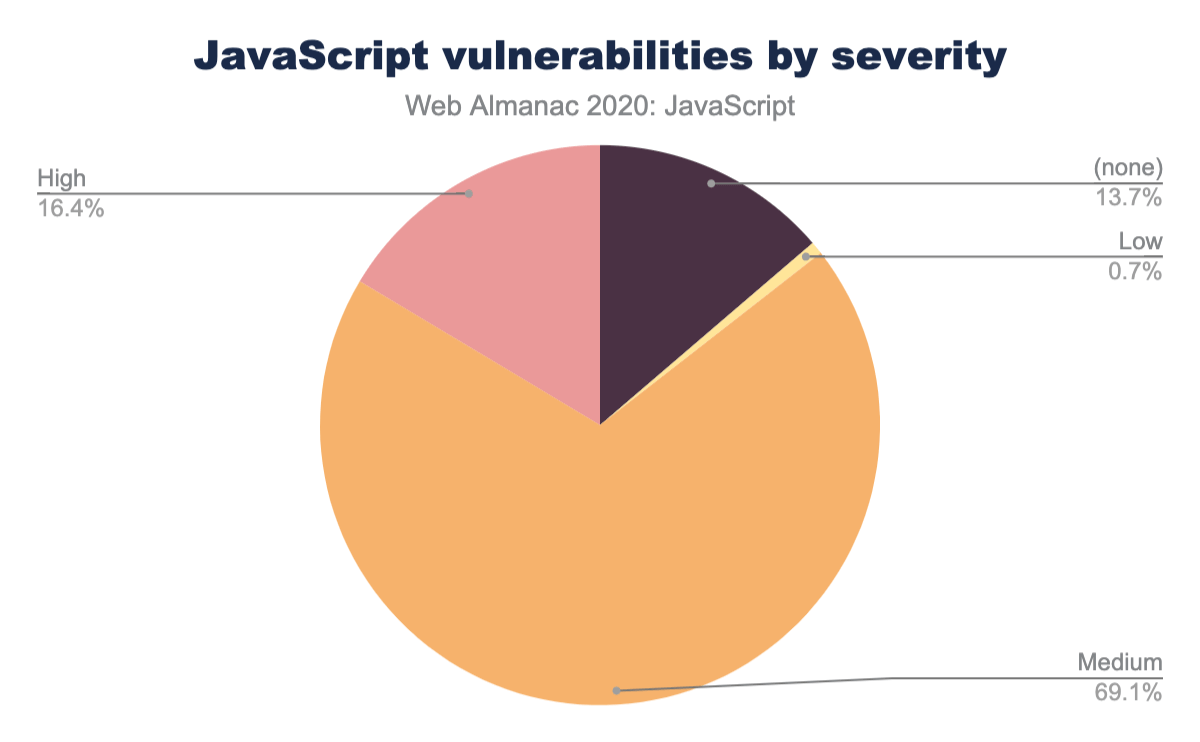
The bulk of the vulnerabilities found fall into the “medium” severity category.
Conclusion
JavaScript is steadily rising in popularity, and there’s a lot that’s positive about that. It’s incredible to consider what we’re able to accomplish on today’s web thanks to JavaScript that, even a few years ago, would have been unimaginable.
But it’s clear we’ve also got to tread carefully. The amount of JavaScript consistently rises each year (if the stock market were that predictable, we’d all be incredibly wealthy), and that comes with trade-offs. More JavaScript is connected to an increase in processing time which negatively impacts key metrics like Total Blocking Time. And, if we let those libraries languish without keeping them updated, they carry the risk of exposing users through known security vulnerabilities.
Carefully weighing the cost of the scripts we add to our pages and being willing to place a critical eye on our tools and ask more of them are our best bets for ensuring that we build a web that is accessible, performant, and safe.
