Ecommerce

Introduction
An “ecommerce platform” is a set of software or services that enables you to create and operate an online store. There are several types of ecommerce platforms, for example:
- Paid-for services such as Shopify that host your store and help you get started. They provide website hosting, site and page templates, product-data management, shopping carts and payments.
- Software platforms such as Magento Open Source which you set up, host and manage yourself. These platforms can be powerful and flexible but may be more complex to set up and run than services such as Shopify.
- Hosted platforms such as Magento Commerce that offer the same features as their self-hosted counterparts, except that hosting is managed as a service by a third-party.
Last year’s analysis could only detect sites built on an ecommerce platform. This means that most large online stores and marketplaces—such as Amazon, JD, and eBay or any ecommerce sites built using in-house platforms (typically by bigger businesses) were not part of the analysis. For this year’s analysis, this limitation was addressed by enhancing Wappalyzer’s detection of ecommerce sites. See the Platform detection section for more details.
Also note that the data here is for home pages only: not category, product or other pages. Learn more about our methodology.
Platform detection
How do we check if a page is on an ecommerce platform? Detection is done through Wappalyzer. Wappalyzer is a cross-platform utility that uncovers the technologies used on websites. It detects content management systems, ecommerce platforms, web servers, JavaScript frameworks, analytics tools, and many more technologies.
Compared to 2019, you will notice that in 2020, % of ecommerce websites have increased significantly. This is primarily due to improved detection in Wappalyzer this year using secondary signals. These secondary signals include following:
- Sites using Google Analytics Enhanced Ecommerce tagging is counted as an ecommerce site.
- Secondary signal also includes looking for most commonly used patterns for identifying ’Cart’ links.
This change in methodology provides enhanced coverage for enterprise platforms and sites built using headless solutions.
Limitations
Our methodology has the following limitations:
- Headless ecommerce platforms like commercetools may not get detected as ecommerce platform but if we are able to detect presence of cart on such sites, we will still include sites using such platforms in our overall coverage stats.
- Technologies which are typically deployed outside home pages (e.g. WebAR on product detail pages) are not detected.
- Due to our crawl originating from US, there may be some bias towards US specific platforms. For example, if a global business has ecommerce sites built on different platforms for different countries (using country specific domains/sub-domains), it may not show these regional differences in our analysis.
- It’s common for B2B sites to hide the cart functionality behind a login and due to that this study is not a correct representation of B2B market.
Ecommerce platforms
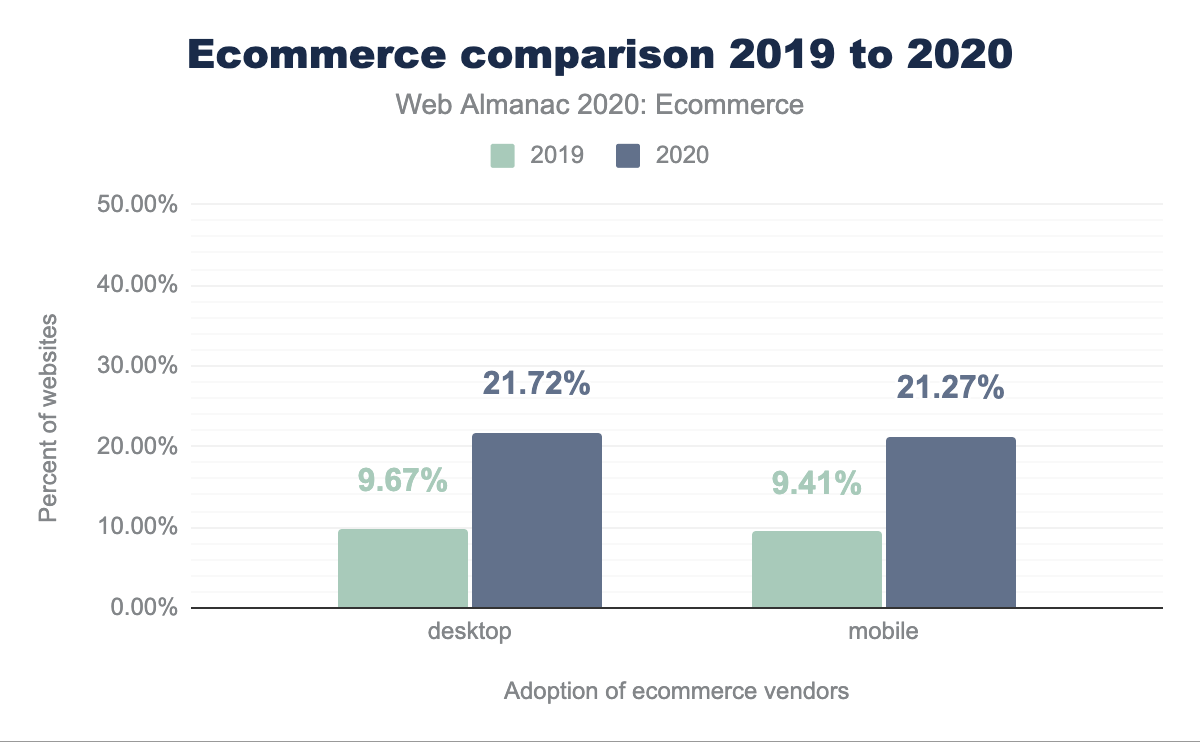
In total, 21.72% of mobile websites and 21.27% of desktop websites used an ecommerce platform. For 2019, the same number was 9.41% for mobile websites and 9.67% for desktop websites.
Top ecommerce platforms
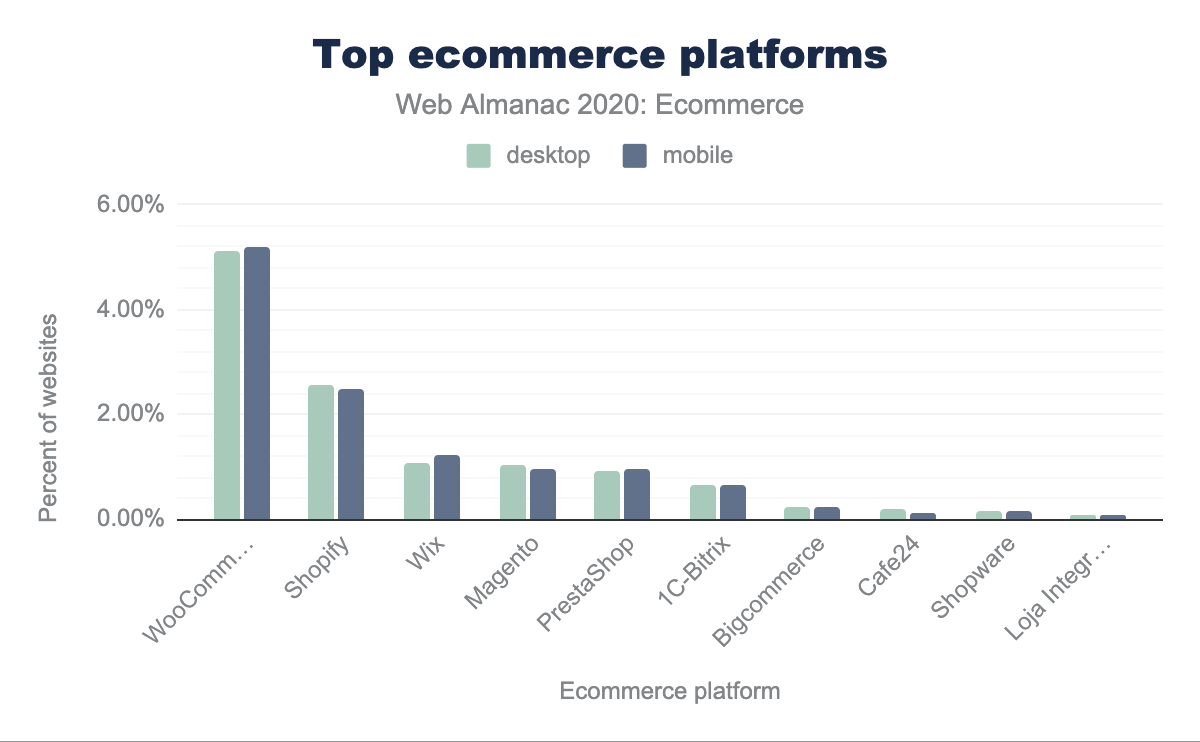
Our analysis counted 145 separate ecommerce platforms (compared to 116 in last year’s analysis). Out of these, only 9 platforms have market share of greater than 0.1%. WooCommerce is the most common ecommerce platform and has maintained its number one position. Wix appears in this analysis for the first time this year, after Wappalyzer started identifying it as ecommerce platform from 30th Jun 2019.
Top enterprise ecommerce platforms
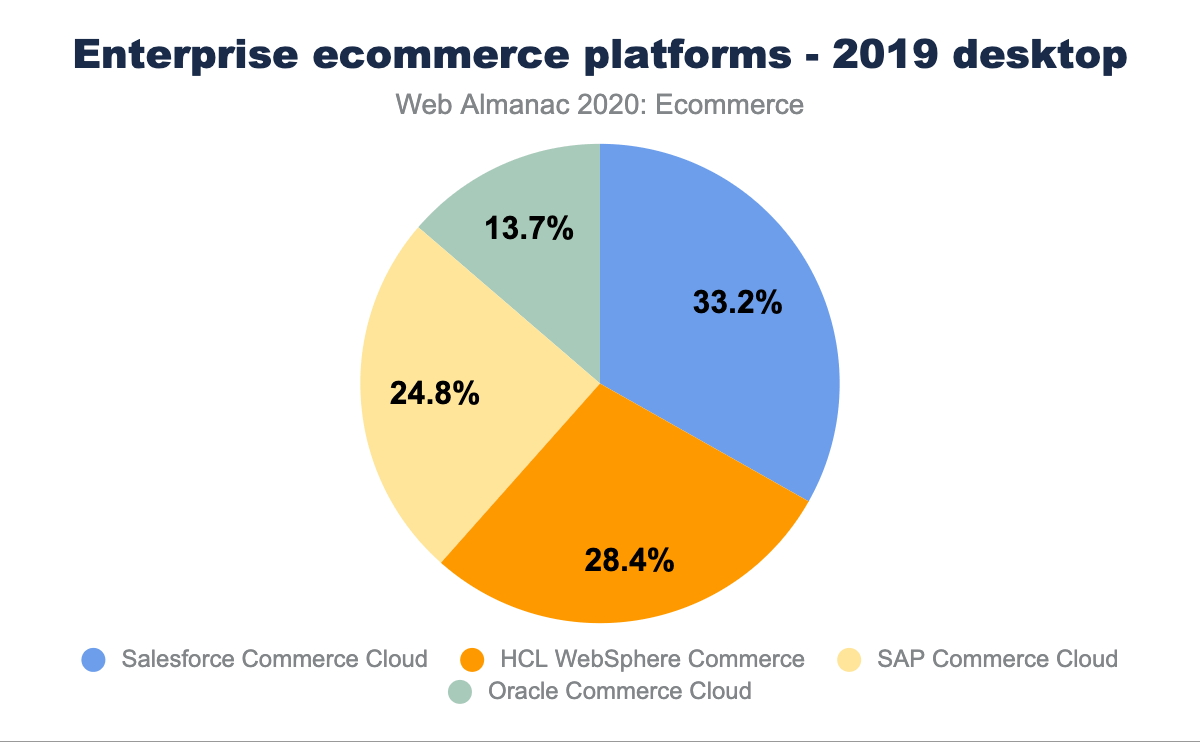
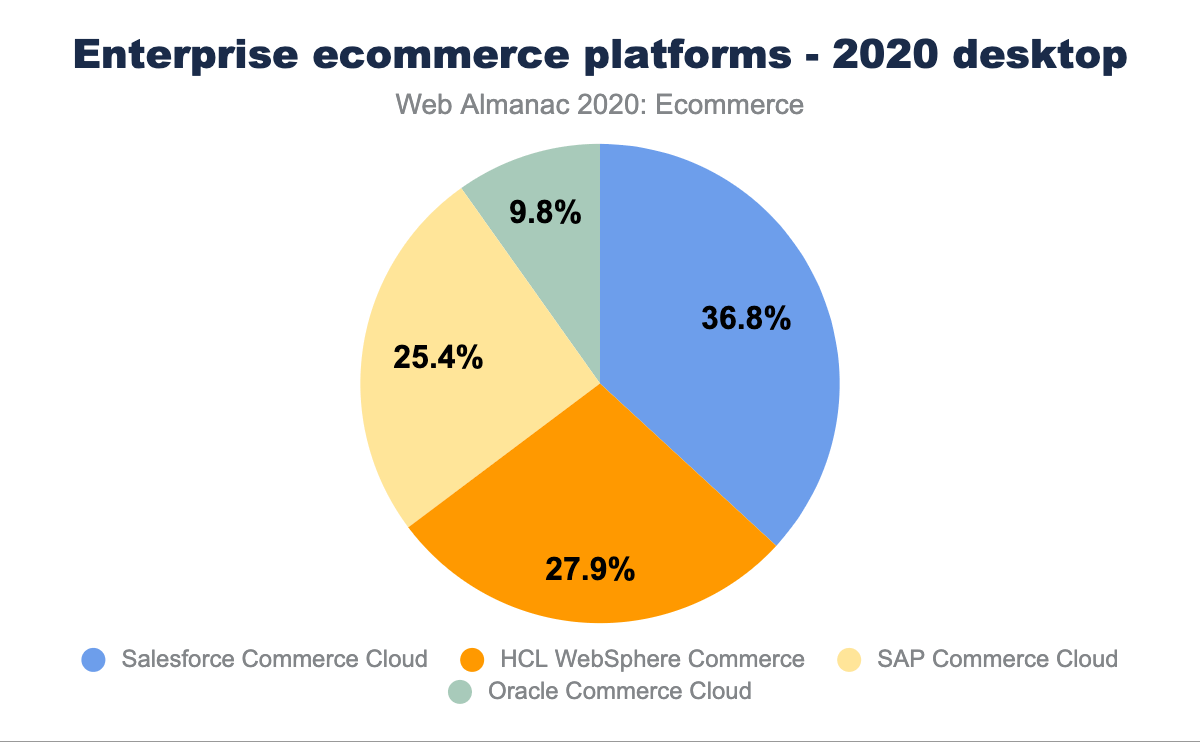
While it is difficult to discern a platform’s precise tier let us highlight four vendors who focus heavily on the Enterprise tier—Salesforce, HCL, SAP, and Oracle.
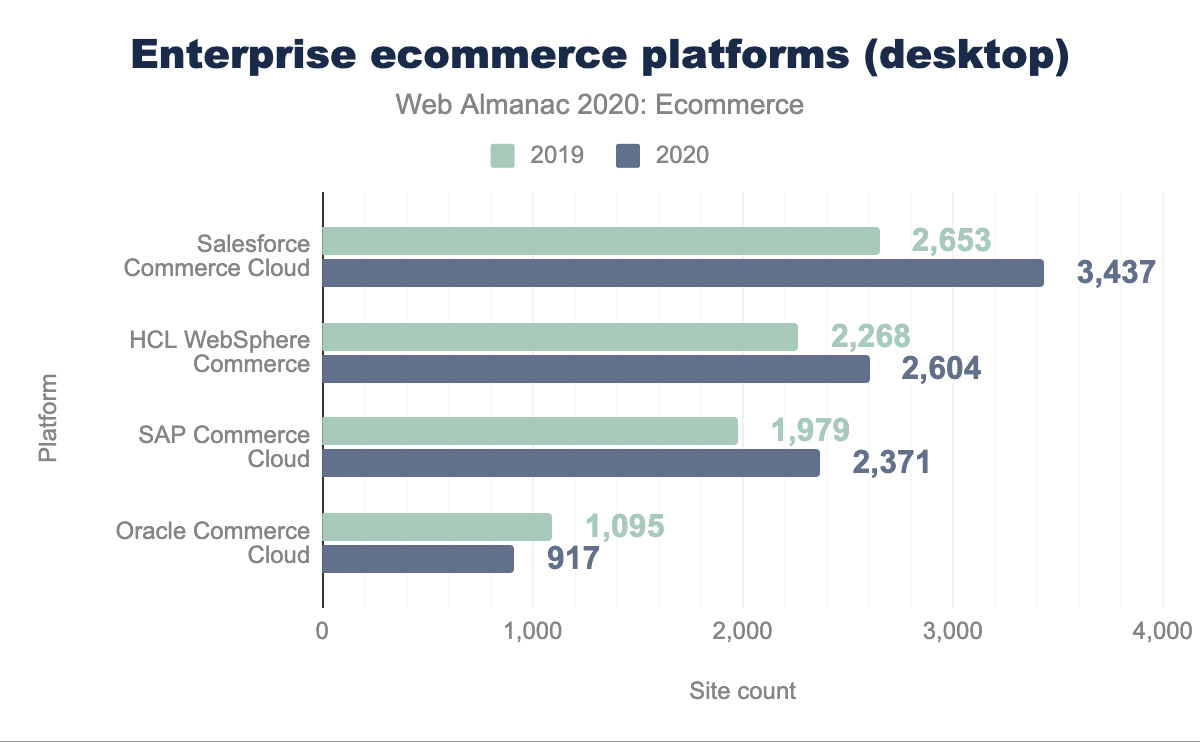
Salesforce Commerce Cloud remains the leading platform from this group. The 3,437 desktop websites in 2020 represent a 29.5% increase from 2019’s 2,653 desktop websites. Salesforce’s websites account for 36.8% of the four enterprise ecommerce platforms.
HCL Technologies acquired WebSphere Commerce from IBM in July 2019. The transition had mixed results in 2020. While HCL’s WebSphere Commerce increased their desktop website count by a 14.8% increase this year up to 2,604 from 2019’s 2,268 desktop websites, there was a slip in popularity by 0.5% within this group down to 27.9%. Something to watch for in the future.
SAP Commerce Cloud, formally known as Hybris, remains the third most popular enterprise ecommerce platform at 25.4% which is a slight increase from last year’s 24.8%. The 2,371 desktop websites is a 19.8% increase from the 1,979 desktop sites found in 2019 attributed to Hybris.
Lastly, Oracle Commerce Cloud unfortunately lost a bit of traction between 2019 and 2020. The desktop websites fell from 1,095 to 917, down 16%, and in turn their Enterprise ecommerce platform foothold fell from 13.7% to 9.8%.
Shopify’s Shopify Plus, Adobe’s Magento Enterprise and Bigcommerce’s Enterprise offerings are available and gaining traction but the Platform Detection limitations hamper any ability to isolate the Enterprise websites from their Community or Commercial websites.
COVID-19 impact on ecommerce
COVID-19 has had a huge impact on the world and necessitated an even bigger move online. Measuring the total increase in ecommerce platforms is influenced by the greatly increased detection undertaken in part for this chapter. So instead we look at some of the platforms that were already being detected and note an increase in their usage - particularly since March 2020 when COVID started impacting large parts of the world:
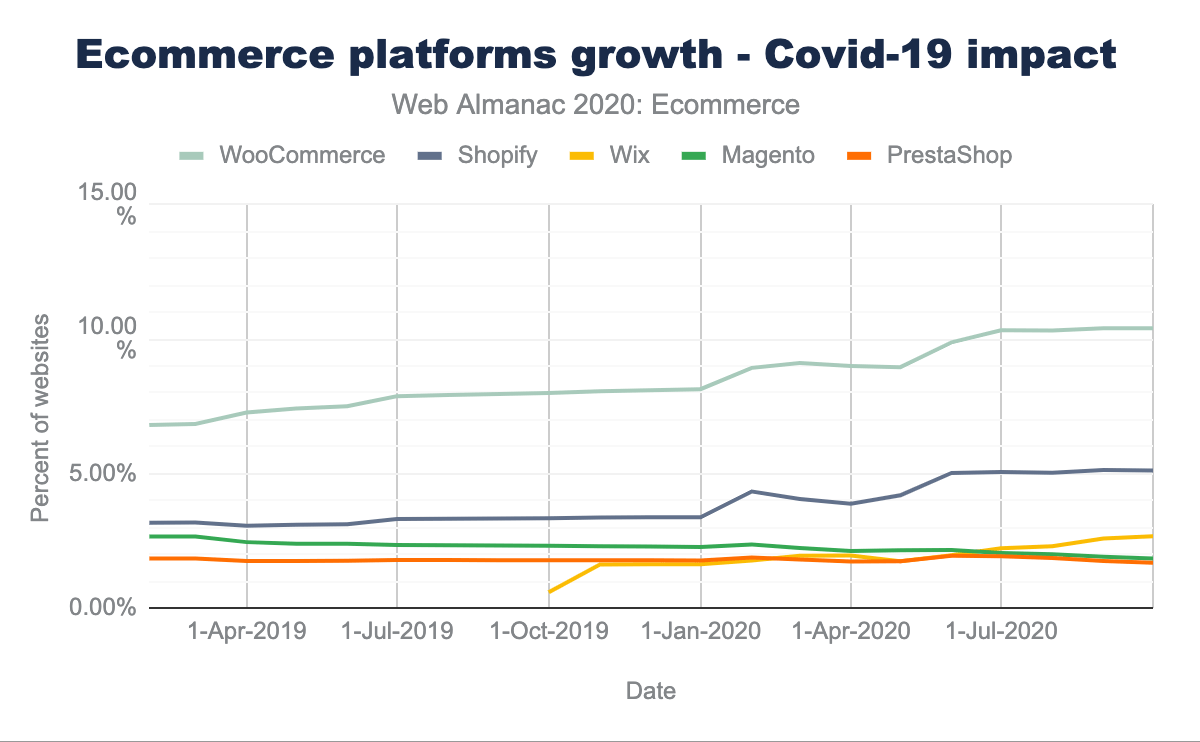
There is definitely a measurable increase WooCommerce and Shopify sites around the time COVID started really impacting the world.
Page weight and requests
The page weight of an ecommerce platform includes all HTML, CSS, JavaScript, JSON, XML, images, audio, and video.
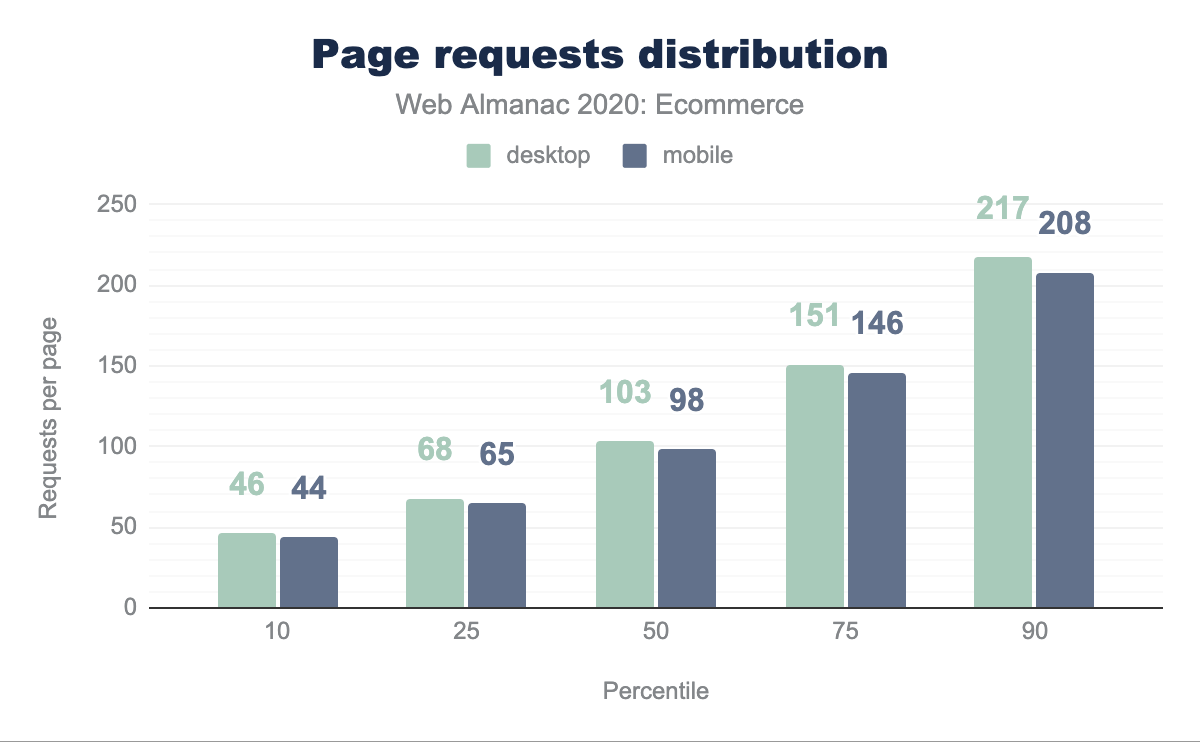
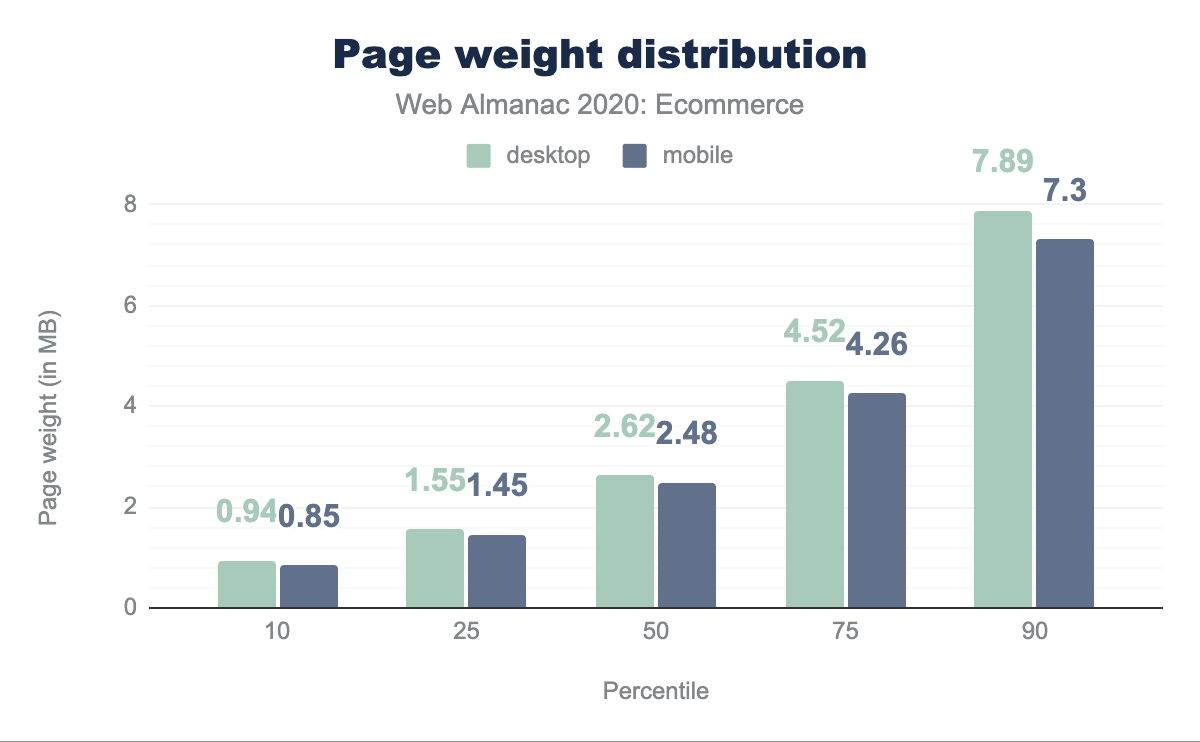
Promisingly, mobile page weights have dropped across all percentiles compared to 2019 while desktop page weights have remained the same more or less (except 90th percentile). Requests per page also dropped on mobile (9-11 requests less across all percentiles except 90th percentile) and on desktop.
Ecommerce sites are still larger in terms of requests and size compared to all sites, as shown in the Page Weight chapter.
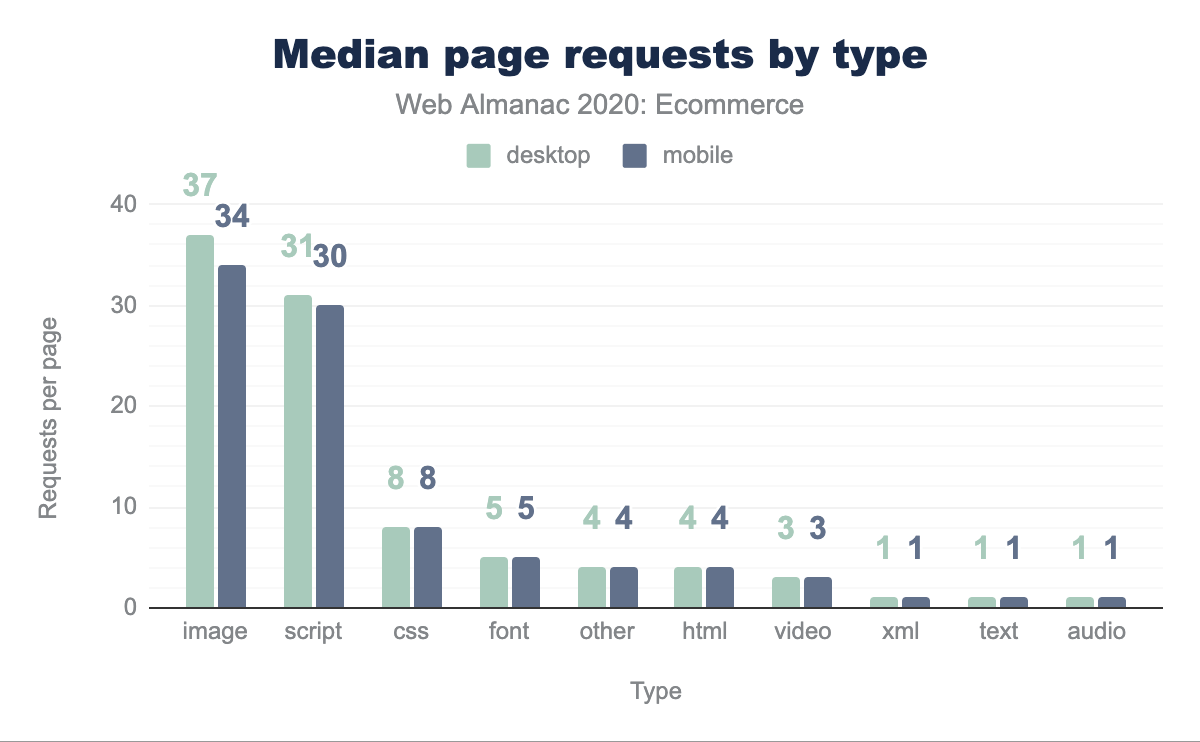
Page weight by resource type
Breaking this down by resource type, for median pages, we see that images and JavaScript requests dominate ecommerce pages:
However, when looking at actual bytes delivered, media are by far the largest assets:
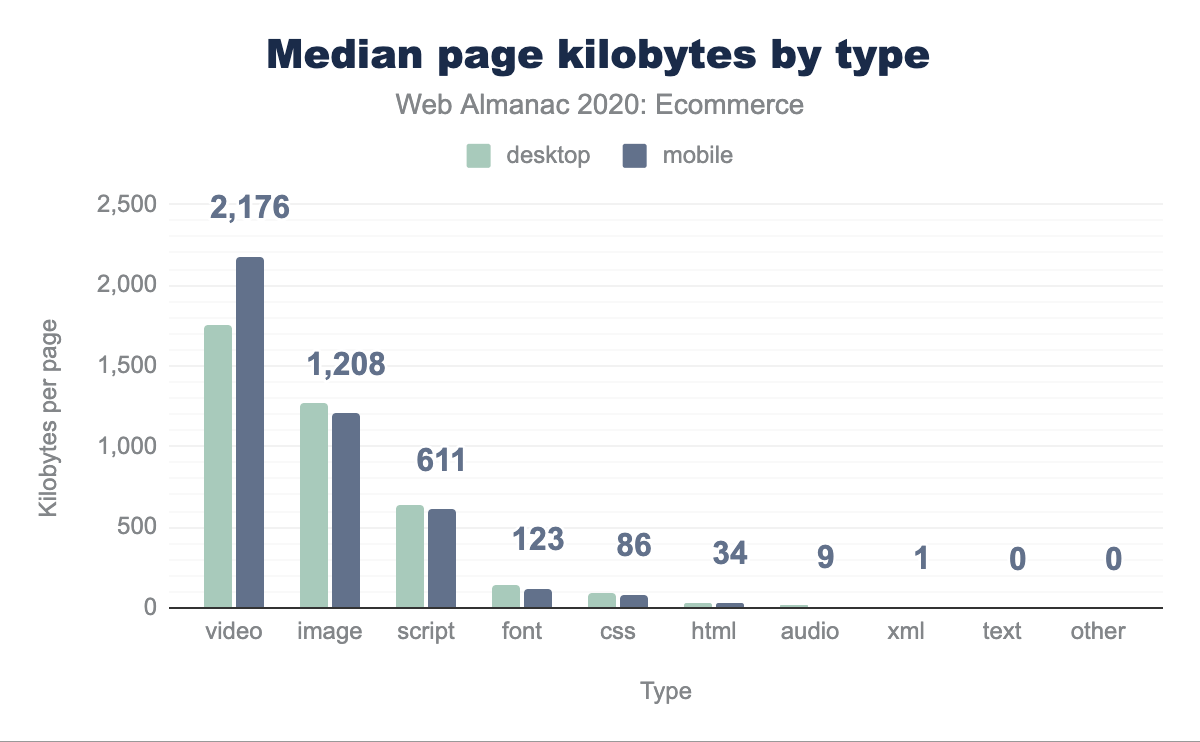
Video, despite accounting for a small number of requests, is by far largest resources on ecommerce sites, followed by images and then JavaScript.
HTML payload size
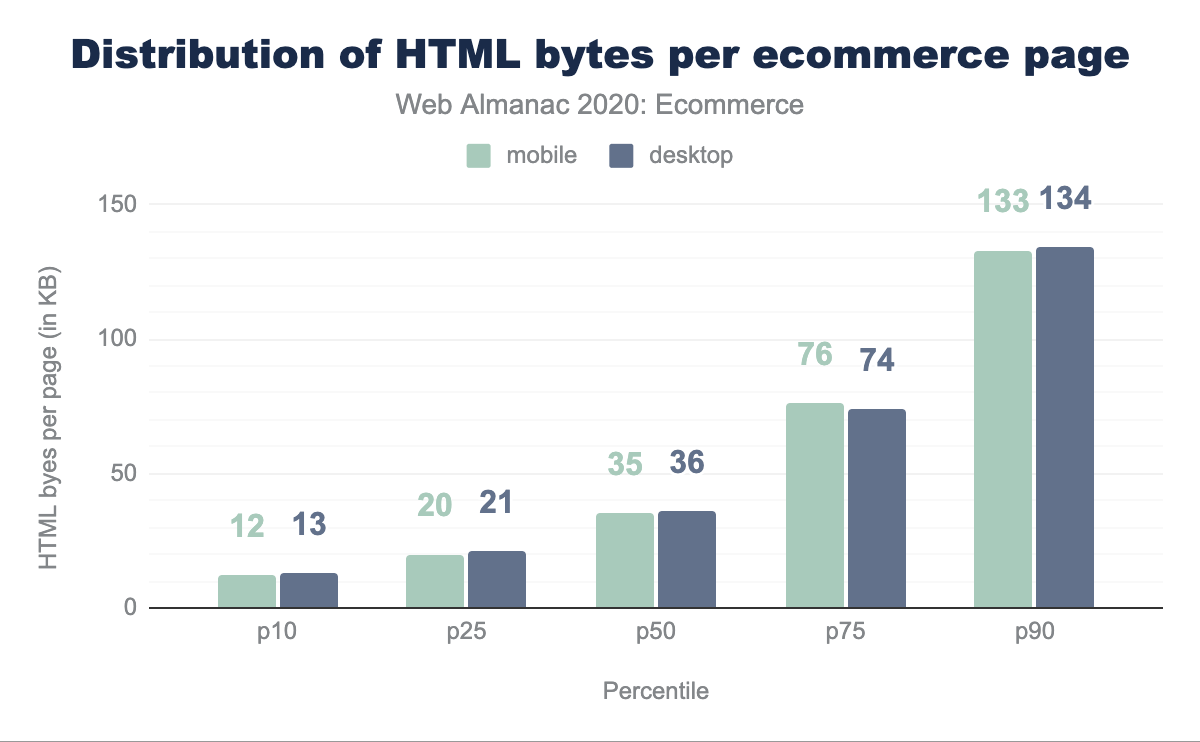
Note that HTML payloads may include other code such as inline JSON, JavaScript, or CSS directly in the markup itself, rather than referenced as external links. The median HTML payload size for ecommerce pages is 35 KB on mobile and 36 KB on desktop. Compared to 2019, median payload size and 10th, 25th and 50th percentiles have remained approximately the same. However, at 75th and 90th percentile, we see an increase of approximately 10kb and 15kb respectively across mobile and desktop.
Mobile HTML payload sizes are not very different from desktop. In other words, it appears that sites are not delivering significantly different HTML files for different devices or viewport sizes.
Image usage
Next, let’s look at how images are used on ecommerce sites. Note that because our data collection methodology does not simulate user interactions on pages like clicking or scrolling, images that are lazy loaded would not be represented in these results.
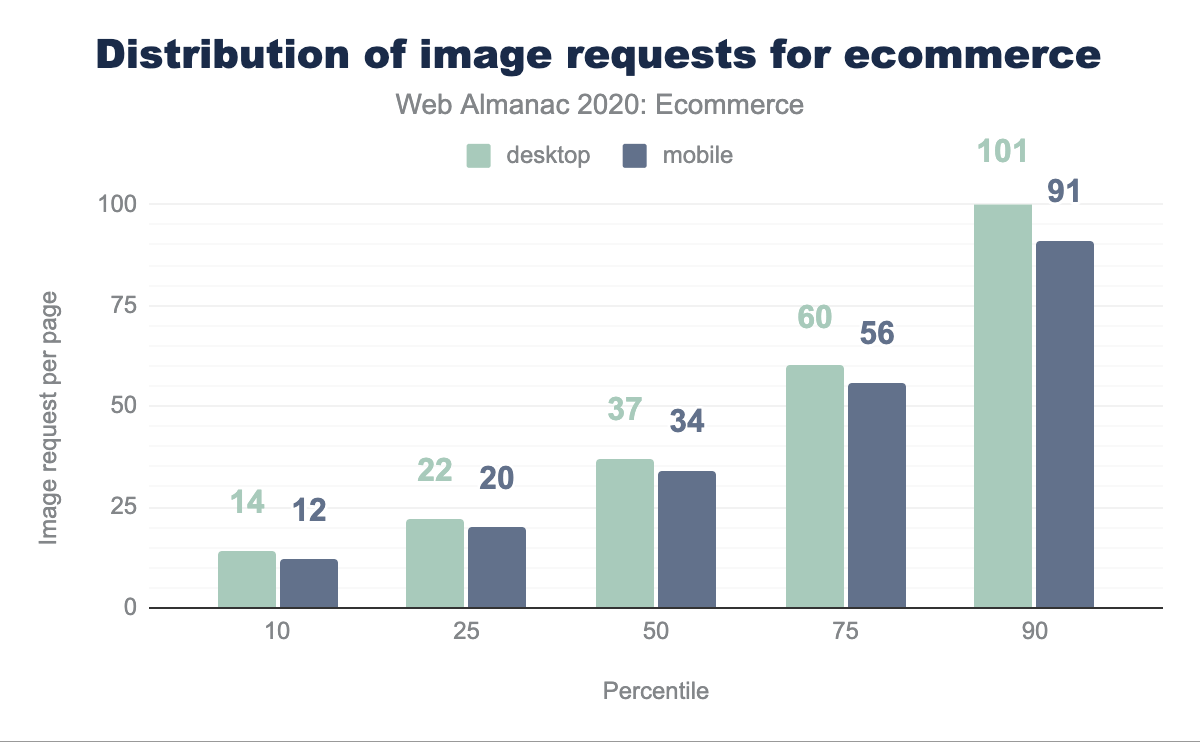
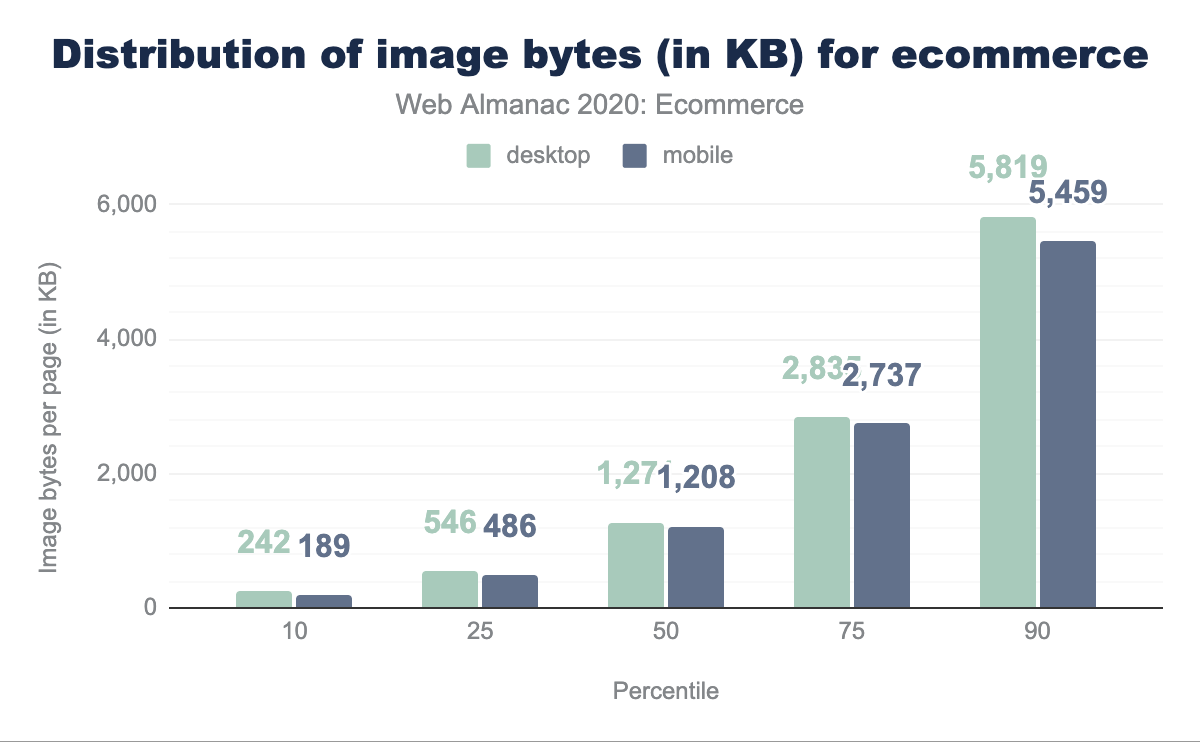
The figures above show that the median ecommerce page has 34 images and an image payload of 1,208 KB on mobile, 37 images and 1,271 KB on desktop. 10% of home pages have 90 or more images and an image payload of nearly between 5.5 MB on mobile and 5.8MB on desktop.
Compared to 2019, both median image requests and median image payloads have seen a drop. Median image requests dropped by 3 for both mobile and desktop. Median image payload also dropped by approximately 200kb-250kb across mobile and desktop. This drop may be driven by sites adopting lazy loading techniques such as usage of the loading="lazy" attribute which is now supported by more and more browsers. This year’s Markup chapter makes an observation usage for native lazy loading appears to be on the increase and around 3.86% of the pages use this in Aug-2020 and this has been on constant rise (as seen in this tweet).
Popular image formats
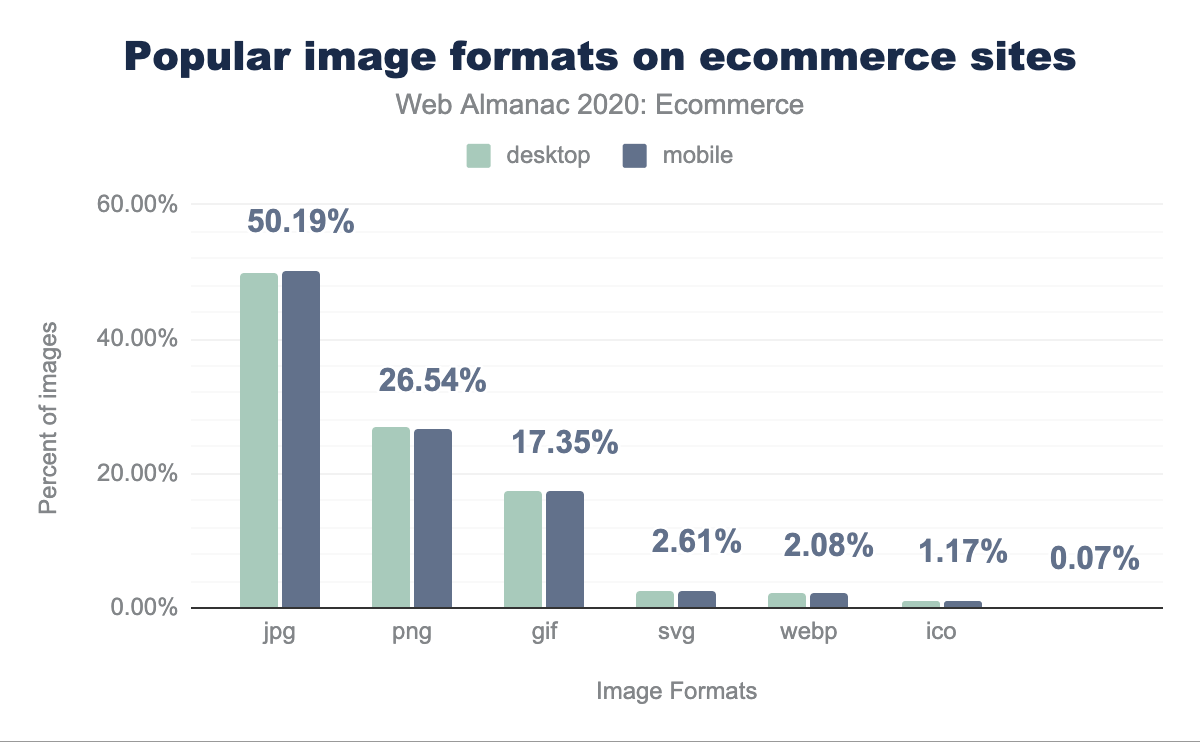
PNG usage remained roughly at the same level as 2019 (at 27% for both desktop and mobile). We observed drop in JPEG usage (4% for desktop and 6% for mobile). Out of this drop, most of it went towards increased GIF usage. GIFs are quite common on ecommerce home pages whereas GIFs may not be much used on product detail pages. Since our methodology only looks at home pages, this explains the significantly high usage of GIFs across ecommerce sites. Lighthouse has an audit which recommends using “video formats for animated content”. This is a technique ecommerce sites can use to optimize for performance but still retain animation properties of GIFs. See this article for more details.
WebP usage across ecommerce sites still remains very low though usage doubled and went from a total of 1% usage in 2019 to 2% usage in 2020. WebP format is now nearly 10 years old and even after allowing for progressive enhancement using the picture element, usage has remained low. In 2020, WebP got a new lease of life when Safari introduced support in Safari 14. However, the Web Almanac for this year is based on August 2020 and Safari support came in September 2020 so any stats presented here don’t reflect the impact of support added by Safari.
This year, in Chrome 85 (released in August 2020), we also saw support for AVIF which is a more efficient image format compared to WebP. In next year’s analysis, we hope to cover AVIF usage across ecommerce sites. Similar to WebP, AVIF is also a progressive enhancement and can be implemented using the picture element to address cross-browser concerns.
As per the author’s experience, there is a lack of awareness in engineering teams about image optimization services offered by CDNs where CDNs can do most of the heavy lifting without touching any code. For example, Adobe Scene7 offers this under their Smart Imaging solution. Clients on Salesforce Commerce Cloud using the platform’s embedded CDN capability (which uses Cloudflare) can enable this with a simple toggle. By increasing the awareness of such solutions, we can try to move the needle in favor of more efficient formats.
Another point for readers who are interested in improving CRUX metrics with images sizes/formats, currently progressive images provides no weightage towards Largest Contentful Paint despite being helpful for user-perceived performance. There is a fascinating discussion in the community on this topic and in the future it is possible that progressive images will contribute towards LCP. There may be renewed interest in the ecommerce community towards formats supporting progressive loading due to this and inclusion of Core Web Vitals in Page Experience signals from May 2021.
Third-party requests and bytes
Ecommerce platforms and sites often make use of third-party content. We use the Third Party Web project to detect third-party usage.
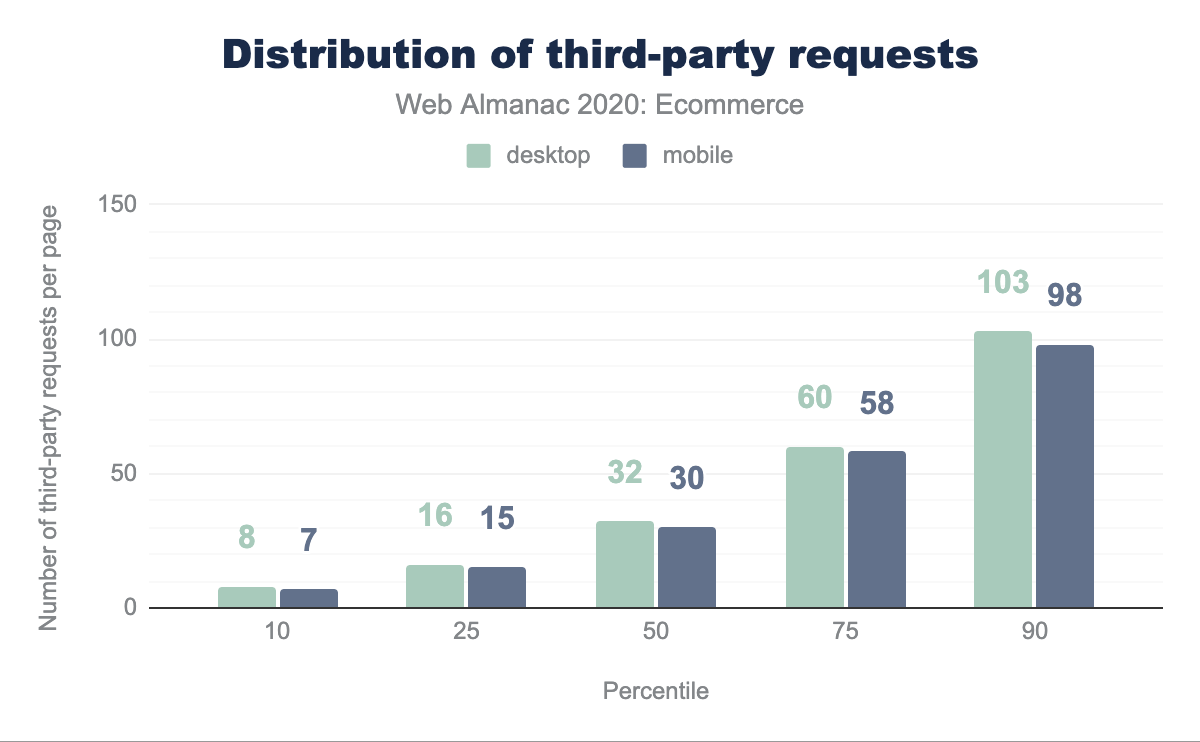
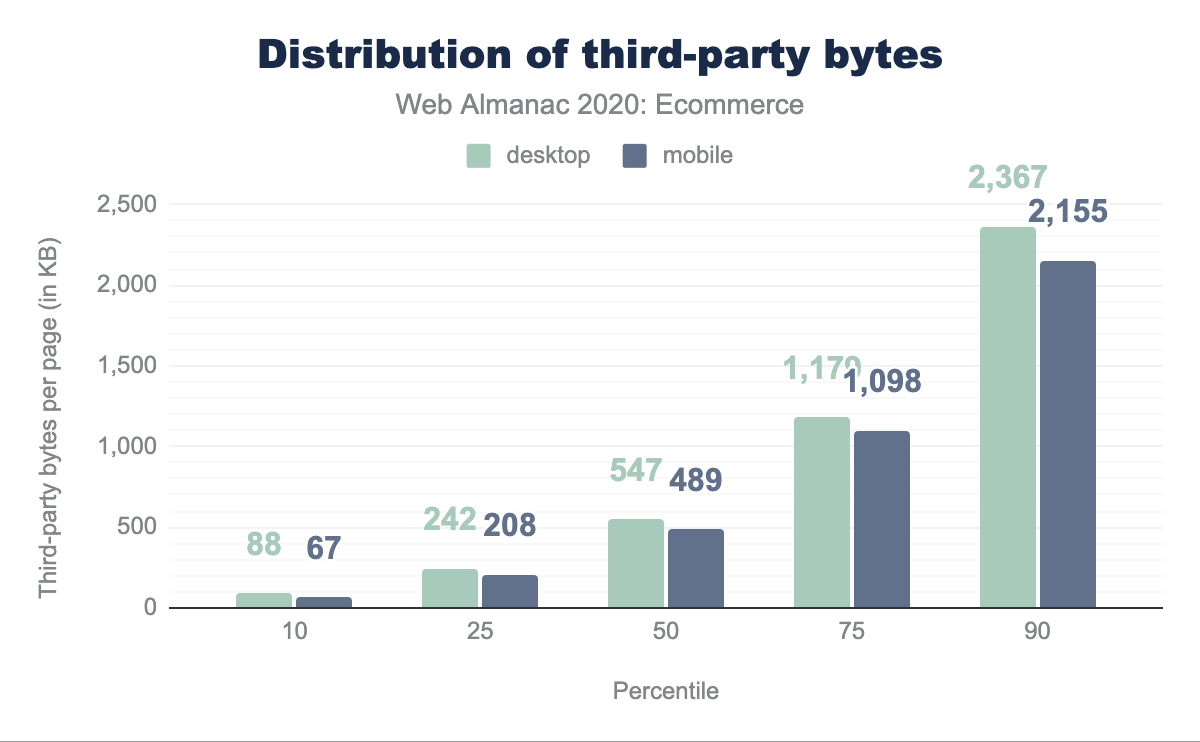
We see a significant increase in the use of third-party requests and bytes compared to last year’s third-party data, but have been unable to identify any particular cause or notable change in detection. We’d love to hear readers opinions on this as third-party usage seems to have basically doubled in the last year!
Ecommerce user experience
Ecommerce is all about converting customers and in order to do that a fast performing website is paramount. In this section, we try to shed light on real-world user experience of ecommerce websites. To achieve this, we turn our analysis towards some user-perceived performance metrics, which are captured in the three Core Web Vitals metrics.
Chrome User Experience Report
In this section we take a look at three important factors provided by the Chrome User Experience Report, which can shed light on our understanding of how users are experiencing ecommerce websites in the wild:
- Largest Contentful Paint (LCP)
- First Input Delay (FID)
- Cumulative Layout Shift (CLS)
These metrics aim to cover the core elements which are indicative of a great web user experience. The Performance chapter covers these in more detail, but here we are interested in looking at these metrics specifically for ecommerce websites. Let’s review each of these in turn.
Largest Contentful Paint
Largest Contentful Paint (LCP) measures the point when the page’s main content has likely loaded and thus the page is useful to the user. It does this by measuring the render time of the largest image or text block visible within the viewport.
This is different to First Contentful Paint (FCP), which measures from page load until content such as text or an image is first displayed. LCP is regarded as a good proxy for measuring when the main content of a page is loaded.
In the context of ecommerce, this metric provides very good indication of most useful content for the users (e.g. Hero banner image for landing pages, Image of 1st product displayed on a search/listings pages, Product image in case of a product detail page). Before this metric, sites had to explicitly instrument sites in their RUM solution but this metric democratizes the measurement for anybody who may not have resources or expertise to do this.
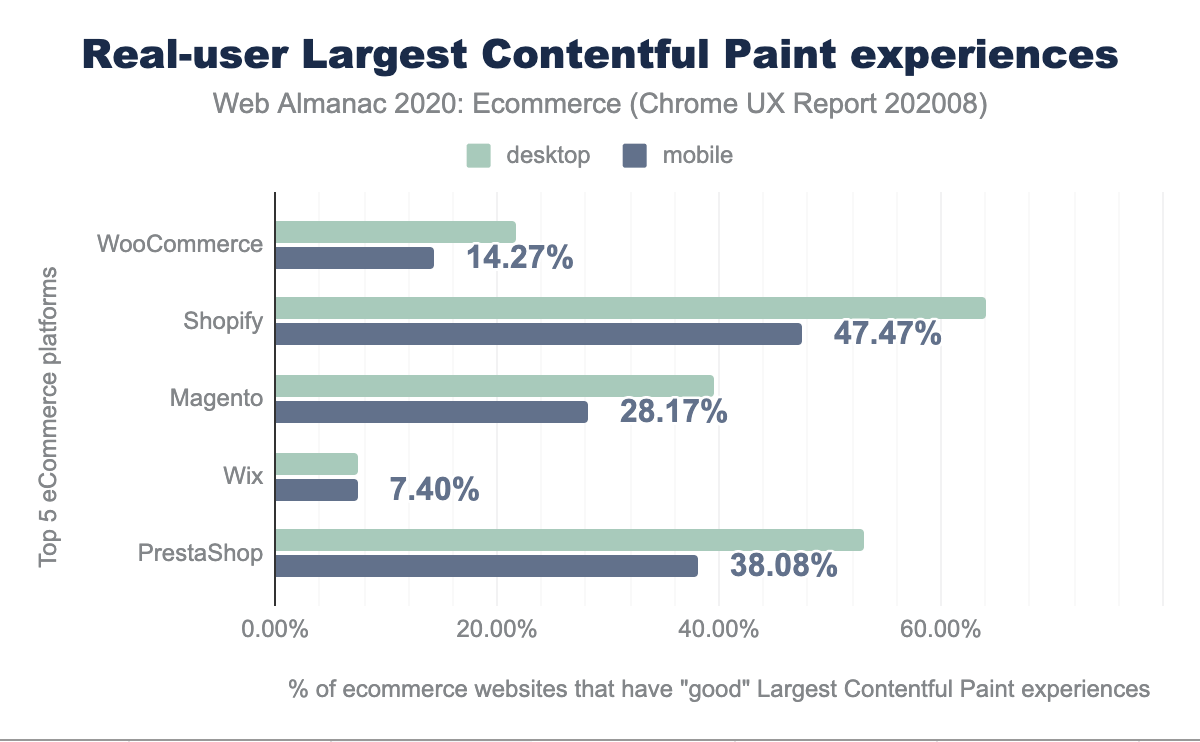
We see large degrees of variability across the major platforms with Wix, and WooCommerce in particular scoring very low. As two of the three most used ecommerce platforms, it seems they have some improvements to make!
First Input Delay
First Input Delay (FID) attempts to measure interactivity, or more importantly any barriers to interactivity when a page is unresponsive while busy processing the page.
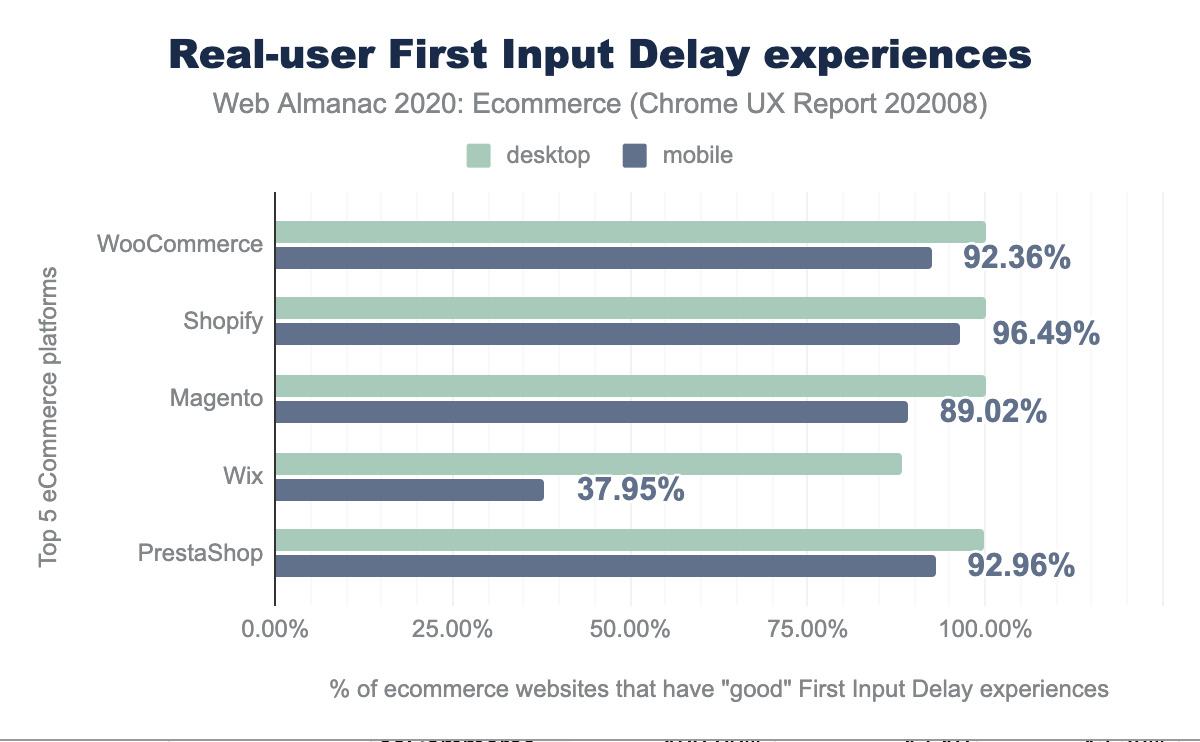
In general FID scores are typically higher than the other Core Web Vitals, and it is promising that ecommerce sites, despite making use of a lot of Media and JavaScript as we’ve seen earlier, maintain high scores in this category.
Cumulative Layout Shift
Cumulative Layout Shift (CLS) measures how much the page “jumps about” as new content is loaded and placed into the page. From our crawls this will be limited to initial page load above “the fold”, but ecommerce sites should understand that below the page fold or other interactions may impact CLS more than our stats show.
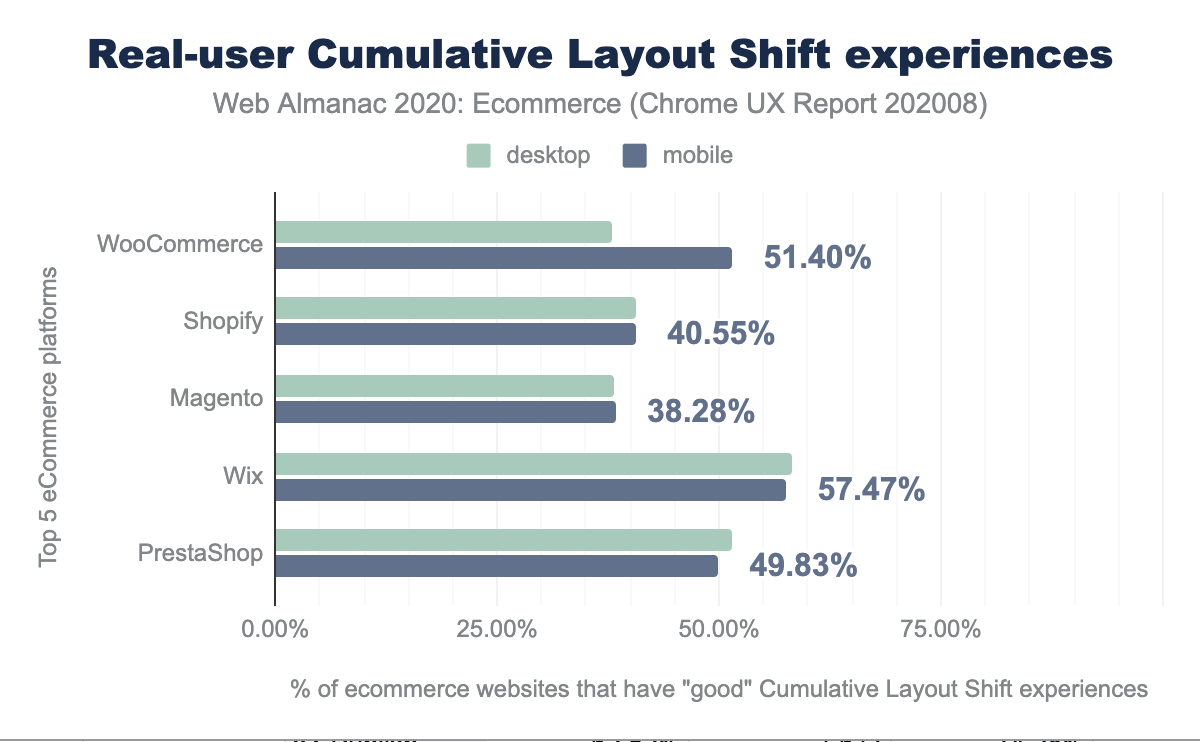
About half ecommerce sites have good CLS scores and interestingly there is little difference between mobile and desktop, despite the usual convention that mobile devices are usually under powered and often experience variable network changes.
Core Web Vitals overall
Looking at Core Web Vitals overall, for which sites pass all three core metrics we see the following:
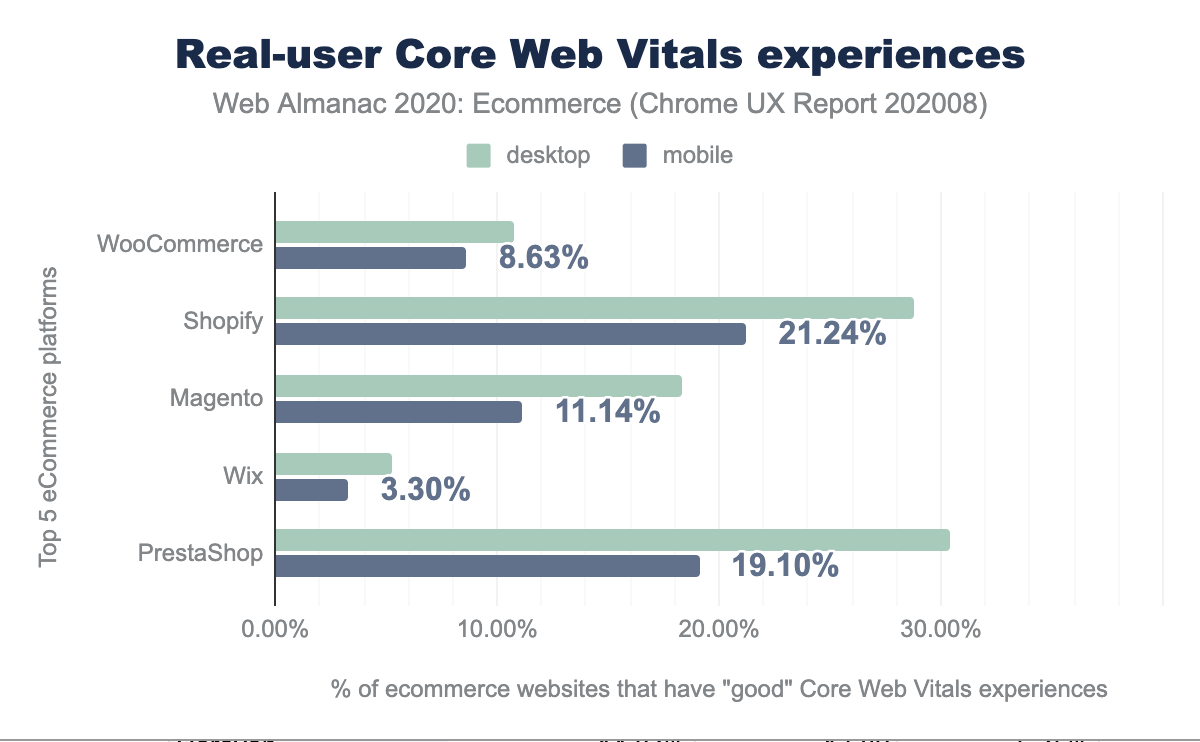
This is very similar to the LCP chart earlier, perhaps somewhat unsurprisingly since it was the one with the most variability and the most sites that failed this metric.
Tools
How are ecommerce sites using common tools like Analytics, Tag Managers, Consent Management Platforms and Accessibility solutions?
Analytics
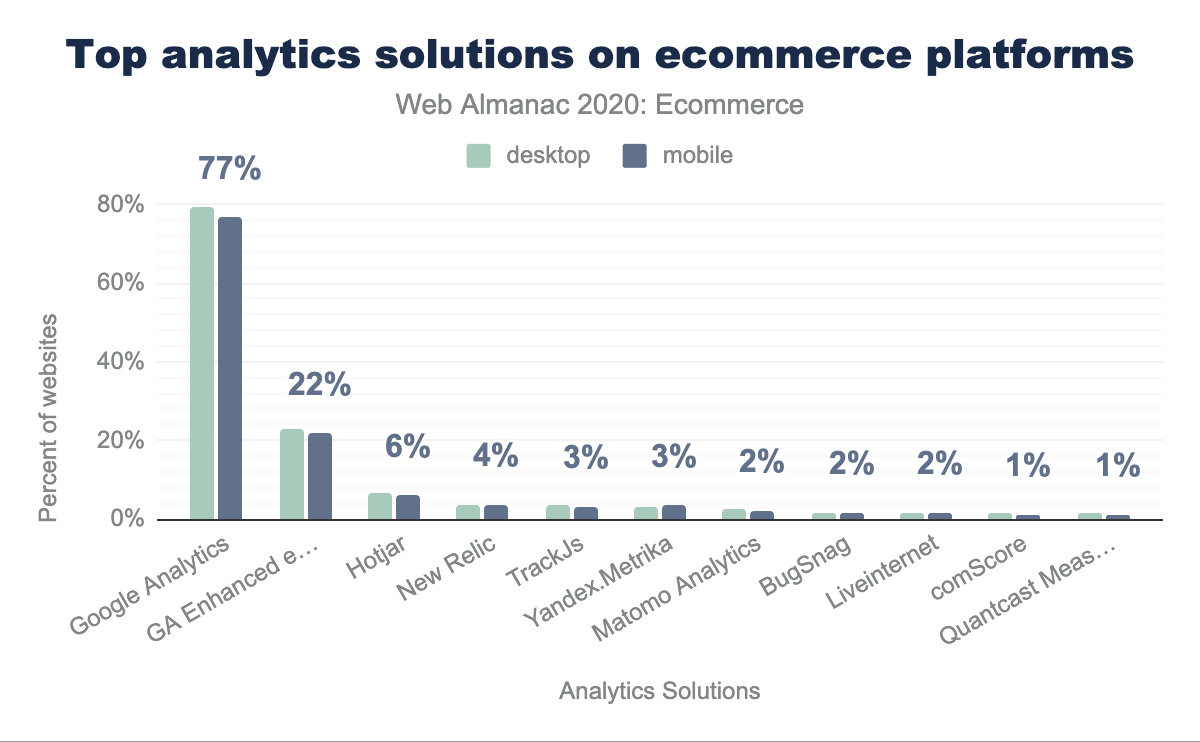
Google Analytics scores highly unsurprisingly at 77% of mobile ecommerce sites, but what is perhaps more surprising is that Google Analytics Enhanced Ecommerce is only used by 22% of ecommerce sites, reflecting either an opportunity for 55% of sites to get more out of their Google Analytics, or perhaps reflecting another limitation of our methodology which is limited to home pages as some sites may only load this on checkout funnels.
HotJar is another tool often used by ecommerce sites to analyze and improve usage of the site, and so conversions but usage is very low at 6% of mobile sites.
Tag Managers
Google Tag Manager remains the most used tag manager on ecommerce sites followed by Adobe Tag Manager. We don’t expect this to change due to free nature of Google Tag Manager. In August 2020, Google also launched server side tagging in Google Tag Manager. Implementing server-side tagging will incur a small cost for ecommerce sites but it can help sites eliminate third-party overhead and thus improving metrics like Total Blocking Time (TBT), First Input Delay (FID) and Time to Interactive (TTI). Simon Ahava has lot of useful information on his blog which we recommend to readers.
Adoption of server-side tagging will depend on third parties to provide server side templates to make the migration easier. These are early days for GTM server-side tagging and at the time of writing this chapter, we didn’t find any server-side templates in publicly available community gallery. But if the adoption increases, it will be interesting to compare the performance scores of sites using client-side vs server-side tagging. Other vendors like Adobe, Signal also offer similar server-side solutions which sites should consider adopting to help with performance.
| Tag Manager | Desktop | Mobile |
|---|---|---|
| Google Tag Manager | 48.45% | 46.56% |
| Adobe DTM | 0.41% | 0.38% |
| Ensighten | 0.13% | 0.13% |
| TagCommander | 0.08% | 0.07% |
| Signal | 0.05% | 0.03% |
| Matomo Tag Manager | 0.02% | 0.02% |
| Yahoo! Tag Manager | 0.00% | 0.00% |
| Total | 49.14% | 47.20% |
Consent Management Platforms
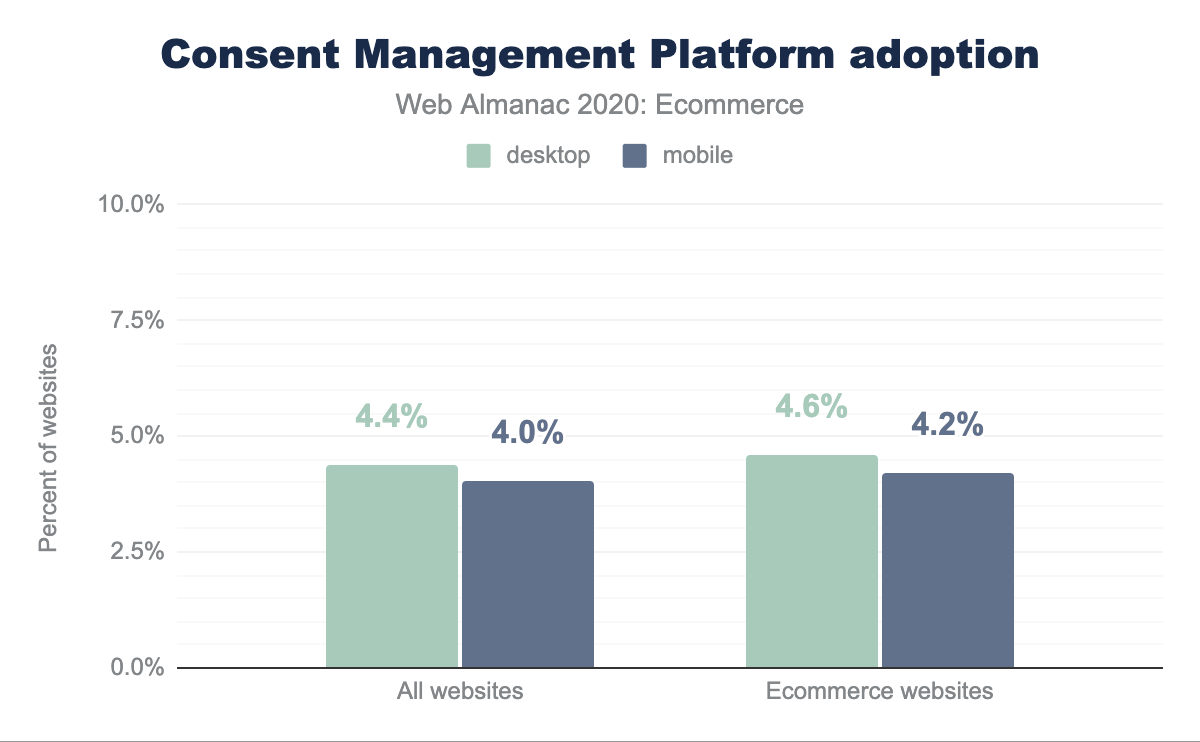
This year’s Privacy chapter covered the adoption of Consent Management Platforms across all types of websites. When we compare adoption on ecommerce sites versus all sites, we see a slightly higher adoption both across mobile (4.2% on ecommerce sites Vs 4.0% on all sites) and desktop (4.6% on ecommerce sites Vs 4.4% on all sites).
In terms of share of various CMPs, the trend for ecommerce websites was similar as all websites covered in Privacy chapter. In future editions of the Web Almanac, we expect this adoption to increase as more and more countries come up with their own regulations. Also, “Content Management Platform” was recently added to Wappalyzer by the Web Almanac team. Though the team added most popular CMPs, with time we expect additional CMPs to be added and hence expected increase in adoption stats.
Accessibility solutions
In this year’s Accessibility Chapter introduction, the Web Almanac team talks about dangers of implementing quick fix accessibility solutions and points to Lainey Feingold’s brilliant article, Honor the ADA: Avoid Web Accessibility Quick Fix Overlays.
Though not recommended, we looked at usage of such solutions across ecommerce websites and found that 0.47% of mobile websites and 0.54% of desktop websites have deployed such solutions.
In the current methodology adopted for this chapter, there is no easy way for us to look at if any top ecommerce websites have gone this quick fix route instead of trying to achieve accessibility by design. It will be possible to find out this in future by combining HTTP Archive data with publications like Top 500 UK sites by International retailing or similar publications.
AMP adoption
In the SEO chapter we covered stats on AMP usage across all websites. In this chapter, we look at AMP adoption on ecommerce websites. AMP adoption remains low across ecommerce websites (0.61% on mobile and 0.66% on desktop) as AMP still doesn’t support all ecommerce use cases. Also, in this analysis, we rely on detection using Wappalyzer and this may result in double counting of ecommerce sites where AMP is implemented as a different domain using <link rel="amphtml"...> element. This shouldn’t be an issue while looking at percentages as such domains are also counted twice while coming up with total ecommerce websites.
We also considered looking at CRUX performance of ecommerce websites with their AMP counterpart (where implemented on a different domain using amphtml attribute). Such an analysis will help us identify if there was a significant difference in performance of AMP domain, but due to low adoption rates of AMP across ecommerce websites, such an analysis may not give any meaningful results and we deferred the analysis for future years (if adoption rates increase).
Web Push notifications
Marketeers love push notifications but as per author’s experience that awareness among marketeers about web push notifications is still very low in spite of Push API being introduced in 2015 for the first time in Chrome. We tried to look at adoption of web push notifications (which are possible using technologies like service workers) on ecommerce sites. As part of CRUX notifications permission data, we have access to metrics like push acceptance rates, push prompts dismissal rates. Please refer this Google article for more details on how this data is captured and what metrics are available.
In our analysis, we found that only 0.68% of desktop ecommerce sites and 0.69% of mobile ecommerce sites use web push notifications. When it comes to push notifications, it’s important that customers find push notifications useful. Key to this is to request permission at right time in customer journey and not to bombard users with irrelevant notifications. To address the customer fatigue with push notifications, Chrome will automatically enroll sites with very low acceptance rates into quieter notifications UI (though exact threshold is not yet defined). Standard UI will be restored for the site when acceptance rates improve within the control group.
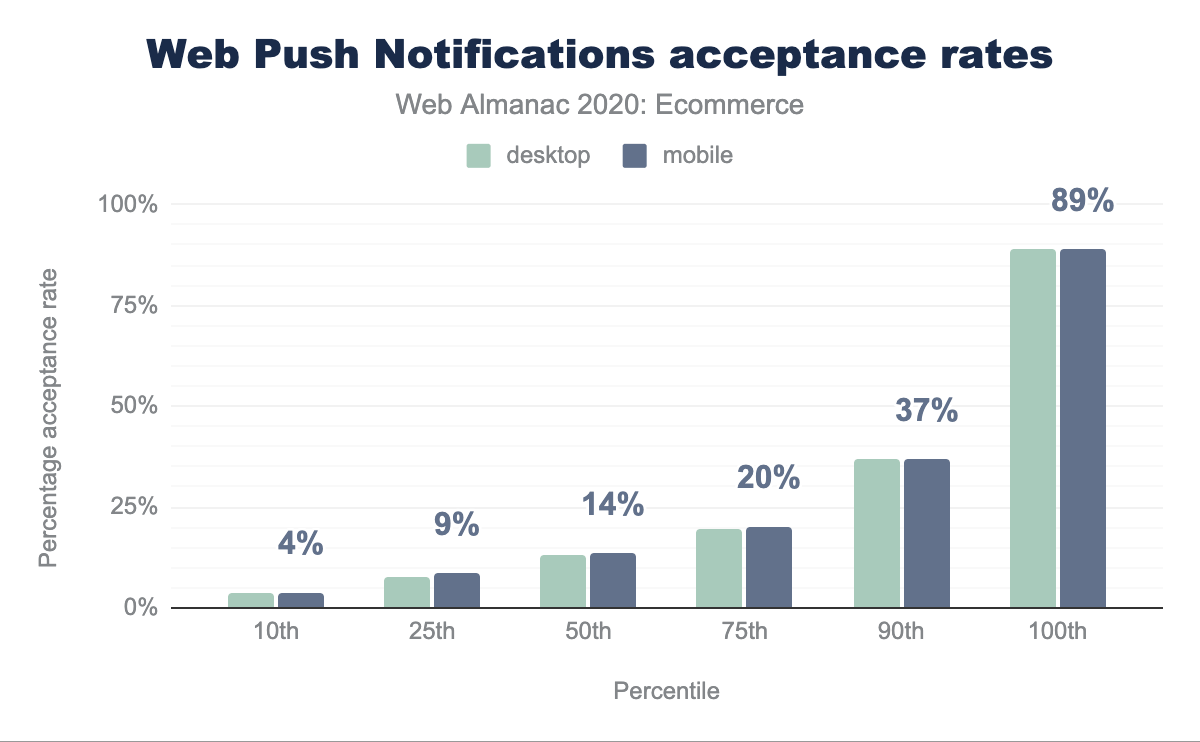
PJ Mclachlan (Product Manager, Google) has talked about aiming for at least 50% acceptance rates to be in safe territory to avoid falling into quieter notifications UI and aiming for 80% and above acceptance rate. The median notifications acceptance rates for an ecommerce website is 13.6% on mobile and 13.2% on desktop. At median level, these acceptance rates have a lot to be desired. Even at 90th percentile level, numbers don’t look very good (36.9% for mobile and 36.8% for desktop). Ecommerce sites can refer to this talk for recommended patterns to make sure push acceptance rates remain healthy and they are not getting caught off guard by upcoming abusive notifications changes.
Future analysis opportunities
It will also be interesting to look at adoption of native apps by ecommerce sites by tapping into native app association standards like .well-known/assetlinks.json on play store and .well-known/apple-app-site-association on app store. Google has made easy for PWAs to achieve this using Trusted Web Activity but currently there are no public stats available on how many sites may be using this technique to submit their PWAs in play store.
This year’s SEO chapter includes analysis of websites using hreflang and lang attributes, and content-language HTTP header. This combined with Wappalyzer detection of cross-border commerce solutions like Global-e, Flow, Borderfree can provide opportunity to just look at Cross border commerce aspects of the ecommerce websites. Currently Wappalyzer doesn’t have a separate category for ’Cross-border commerce’ and hence this type of analysis is not possible unless we build a repository of such solutions ourselves.
Wappalyzer also provides detection of payment solutions (Apple Pay / PayPal / ShopPay etc.) but based on the types of implementation and solution, it’s not always possible to detect this just by looking at home page but for solutions where detection can be done by just looking at home page, such an analysis can be useful to look at year of year trends.
Conclusion
Covid-19 massively accelerated the growth of ecommerce in 2020 and lot of smaller players had to establish online presence quickly and had to find ways to continue trading during lockdowns. Platforms like WooCommerce/Shopify/Wix/BigCommerce played very important role in bringing more and more small businesses online. Covid-19 also saw launch of D2C (direct to consumer) offerings by brand and this is expected to increase in future. Full impact of Covid-19 may not be visible in this year’s Web Almanac as these new businesses need to cross certain traffic threshold first in order to become part of CRUX dataset which we use for our analysis. Due to this reason, we may see continued growth in next year’s analysis as well.
Improving core web vitals score will be a priority for ecommerce businesses due to changes announced by Google and marketing teams using Web Push Notifications should keep an eye on their notifications stats using CRUX to not get caught by upcoming abusing notifications changes. Tag Managers still seem to cause a lot of friction between marketing and engineering teams and solutions like Google Tag Manager server side tagging will make some inroads but we don’t expect a lot to change in 2021 and this will be more like 3-5 years journey but community need to ask their respective third parties to provide compatible solutions to further evolve this ecosystem.
While remembering the limitation that we are looking only home page data for this analysis, we would like to hear from community what else we should cover in next year’s analysis. We have covered some possibilities of further analysis in section above and any feedback is greatly appreciated.

