Compression
Introduction
Using HTTP compression makes a website load faster and therefore guarantees a better user experience. Running no compression on HTTP makes for a worse user experience, may affect the growth rate of the related web service, and affects search rankings. Effective use of compression can reduce page weight, improves web performance, and therefore is an important part of search engine optimization.
While lossy compression is often acceptable for images and other media types, for text we want to use lossless compression, i.e. recover the exact text after decompression.
What type of content should we compress?
For most text-based assets, such as HTML, CSS, JavaScript, JSON, or SVG, as well as certain non-text formats such as woff, ttf, ico, using compression is recommended.
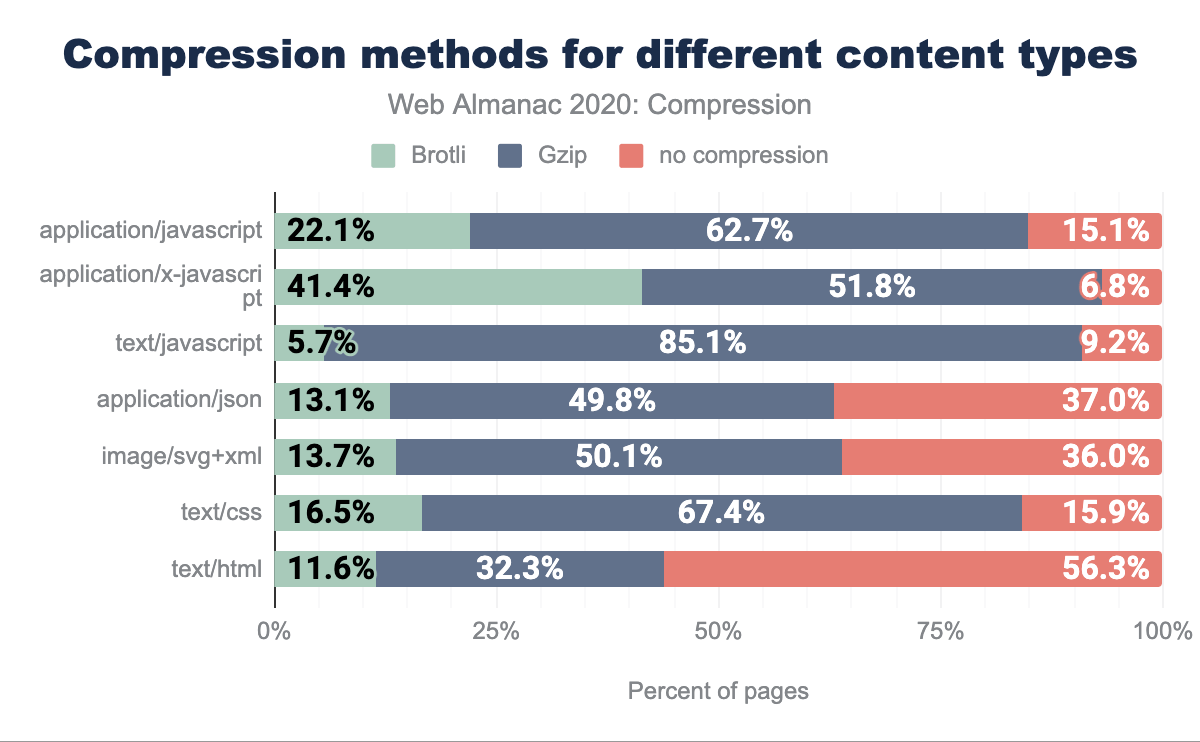
text/html is the only content type that is compressed less than 50% of the time. application/json and image/svg+xml are each approximately 64% compressed. text/css and application/javascript are each approximately 85% compressed. application/x-javascript and text/javascript are greater than 90% compressed.The figure shows the percent of responses of a certain content type using either Brotli, Gzip or no text compression. It is surprising that while all those content types would profit from compression, the range of percentages varies widely over the different content types: only 44% use compression for text/html against 93% for application/x-javascript.
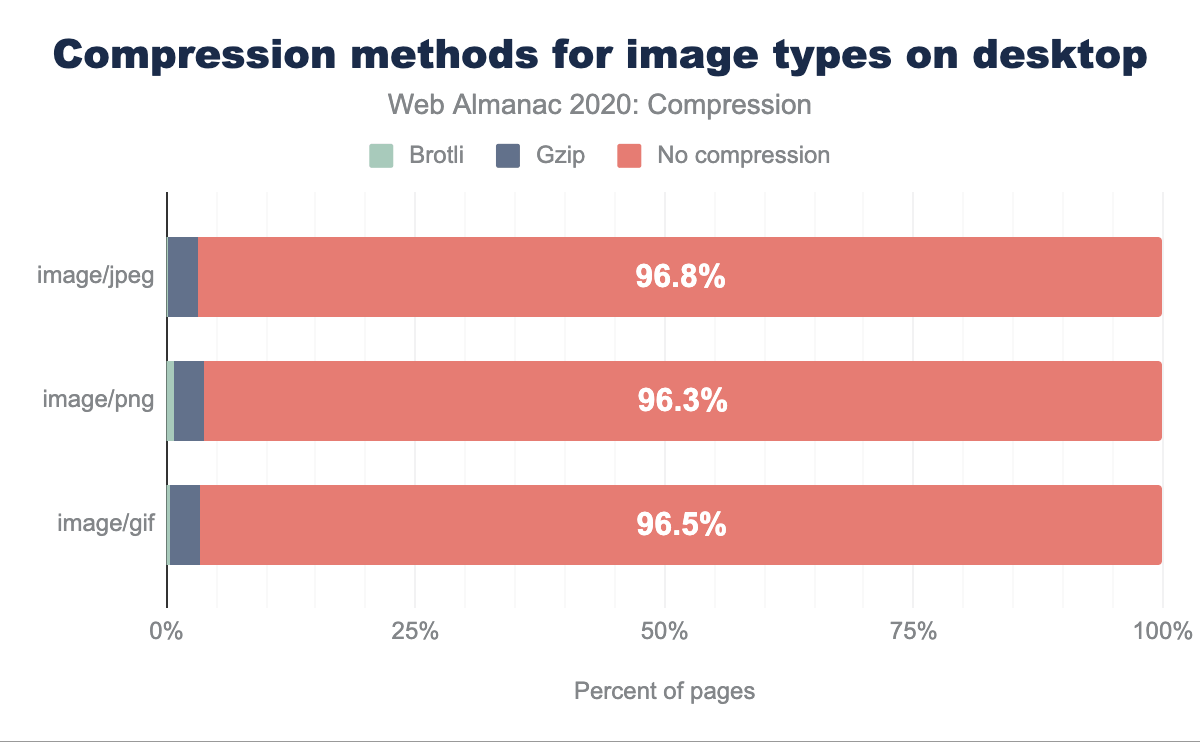
For image-based assets text-based compression is less useful and not widely employed. The data shows that the percent of image responses that employ either Brotli, or Gzip is very low, less than 4%. For more info on non text-based assets, check out the Media chapter.
How to use HTTP compression?
To reduce the size of the files that we plan to serve one could first use some minimizers, e.g. HTMLMinifier, CSSNano, or UglifyJS. However bigger gains are expected from using compression.
There are two ways of doing the compression on the server side:
- Precompressed (compress and save assets ahead of time)
- Dynamically Compressed (compress assets on-the-fly after a request is made)
Since precompression is done beforehand, we can spend more time compressing the assets. For dynamically compressed resources, we need to choose the compression levels such that compression takes less time than the time difference between sending an uncompressed versus a compressed file. This difference is borne out when looking at compression level recommendations for both methods.
| Brotli | Gzip | |
|---|---|---|
| Precompressed | 11 | 9 or Zopfli |
| Dynamically compressed | 5 | 6 |
Currently, practically all text compression is done by one of two HTTP content encodings: Gzip and Brotli. Both are widely supported by browsers: can I use Brotli/can I use Gzip
When you want to use Gzip, consider using Zopfli, which generates smaller Gzip compatible files. This should be done especially for precompressed resources, since here the greatest gains are expected. See this comparison between Gzip and Zopfli that takes into account different compression levels for Gzip.
Many popular servers support dynamically and/or pre-compressed HTTP and many of them support Brotli.
Current state of HTTP compression
Approximately 60% of HTTP responses are delivered with no text-based compression. This may seem like a surprising statistic, but keep in mind that it is based on all HTTP responses in the dataset. Some content, such as images, will not benefit from these compression algorithms and is therefore not often used, as shown in figure 19.2.
| Content Encoding | Desktop | Mobile | Combined |
|---|---|---|---|
| No text compression | 60.06% | 59.31% | 59.67% |
| Gzip | 30.82% | 31.56% | 31.21% |
| Brotli | 9.10% | 9.11% | 9.11% |
| Other | 0.02% | 0.02% | 0.02% |
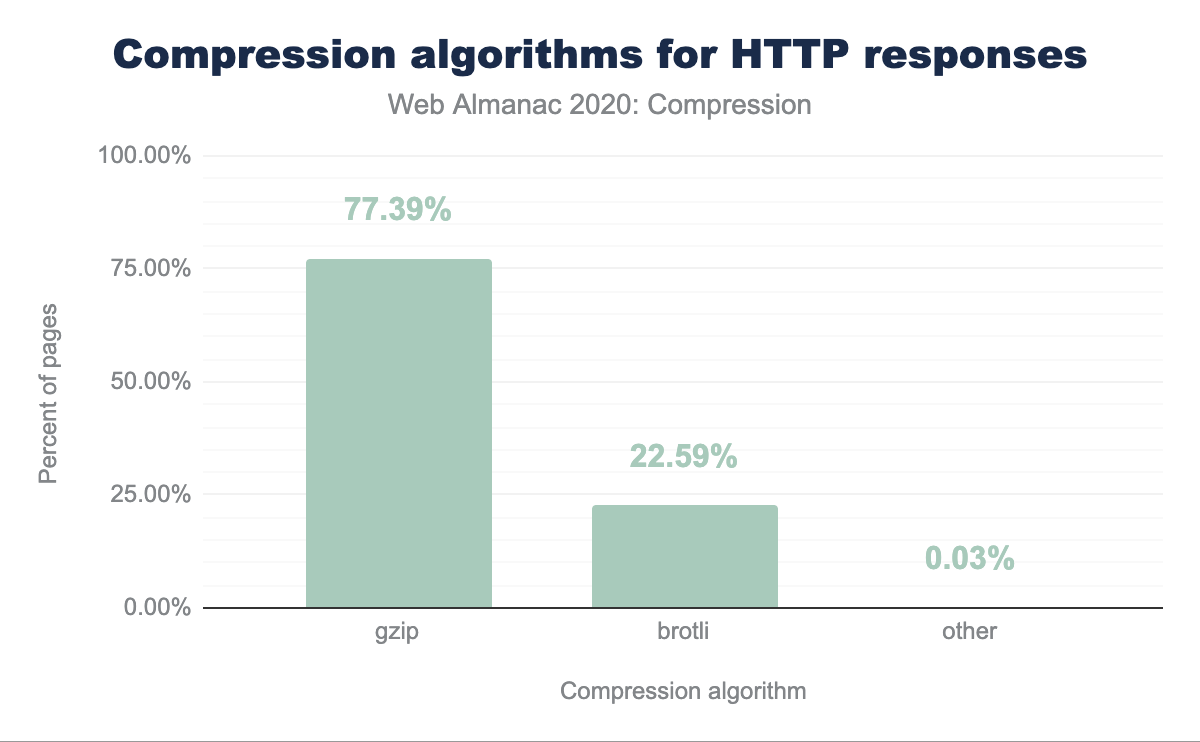
Of the resources that are served compressed, the majority are using either Gzip (77%) or Brotli (23%). The other compression algorithms are used infrequently.
In the graph below, the top 11 content types are displayed with box sizes representing the relative number of responses. The color of each box represents how many of these resources were served compressed, orange indicates a low percentage of compression while blue indicates a high percentage of compression. Most of the media content is shaded orange, which is expected since Gzip and Brotli would have little to no benefit for them. Most of the text content is shaded blue to indicate that they are being compressed. However, the light blue shading for some content types indicate that they are not compressed as consistently as the others.
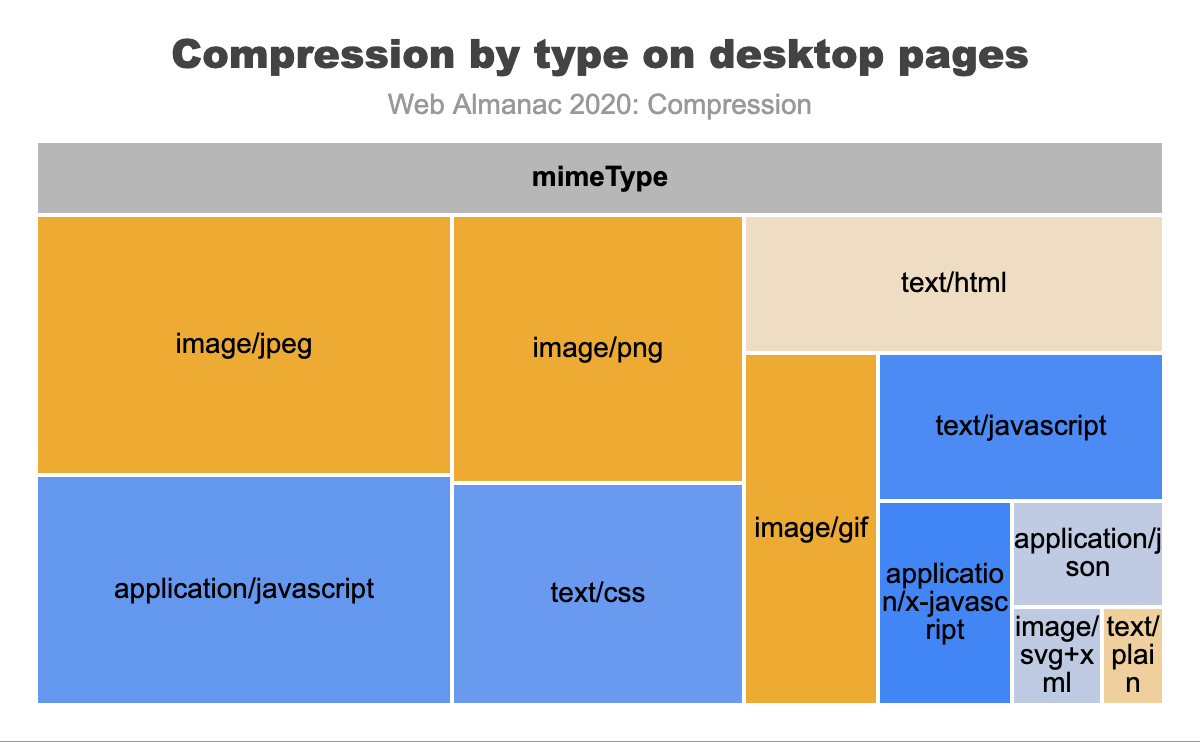
Figure 19.1 above breaks down the percentage of compression used per content type, in figure 19.6 this percentage is indicated as color. The two figures tell similar stories, non-text based assets are rarely compressed, while text-based assets are often compressed. The rates of compression are also similar for both mobile and desktop.
First-party vs third-party compression
In the Third Parties chapter, we learn about third parties and their impact on performance. Using third parties can also have an impact on compression.
| Desktop | Mobile | |||
|---|---|---|---|---|
| Content Encoding | First-Party | Third-Party | First-Party | Third-Party |
| No Text Compression | 61.93% | 57.81% | 60.36% | 58.11% |
| Gzip | 30.95% | 30.66% | 32.36% | 30.65% |
| br | 7.09% | 11.51% | 7.26% | 11.22% |
| deflate | 0.02% | 0.01% | 0.02% | 0.01% |
| Other / Invalid | 0.01% | 0.01% | 0.01% | 0.01% |
When we compare compression techniques between first and third parties, we can see that third-party content tends to be compressed more than first-party content. Additionally, the percentage of Brotli compression is higher for third-party content. This is likely due to the number of resources served from the larger third parties that typically support Brotli, such as Google and Facebook.
Compared with last year’s results, we can see that there was a significant increase in the use of compression, notably Brotli for first parties, almost to the point that the use of compression is around 40% for both first and third party, and for desktop and mobile. However within the responses that do use compression, for first parties, the ratio of Brotli compression is only 18%, while the ratio for third parties is 27%.
How to analyze compression on your sites
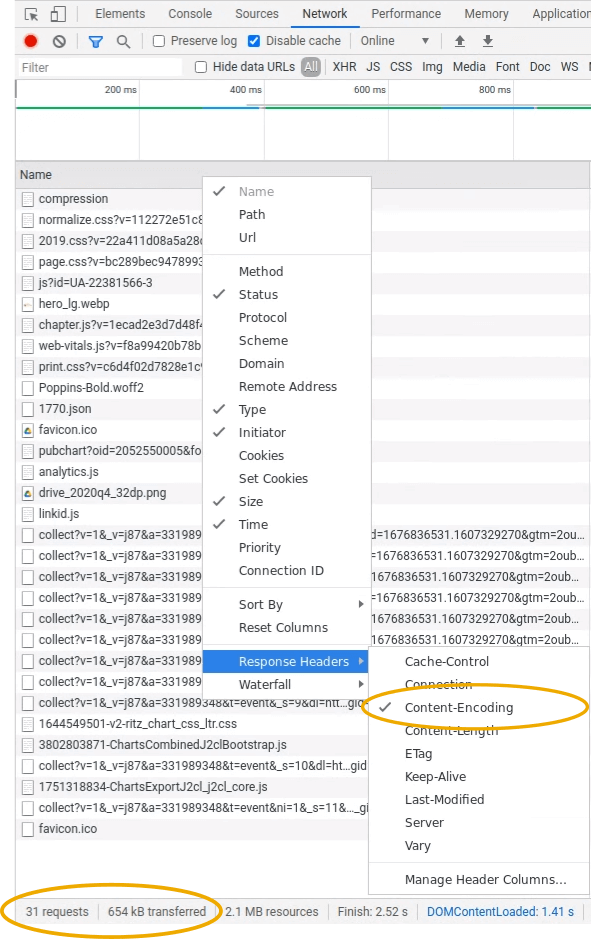
You can use Firefox Developer Tools or Chrome DevTools to quickly figure out what content a website already compresses. To do this, go to the Network tab, right click and activate “Content Encoding” under Response Headers. Hovering over the size of individual files you will see “transferred over network” and “resource size”. Aggregated for the entire site one can see size/transferred size for Firefox and “transferred” and “resources” for Chrome on the bottom left hand side of the Network tab.
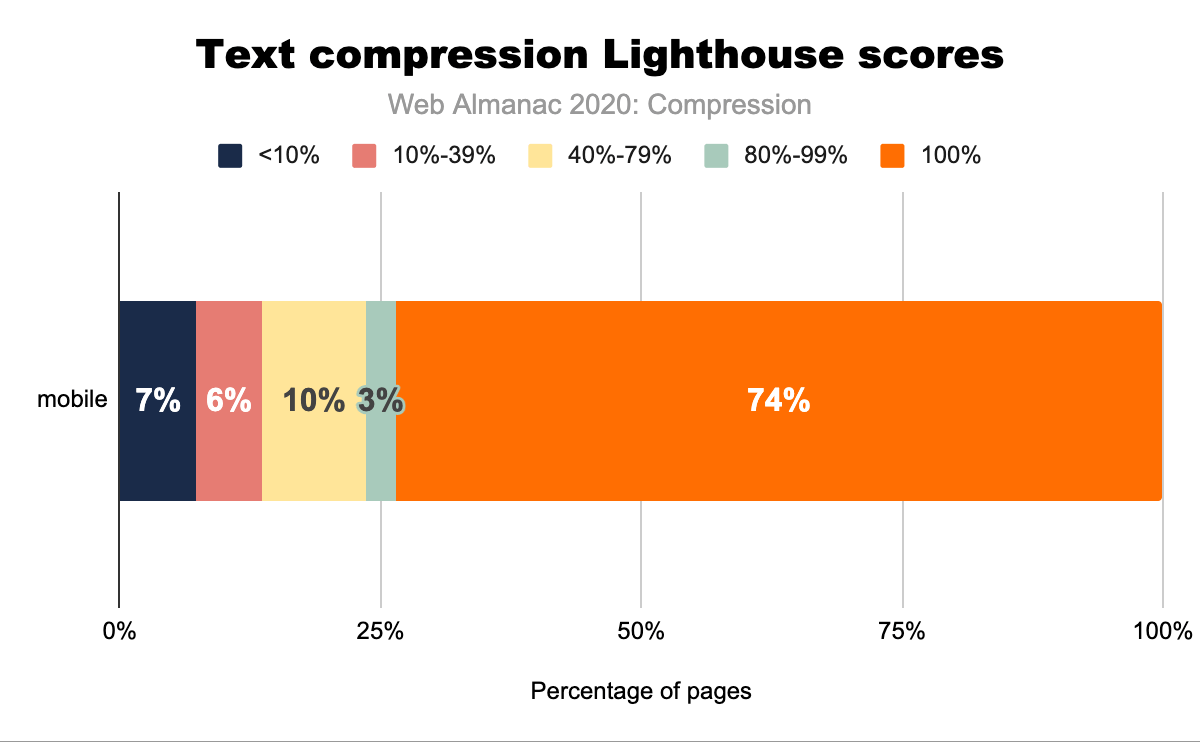
Another tool to better understand compression on your site is Google’s Lighthouse tool, which enables you to run a series of audits against web pages. The text compression audit evaluates whether a site can benefit from additional text-based compression. It does this by attempting to compress resources and evaluate whether an object’s size can be reduced by at least 10% and 1,400 bytes. Depending on the score, you may see a compression recommendation in the results, with a list of specific resources that could be compressed.
Because the HTTP Archive runs Lighthouse audits for each mobile page, we can aggregate the scores across all sites to learn how much opportunity there is to compress more content. Overall, 74% of websites are passing this audit, while almost 13% of websites have scored below a 40. This is a 11.5% improvement when compared to last year’s 62.5% of passing scores.
Conclusion
Compared with last year’s Almanac, there is a clear trend towards using more text compression. The number of responses that don’t use any text compression went down a little more than 2%, while at the same time the use of Brotli has increased by almost 2%. The Lighthouse scores have improved significantly.
Text compression is widely used for the relevant formats, although there is still a significant percentage of HTTP responses that could benefit from additional compression. You can profit from taking a close look at the configuration of your server and set compression methods and levels to your need. A great impact for a more positive user experience could be made by carefully choosing defaults for the most popular HTTP servers.


