JavaScript
Introduction
JavaScript is a powerful force that provides the lion’s share of interactivity on the web. It drives behaviors from the simple to the complex, and is making more things possible on the web than ever before.
Yet, the increased usage of JavaScript to deliver rich user experiences comes at a cost. From the moment JavaScript is downloaded, parsed, and compiled, to every line of code it executes, the browser must orchestrate all kinds of work to make everything possible. Doing too little with JavaScript means you might fall short of fulfilling user experience and business goals. On the other hand, shipping too much on JavaScript means you will be creating user experiences that are slow to load, sluggish to respond, and frustrating to users.
This year, we’ll once again be looking at the role of JavaScript on the web, as we present our findings for 2022 and offering advice for creating delightful user experiences.
How much JavaScript do we load?
To begin, we’ll assess the amount of JavaScript web developers ship on the web. After all, before improvements can be made, an assessment of the current landscape must be performed.
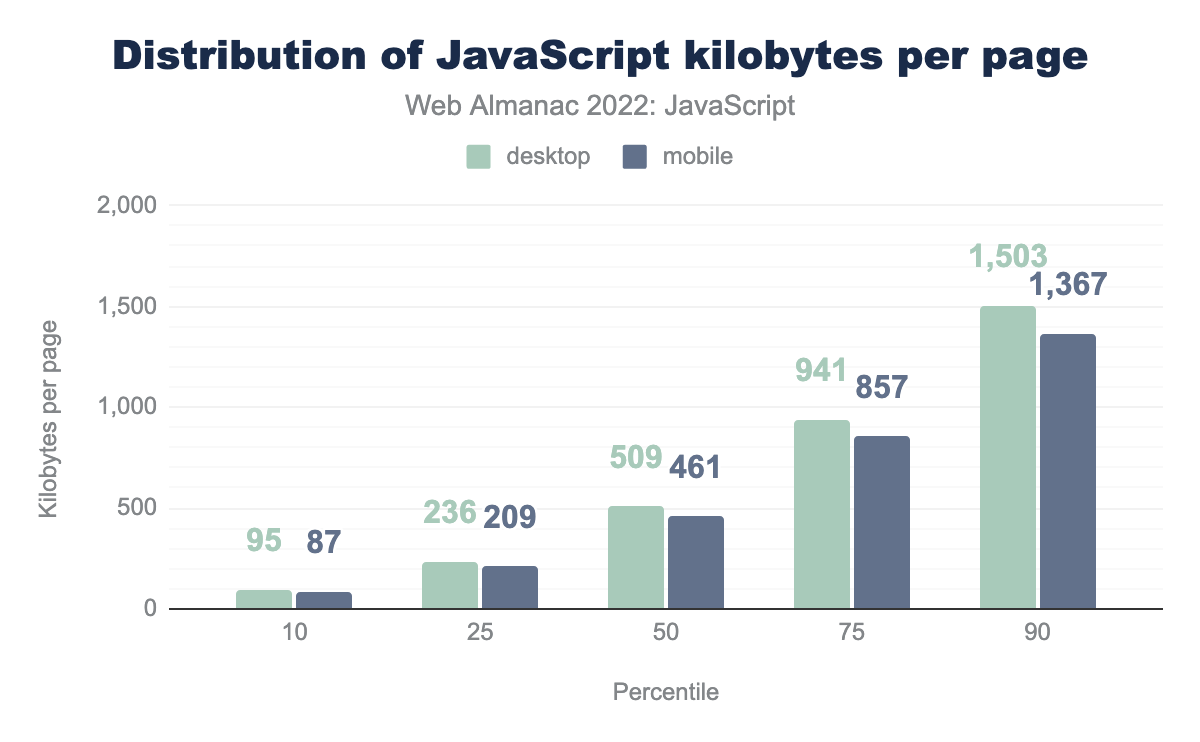
As was the case last year, this year marks yet another increase in the amount of JavaScript shipped to browsers. From 2021 to 2022, an increase of 8% for mobile devices was observed, whereas desktop devices saw an increase of 10%. While this increase is less steep than in previous years, it’s nonetheless the continuation of a concerning trend. While device capabilities continue to improve, not every one is running the latest device. The fact remains that more JavaScript equates to more strain on a device’s resources.
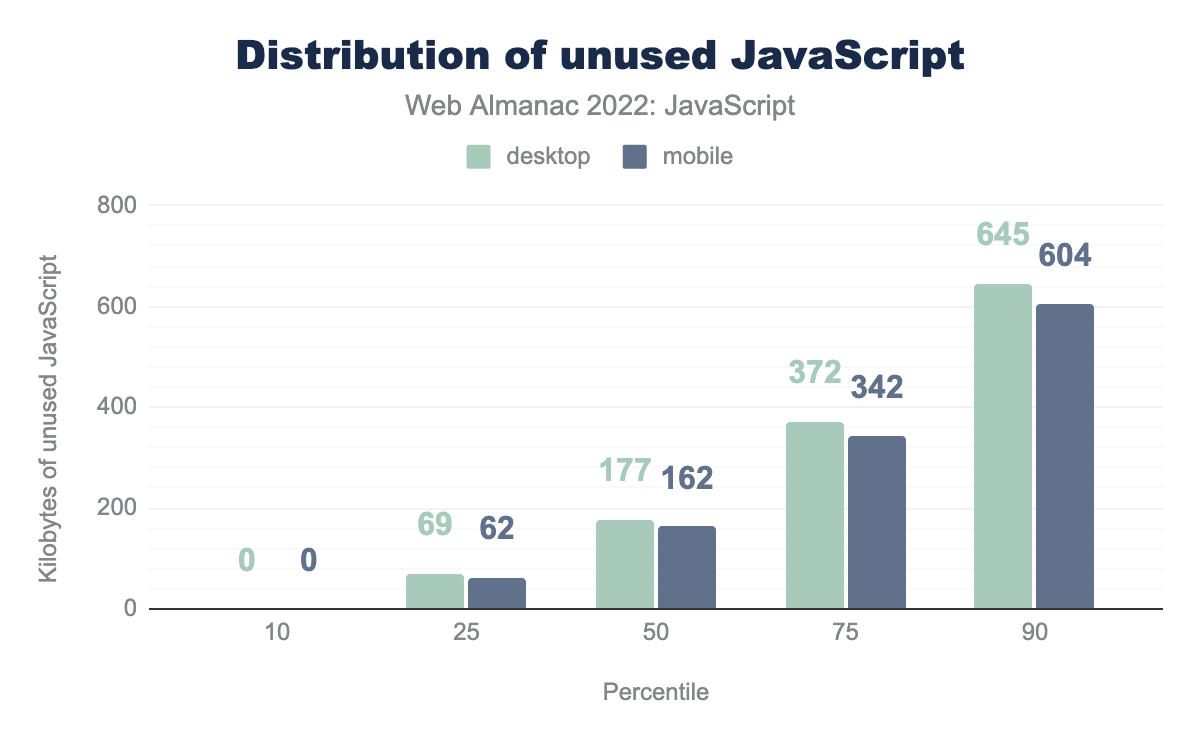
According to Lighthouse, the median mobile page loads 162 KB of unused JavaScript. At the 90th percentile, 604 KB of JavaScript are unused. This is a slight uptick from last year, where the median and 90th percentile of unused JavaScript was 155 KB and 598 KB, respectively. All of this represents a very large amount of unused JavaScript, especially when you consider that this analysis tracks the transfer size of JavaScript resources which, if compressed, means that the decompressed portion of used JavaScript may be a lot larger than the chart suggests.
When contrasted with the total number of bytes loaded for mobile pages at the median, unused JavaScript accounts for 35% of all loaded scripts. This is down slightly from last year’s figure of 36%, but is still a significantly large chunk of bytes loaded that go unused. This suggests that many pages are loading scripts that may not be used on the current page, or are triggered by interactions later on in the page lifecycle, and may benefit from dynamic import() to reduce startup costs.
JavaScript requests per page
Every resource on a page will kick off at least one request, and possibly more if a resource makes additional requests for more resources.
Where script requests are concerned, the more there are, the more likely you’ll not just load more JavaScript, but also increase contention between script resources that may bog down the main thread, leading to slower startup.
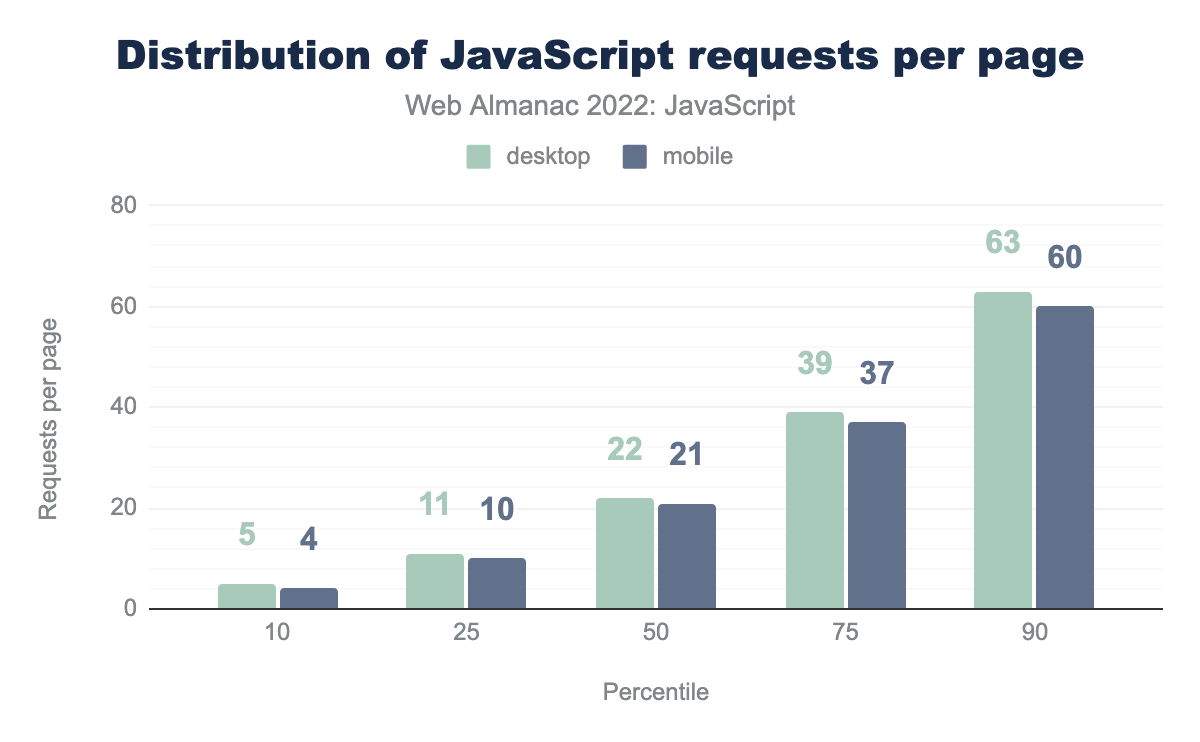
In 2022, the median mobile page responded to 21 JavaScript requests, whereas at the 90th percentile, there were 60. Compared to last year, this is an increase of 1 request at the median and 4 requests at the 90th percentile.
Where desktop devices in 2022 are concerned, there are 22 JavaScript requests at the median, and 63 at the 90th percentile. Compared to last year, this is an increase of 1 JavaScript request at the median, and 4 at the 90th percentile—the same increase as noted for mobile devices.
While not a large increase in the number of requests, it does continue the trend of increased requests year over year since the Web Almanac’s inception in 2019.
How is JavaScript processed?
Since the advent of JavaScript runtimes such as Node.js, it has become increasingly common to rely on build tools in order to bundle and transform JavaScript. These tools, while undeniably useful, can have effects on how much JavaScript is shipped. New to the Web Almanac this year, we’re presenting data on the usage of bundlers and transpilers.
Bundlers
JavaScript bundlers are build-time tools that process a project’s JavaScript source code and then apply transformations and optimizations to it. The output is production-ready JavaScript. Take the following code as an example:
function sum (a, b) {
  return a + b;
}
A bundler will transform this code to a smaller, but more optimized equivalent that takes less time for the browser to download:
function n(n,r){return n+r}Given the optimizations bundlers perform, they are a crucial part of optimizing source code for better performance in production environments.
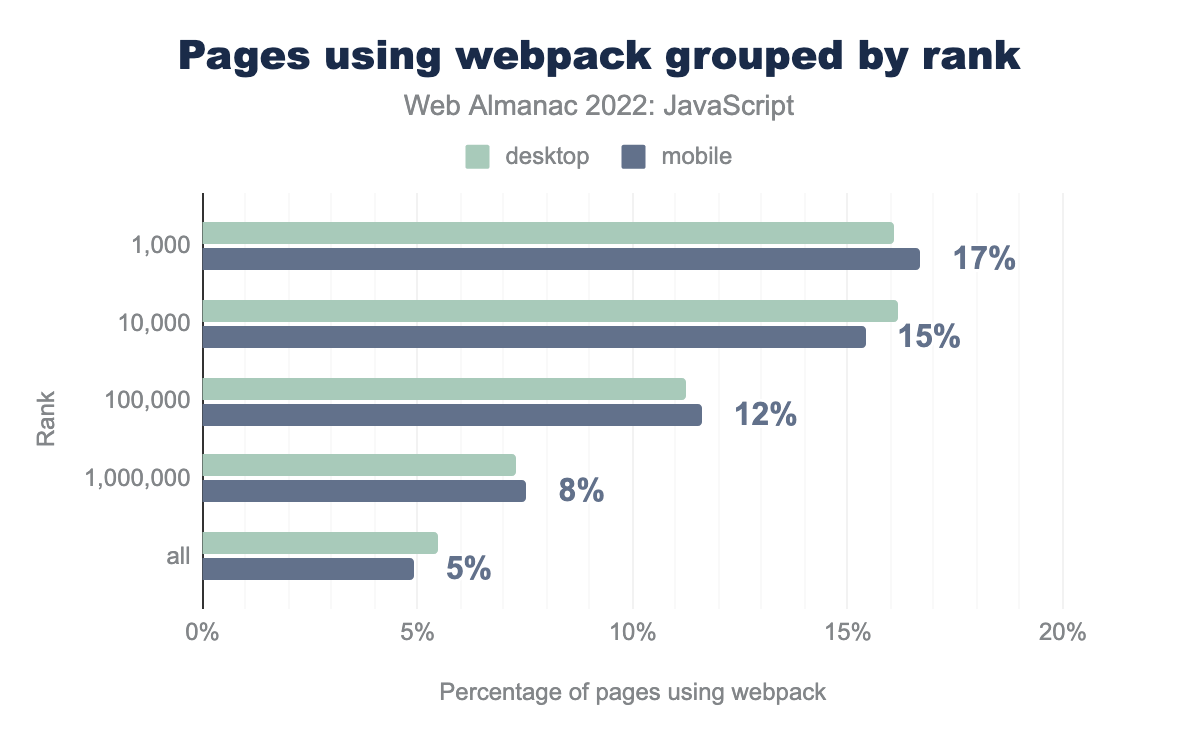
There are a wealth of choices when it comes to JavaScript bundlers, but one that pops into mind often is webpack. Fortunately, webpack’s generated JavaScript contains a number of signatures (webpackJsonp, for example) that make it possible to detect if a website’s production JavaScript has been bundled using webpack.
Of the 1,000 most popular websites, 17% use webpack as a bundler. This makes sense, as many of the top pages HTTP Archive crawls are likely to be high-profile ecommerce sites that use webpack to bundle and optimize source code. Even so, the fact that 5% of the all pages in the HTTP Archive dataset use webpack is a significant statistic. However, webpack isn’t the only bundler in use.
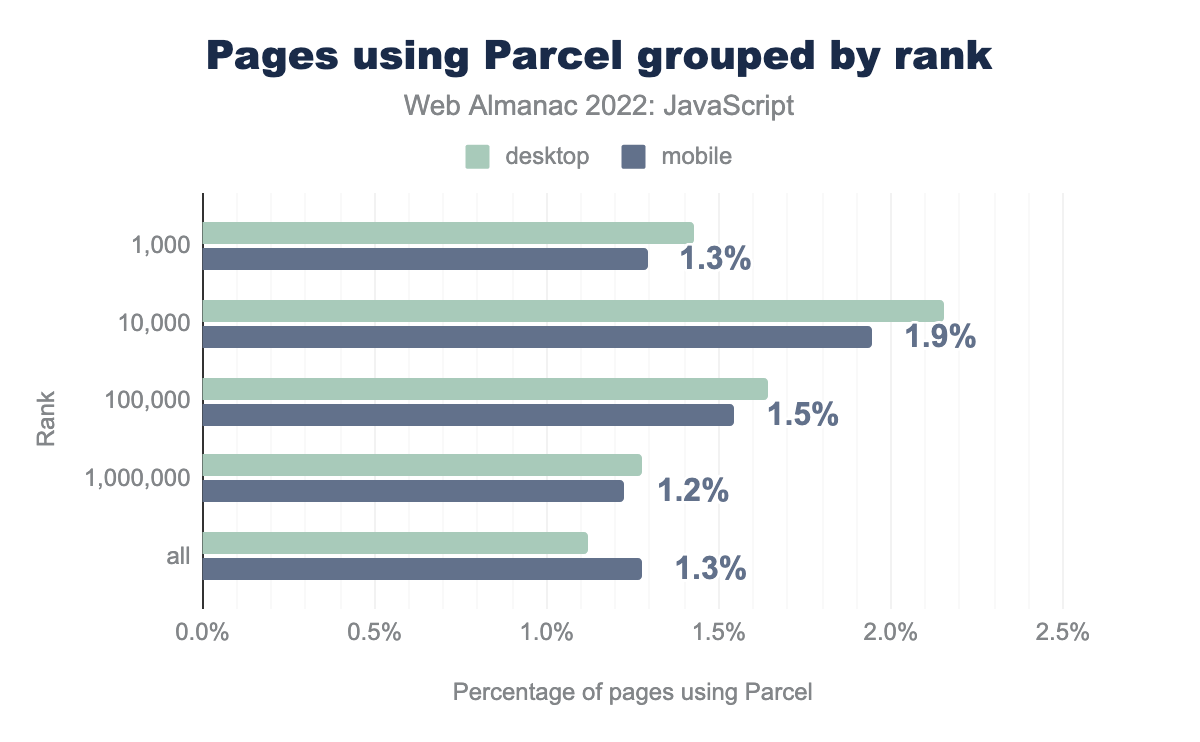
Parcel is a noteworthy alternative to webpack, and its adoption is significant. Parcel’s adoption is consistent across all ranks, accounting for a range of 1.2% to 1.9% across rankings.
While HTTP Archive is unable to track the usage of all bundlers in the ecosystem, bundler usage is significant in the overall picture of JavaScript in that they’re not only important to the developer experience, but the overhead they can contribute in the form of dependency management code can be a factor in how much JavaScript is shipped. It’s worth checking how your overall project settings are configured to produce the most efficient possible output for the browsers your users use.
Transpilers
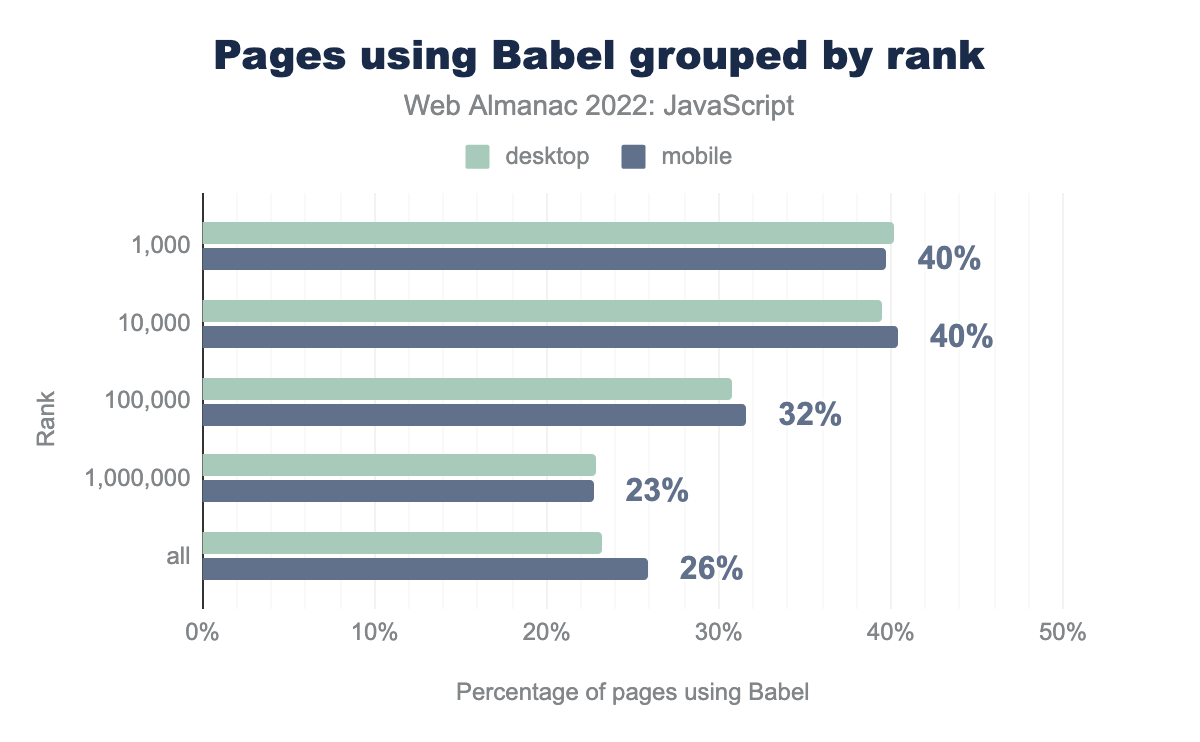
Transpilers are often used in toolchains at build-time to transform newer JavaScript features into a syntax that can be run in older browsers. Because JavaScript has evolved rapidly over the years, these tools are still in use. New to this year’s Web Almanac is an analysis of the usage of Babel in delivering widely compatible, production-ready JavaScript. The singular focus on Babel specifically is due to its wide usage in the developer community over alternatives.
These results are not a surprising development when you consider how much JavaScript has evolved over the years. In order to maintain broad compatibility for a certain set of browsers, Babel uses transforms to output compatible JavaScript code.
Transforms are often larger than their untransformed counterparts. When transforms are extensive or duplicated across a codebase, potentially unnecessary or even unused JavaScript may be shipped to users. This can adversely affect performance.
Considering that even 26% of pages ranked in the top million are transforming their JavaScript source code using Babel, it’s not unreasonable to assume that some of these experiences may be shipping transforms they don’t need. If you use Babel in your projects, carefully review Babel’s available configuration options and plugins to find opportunities to optimize its output.
Since Babel also relies on Browserslist to figure out whether it needs to transform certain features to a legacy syntax, be sure to also review your Browerslist configuration to ensure that your code is transformed to work in the browsers your users actually use.
How is JavaScript requested?
The manner in which JavaScript is requested may also have performance implications. There are optimal ways you can request JavaScript, and in some cases, there are far less optimal methods. Here, we’ll see how the web is shipping JavaScript overall, and how that aligns with performance expectations.
async, defer, module, and nomodule
The async and defer attributes on the HTML <script> element control the behavior of how scripts load. The async attribute will prevent scripts from blocking parsing, but will execute as soon as they are downloaded, so may still block rendering. The defer attribute will delay execution of scripts until the DOM is ready so should prevent those scripts from blocking both parsing and rendering.
The type="module" and nomodule attributes are specific to the presence (or absence) of ES6 modules being shipped to the browser. When type="module" is used, the browser expects that the content of those scripts will contain ES6 modules, and will defer the execution of those scripts until the DOM is constructed by default. The opposite nomodule attribute indicates to the browser that the current script does not use ES6 modules.
| Feature | Desktop | Mobile |
|---|---|---|
async |
76% | 76% |
defer |
42% | 42% |
async and defer |
28% | 29% |
module |
4% | 4% |
nomodule |
0% | 0% |
async, defer, async and defer, type="module", and nomodule attributes on <script> elements.
It’s encouraging that 76% of mobile pages load scripts with async, as that suggests developers are cognizant of the effects of render blocking. However, such a low usage of defer suggests that there are opportunities being left on the table to improve rendering performance.
As noted last year, using both async and defer is an antipattern that should be avoided as the defer part is ignored and async takes precedence.
The general absence of type="module" and nomodule is not surprising, as few pages seem to be shipping JavaScript modules. As time goes on, the usage of type="module" in particular may increase, as developers ship untransformed JavaScript modules to the browser.
Looking at the percentage of overall scripts across all the sites, presents a slightly different view:
| Feature | Desktop | Mobile |
|---|---|---|
async |
49.3% | 47.2% |
defer |
8.8% | 9.1% |
async and defer |
3.0% | 3.1% |
module |
0.4% | 0.4% |
nomodule |
0% | 0% |
async, defer, async and defer, type="module", and nomodule attributes on <script> elements.
Here we see a much smaller use of both async and defer. Some of these scripts may be being inserted dynamically after the initial rendering, but it’s also likely a good proportion of pages are not setting these attributes on a lot of their scripts that are included in the initial HTML and so are delaying rendering.
preload, prefetch, and modulepreload
Resource hints such as preload, prefetch, and modulepreload are useful in hinting to the browser which resources should be fetched early. Each hint has a different purpose, with preload used to fetch resources needed for the current navigation, modulepreload the equivalent for preloading scripts that contain JavaScript modules, and prefetch used for resources needed in the next navigation.
| Resource hint | Desktop | Mobile |
|---|---|---|
preload |
16.4% | 15.4% |
prefetch |
1.0% | 0.8% |
modulepreload |
0.1% | 0.1% |
Analyzing the trend of resource hint adoption is tricky. Not all pages benefit from them, and it’s unwise to make a blanket recommendation to use resource hints broadly, as their overuse has their own consequences—especially where preload is concerned. However, the relative abundance of preload hints on 15% of mobile pages suggests that many developers are aware of this performance optimization, and are trying to use it to their advantage.
prefetch is tricky to use, though it can be beneficial for long, multi-page sessions. Even so, prefetch is entirely speculative, so much so that browsers may ignore it in certain conditions. This means some pages may waste data by requesting resources which go unused. It really “just depends”.
The lack of use of modulepreload makes sense, since adoption of the type="module" attribute on <script> elements is similarly low. Even so, apps that ship JavaScript modules without transformations could benefit from this resource hint, as it will not fetch just the named resource, but the entire module tree. This could help in certain situations.
Let’s dig into an analysis of how many of each resource hint type is used.
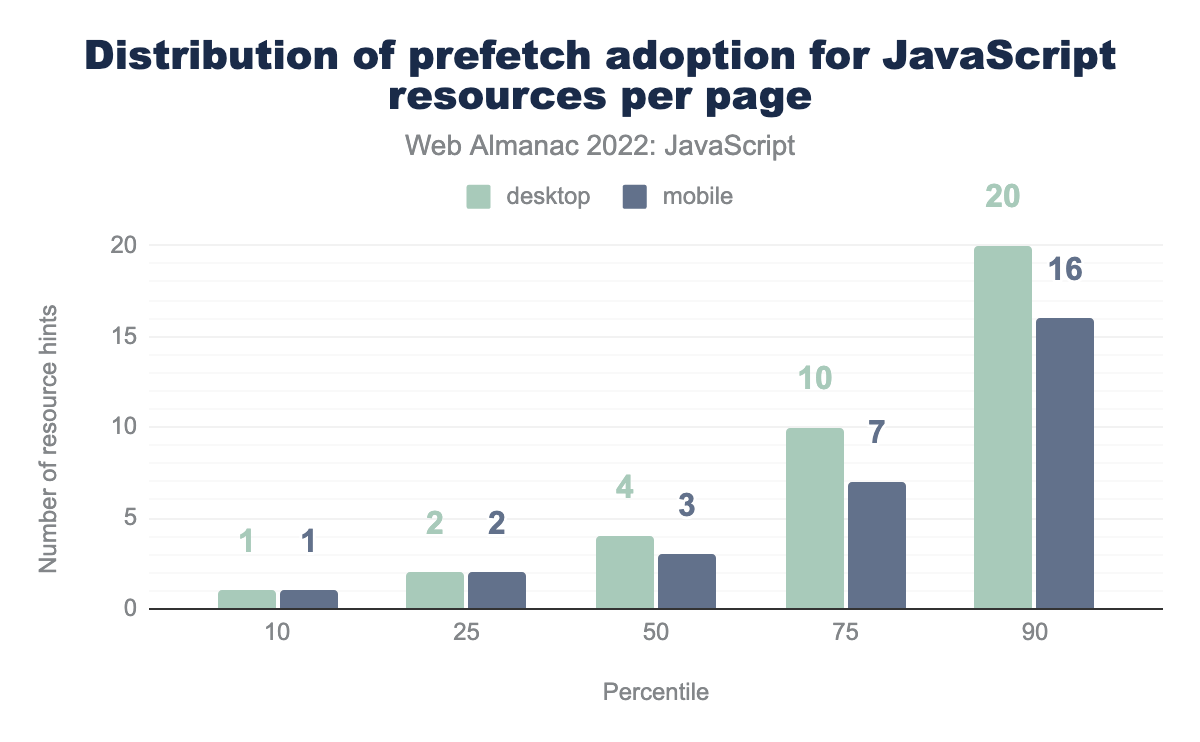
prefetch adoption for JavaScript resources per page.
Adoption of prefetch here is somewhat surprising, with three prefetch hints for JavaScript resources per page. However, the number of these hints at the 75th and 90th percentiles suggests that there may be a fair amount of waste in the form of unused resources for page navigations that never occur.
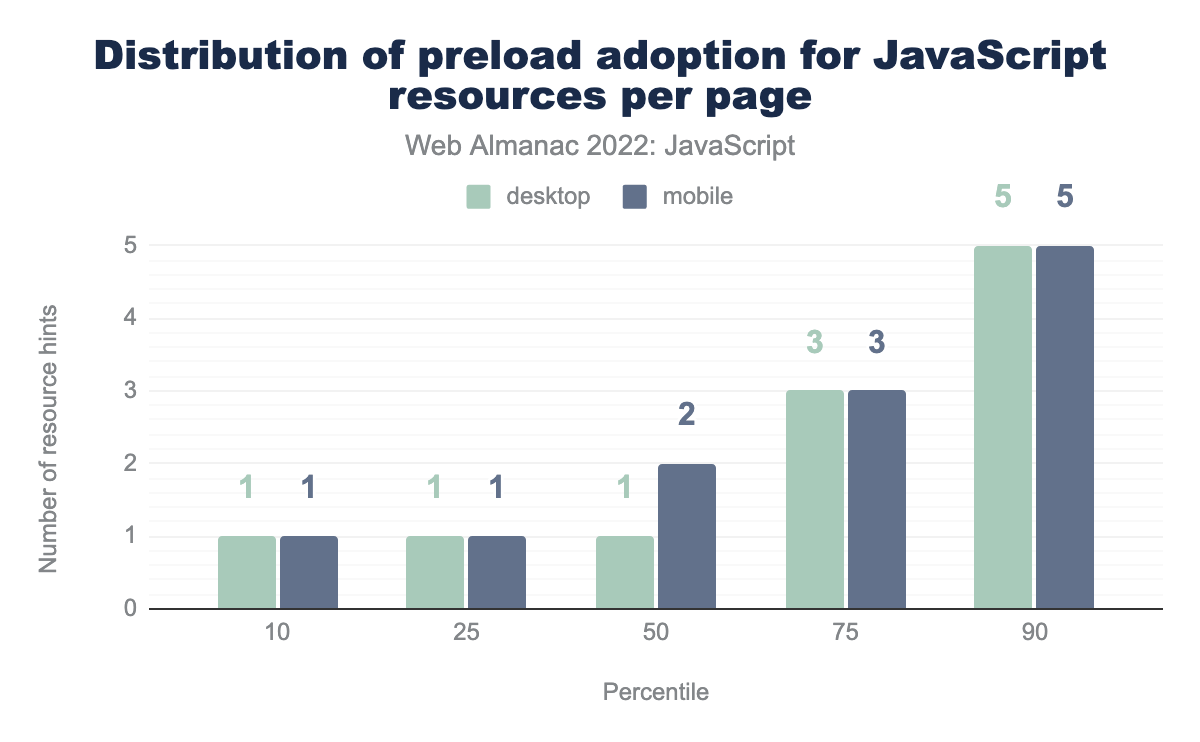
preload adoption for JavaScript resources per page.
Remember—this analysis tracks how many resource hints are used for JavaScript resources on pages that use one or more preload hints. The median page is delivering two preload hints for JavaScript, which isn’t bad on its face, but it often depends on the size of the script, how much processing scripts can kick off, or whether the script fetched via preload is even needed for the initial page load.
Unfortunately, we see five preload hints for JavaScript resources at the 90th percentile, which may be too much. This suggests that pages at the 90th percentile are especially reliant on JavaScript, and are using preload to try and overcome the performance issues that result.
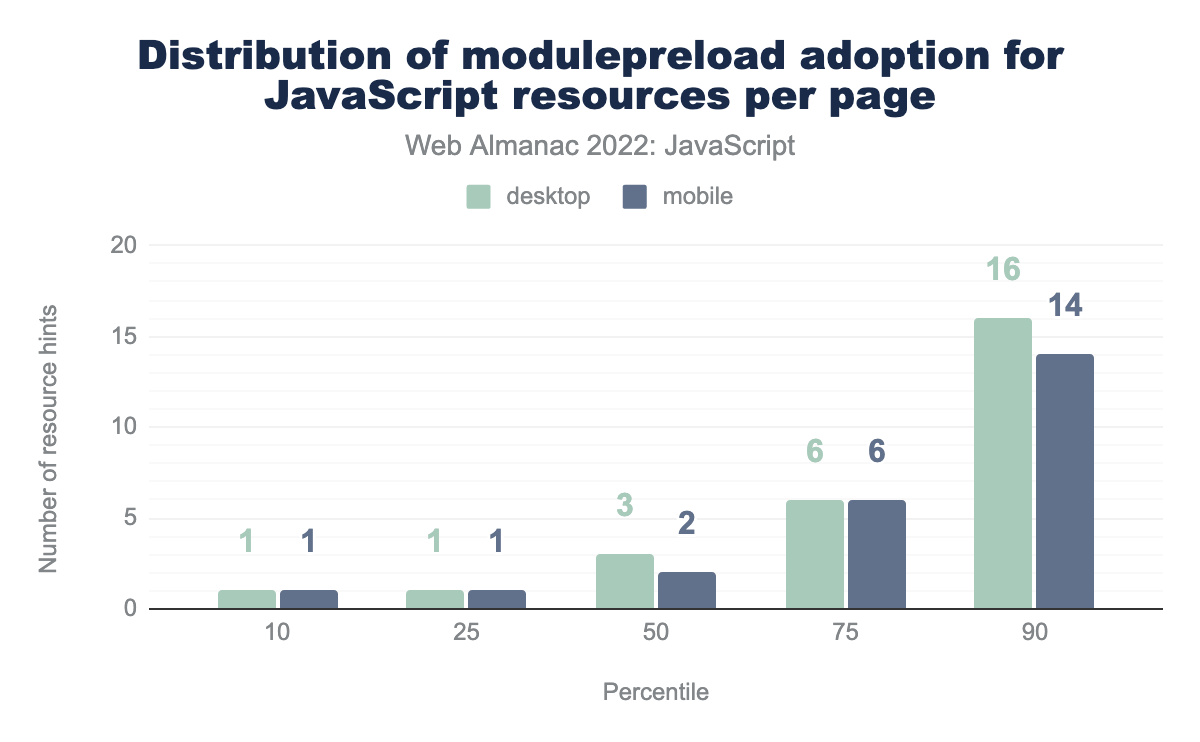
modulepreload adoption for JavaScript resources per page.
With modulepreload, we see a staggering 6 hints at the 75th percentile, and 14 at the 90th percentile! This suggests that, while pages using one or more modulepreload hints at upper percentiles are shipping untransformed ES6 modules directly to the browser, the need for so many resource hints suggests an overreliance on JavaScript at the upper range.
Resource hints are great tools for optimizing how we load resources in the browser, but if there’s one piece of advice you can heed when using them, it’s to use them sparingly, and for resources that may not be initially discoverable; for example, a JavaScript file initially loaded in the DOM that requests another one. Rather than preloading loads of scripts, try to whittle down the amount of JavaScript you’re shipping, as that will lead to a better user experience rather than preloading gobs of it.
JavaScript in the <head>
An old and often-touted best practice for performance has been to load your JavaScript in the footer of the document to avoid render blocking of scripts and to ensure the DOM is constructed before your scripts have a chance to run. In recent times, however, it has been more commonplace in certain architectures to place <script> elements in the document <head>.
This can be a good way to prioritize the loading of JavaScript in web applications, but async and defer attributes should be used where possible to avoid render blocking of the DOM. Render blocking is when the browser must halt all rendering of the page in order to process a resource that the page depends on. This is done to avoid unpleasant effects such as the flash of unstyled content, or JavaScript runtime errors that can occur when the DOM isn’t ready for a script that depends on DOM readiness.
<head>.
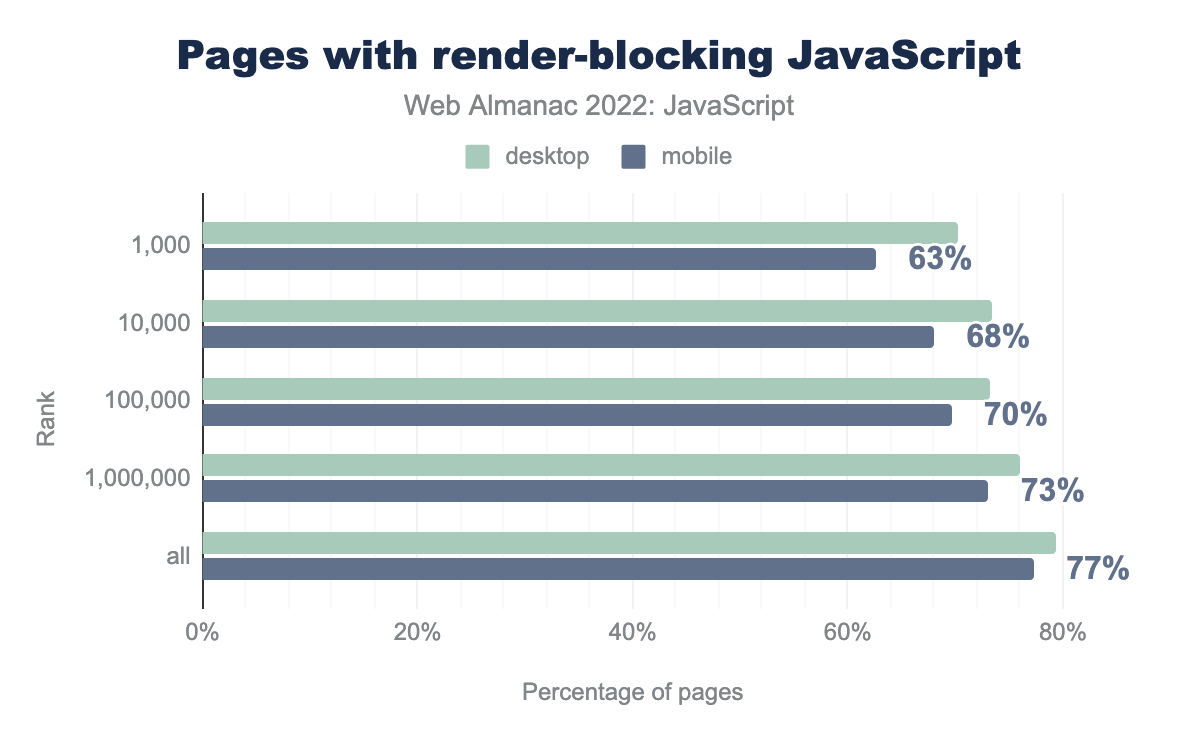
We found that 77% of mobile pages have at least one render-blocking script in the document <head>, whereas 79% of desktop pages do this. This is a concerning trend, because when scripts block rendering, page content is not painted as quickly as it could be.
<head>.
When looking at the problem by ranked pages, we see a similarly troubling pattern. In particular, 63% of the top 1,000 websites accessed on mobile devices ship at least one render blocking script in the <head>, and the proportion of pages increases as we proceed through the ranks.
There are solutions to this: using defer is a relatively safe bet that will unblock the DOM from rendering. Using async (when possible) is a good option, and will allow scripts to run immediately, but those scripts must not have any dependencies on other <script> elements, otherwise errors could occur.
Where possible, render-critical JavaScript can be placed in the footer and preloaded so the browser can get a head start on requesting those resources. Either way, the state of render-blocking JavaScript in tandem with how much JavaScript we ship is not good, and web developers should make more of an effort to curb these issues.
Injected scripts
Script injection is a pattern where an HTMLScriptElement is created in JavaScript using document.createElement and injected into the DOM with a DOM insertion method. Alternatively, <script> element markup in a string can be injected into the DOM via the innerHTML method.
Script injection is a fairly common practice used in a number of scenarios, but the problem with it is that it defeats the browser’s preload scanner by making the script undiscoverable as the initial HTML payload is parsed. This can affect metrics such as Largest Contentful Paint (LCP) if the injected script resource is ultimately responsible for rendering markup, which itself can kick off long tasks to parse large chunks of markup on the fly.
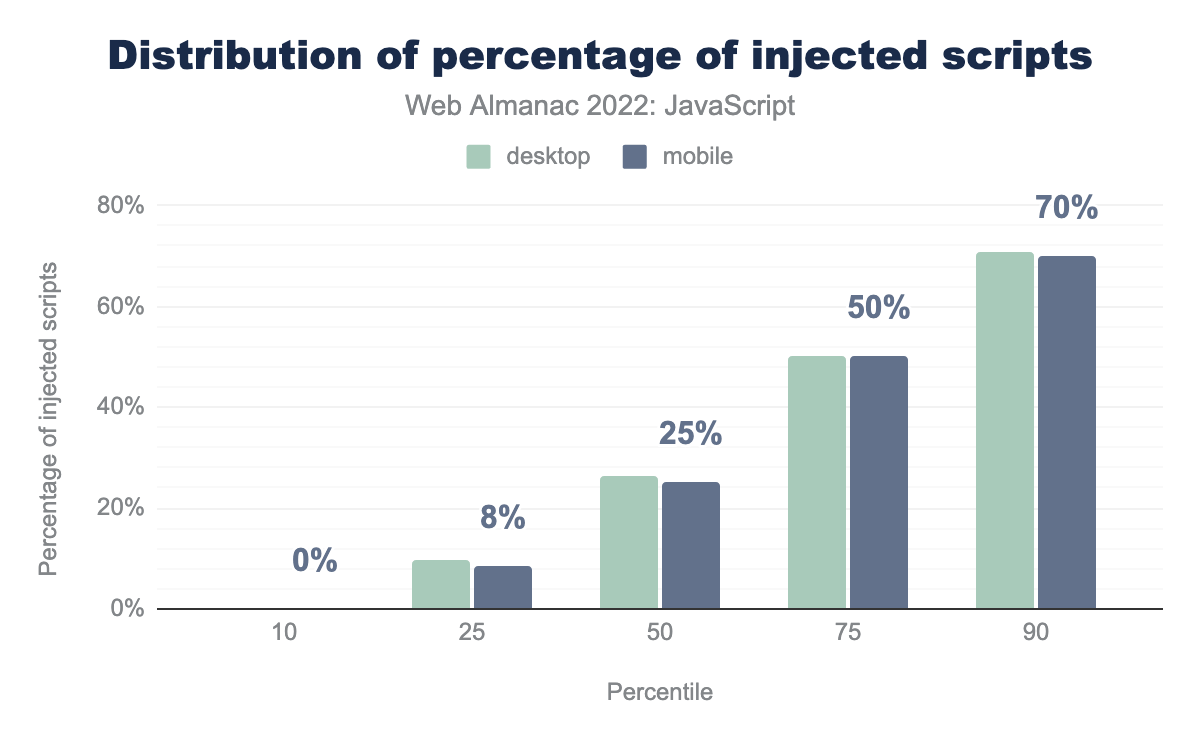
At the median, we see that 25% of a page’s scripts are injected, as opposed to leaving them discoverable in the initial HTML response. More concerning is that the 75th and 90th percentiles of pages inject 50% and 70% of scripts respectively.
Script injection has the potential to harm performance when used to render page content the user consumes, and should be avoided in these cases whenever necessary. That script injection is so prevalent in today’s web is a concerning trend. Modern frameworks and tooling may rely on this pattern, which means that some out-of-the-box experiences may rely on this potential anti-pattern to provide functionality for websites.
First-party versus third-party JavaScript
There are two categories of JavaScript that websites often ship:
- First-party scripts that power the essential functions of your website and provide interactivity.
- Third-party scripts provided by external vendors that satisfy a variety of requirements, such as UX research, analytics, providing advertising revenue, and embeds for things such as videos and social media functions.
While first-party JavaScript may be easier to optimize, third-party JavaScript can itself be a significant source of performance problems, as third-party vendors may not prioritize the optimization of their JavaScript resources over adding new features to serve additional business functions for their clients. Additionally, UX researchers, marketers, and other non-technical personnel may be hesitant to give up functionality or sources of revenue that these scripts provide.
In this section, we’ll analyze the breakdown of first-party and third-party code, and comment on the current state of how websites today are divvying up how they load JavaScript—and where from.
Requests
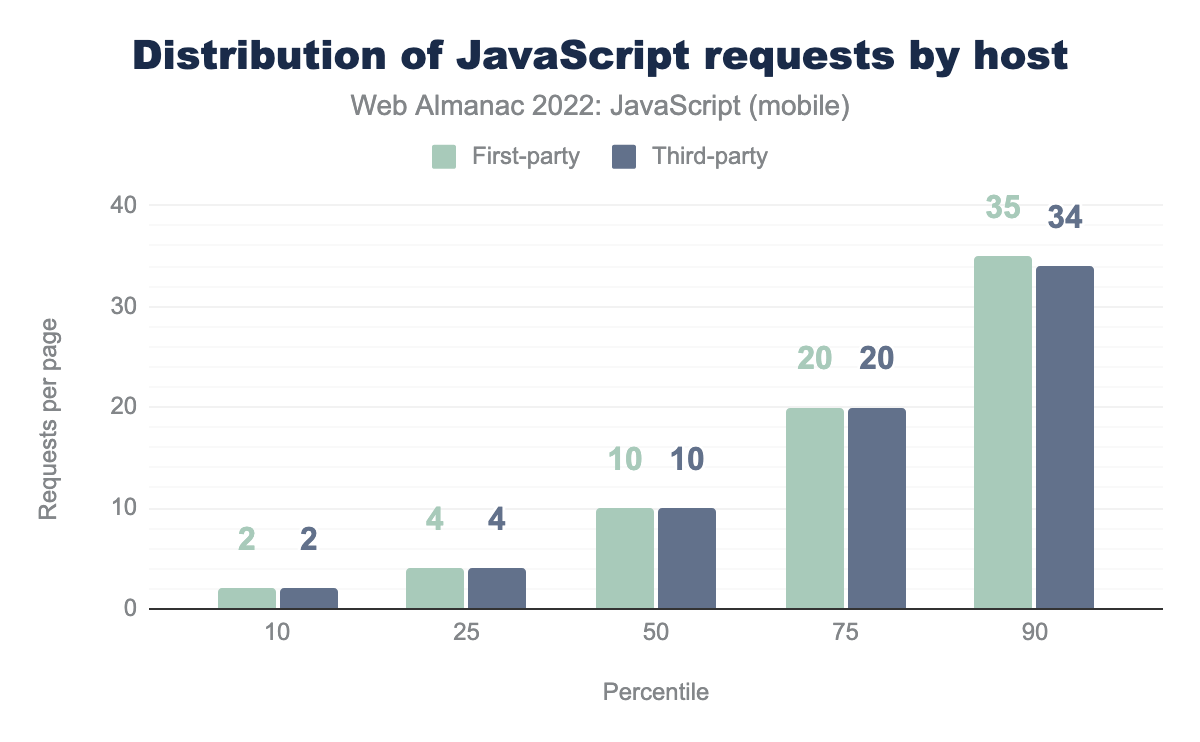
Here, we see a sobering picture. Regardless of the percentile, it seems that all observed hosts are serving an equivalent amount of first and third-party scripts. The median host serves 10 of each type, the 75th percentile serves 20 of each type, and the 90th percentile host serves 34 third-party scripts!
This is a problematic and worrying trend. Third-party scripts are responsible for all sorts of damage when it comes to performance. Third-party scripts may do a number of things, such as running expensive timers that orchestrate multitudes of tasks, attach their own event listeners that add extra work which can delay interactivity, and some video and social media third-parties ship exorbitant amounts of scripts to power the services they provide.
Steps for mitigating third-party scripts is often more of a cultural affair than an engineering one. If you’re shipping excessive third-party scripts, conduct an audit of each script, what they do, and profile their activity to find out what performance problems they’re incurring.
If you’re doing considerable UX research, consider collecting your own field data (if the origin sends a proper Timing-Allow-Origin header) to make informed decisions to avoid the performance problems that some third-party scripts can cause. For every third-party script you add, you’re not just incurring loading costs, but also costs during runtime where responsiveness to user input is crucial.
Bytes
So we know that hosts are shipping a lot of third-party scripts, but what’s the byte cost of first- versus third-party scripts?
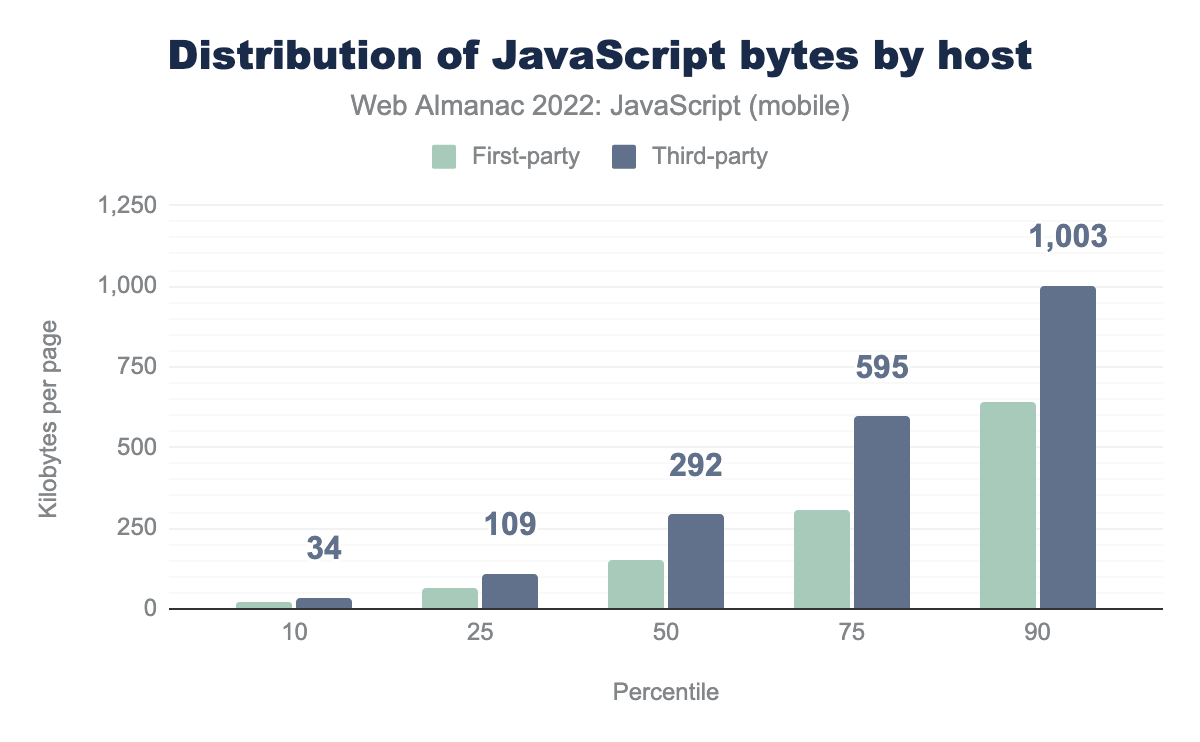
At nearly every percentile, the amount of bytes third-party scripts ship exceeds that of first-party scripts. At the 75th percentile, it appears that third-party script payloads are twice that of first-party scripts. At the 90th percentile, it appears that the amount of third-party scripts sent over the wire is nearly one megabyte.
If you find your website’s first versus third-party script payloads is similar to the graph above, it is key that you should work with your engineering organization to try and get this number down. It can only help your users if you do.
Dynamic import()
Dynamic import() is a variant of the static import syntax that can be run anywhere in a script, whereas static import expressions must be run at the top of a JavaScript file and nowhere else.
Dynamic import() allows developers to effectively “split” off chunks of JavaScript code from their main bundles to be loaded on-demand, which can improve startup performance by loading less JavaScript upfront.
import().
A staggeringly low 0.34% of all observed mobile pages currently use dynamic import(), while 0.41% of desktop pages use it. That said, it’s common for some bundlers to transform the dynamic import() syntax into an ES5-compatible alternative. It’s very likely that the feature is in wider use, just less so in production JavaScript files.
It’s tricky, but a balance can be struck, and it involves gauging the user’s intent. One way of deferring loading of JavaScript without delaying interactions is to preload that JavaScript when the user signals intent to make an interaction. One example of this could be to defer loading JavaScript for the validation of a form, and preload that JavaScript once the user has focused a field in that form. That way, when the JavaScript is requested, it will already be in the browser cache.
Another way could be to use a service worker to precache JavaScript necessary for interactions when the service worker is installed. Installation should occur at a point in which the page has fully loaded in the page’s load event. That way, when the necessary functionality is requested, it can be retrieved from the service worker cache without startup costs.
Dynamic import() is tricky to use, but more widespread adoption of it can help shift the performance cost of loading JavaScript from startup to a later point in the page lifecycle, presumably when there will be less network contention for resources. We hope to see increased adoption of dynamic import(), as the amount of JavaScript we see loaded during startup is only increasing.
Web workers
Web workers are a web platform feature that reduces main thread work by spinning up a specialized JavaScript file without direct access to the DOM on its own thread. This technology can be used to offload tasks that could otherwise overwhelm the main thread by doing that work on a separate thread altogether.
It’s heartening to see that 12% of mobile and desktop pages currently use one or more web workers to relieve the main thread of work that could potentially make the user experience worse—but there’s a lot of room for improvement.
If you have significant work that can be done without direct access to the DOM, using a web worker is a good idea. While you have to use a specialized communication pipeline to transfer data to and from a web worker, it’s entirely possible to make your web pages much more responsive to user input by using the technology.
However, that communication pipeline can be tricky to set up and use, though there are open source solutions that can simplify this process. comlink is one such library that helps with this, and can make the developer experience around web workers much more enjoyable.
Whether you manage web workers on your own or with a library, the point is this: if you have expensive work to do, gauge whether or not it needs to happen on the main thread, and if not, strongly consider using web workers to make the user experience of your websites as good as it possibly can be.
Worklets
Worklets are a specialized type of worker that allows lower-level access to rendering pipelines for tasks such as painting and audio processing. While there are four types of worklets, only two—paint worklets and audio worklets—are currently implemented in available browsers. One distinct performance advantage of worklets is that they run on their own threads, freeing up the main thread from expensive drawing and audio processing work.
With worklets being such niche technologies, it’s not surprising that they’re not widely used. Paint worklets are an excellent way of offloading expensive processing for generative artwork onto another thread—not to mention a great technique for adding a bit of flair to the user experience. For every 1 million websites, only 13 of them use a paint worklet.
Adoption of audio worklets is even lower: only four in a million websites use it. It will be interesting to see how adoption of these technologies trends over time.
How is JavaScript delivered?
An equally important aspect of JavaScript performance is how we deliver scripts to the browser, which includes a few common—yet sometimes missed—opportunities for optimization, starting with how we compress JavaScript.
Compression
Compression is an often-used technique that applies largely to text-based assets, such as HTML, CSS, SVG images, and yes, JavaScript. There are a variety of compression techniques that are widely used on the web that can speed up the delivery of scripts to the browser, effectively shortening the resource load phase.
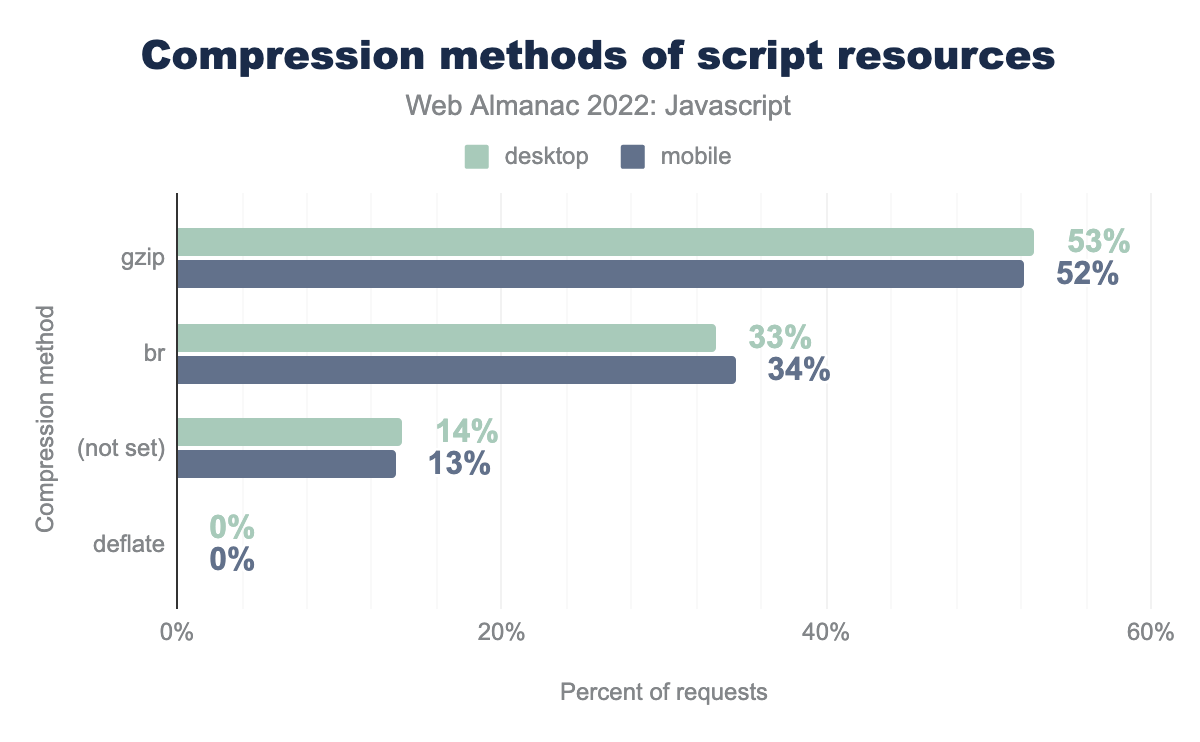
There are a few compression techniques that can be used to reduce the transfer size of a script, with the Brotli (br) method being the most effective. Despite Brotli’s excellent support in modern browsers, it’s still clear that gzip is the most preferred method of compression. This is likely due to the fact that many web servers use it as the default.
When something is the default, that default sometimes remains in place rather than being tuned for better performance. Given that only 34% of pages observed are compressing scripts with Brotli, it’s clear that there’s an opportunity on the table to improve the loading performance of script resources, but it’s also worth noting that it is an improvement over last year’s adoption at 30%.
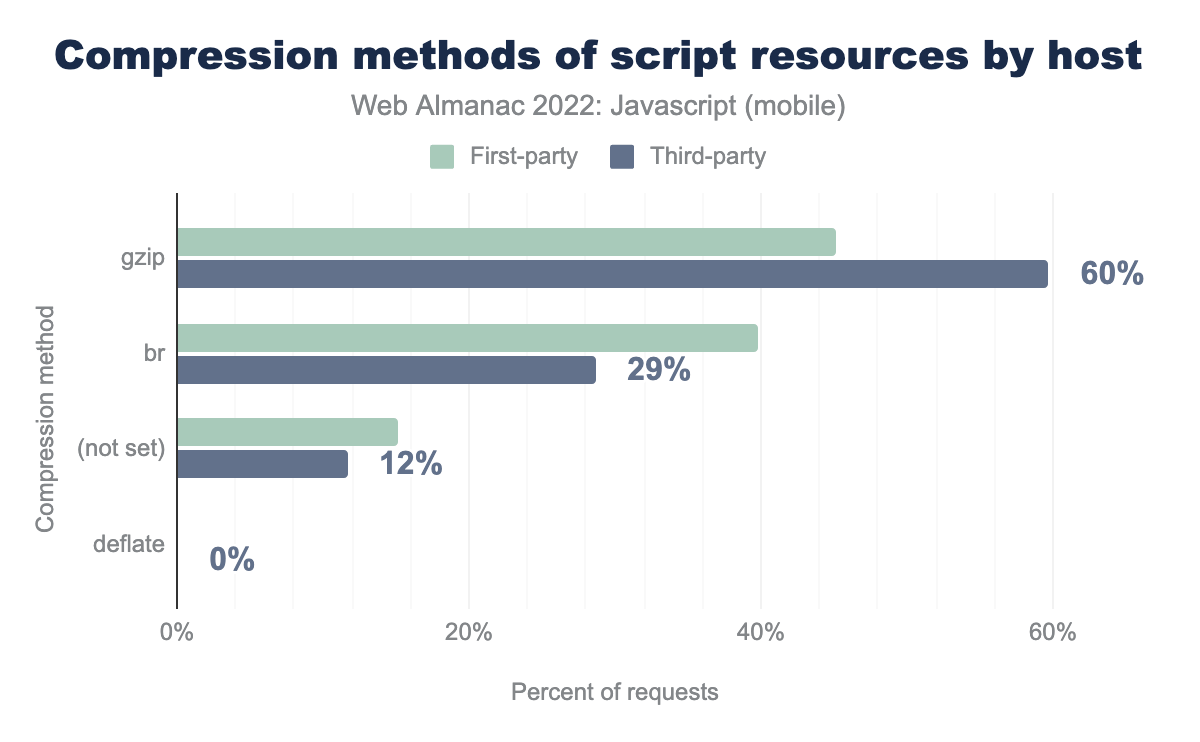
The problem is made worse by third-party script providers, which still deploy gzip compression more widely than Brotli at 60% versus 29%, respectively. Given that third-party JavaScript is a serious performance issue on the web today, the resource load time of these resources could be reduced by deploying third-party resources using Brotli instead.
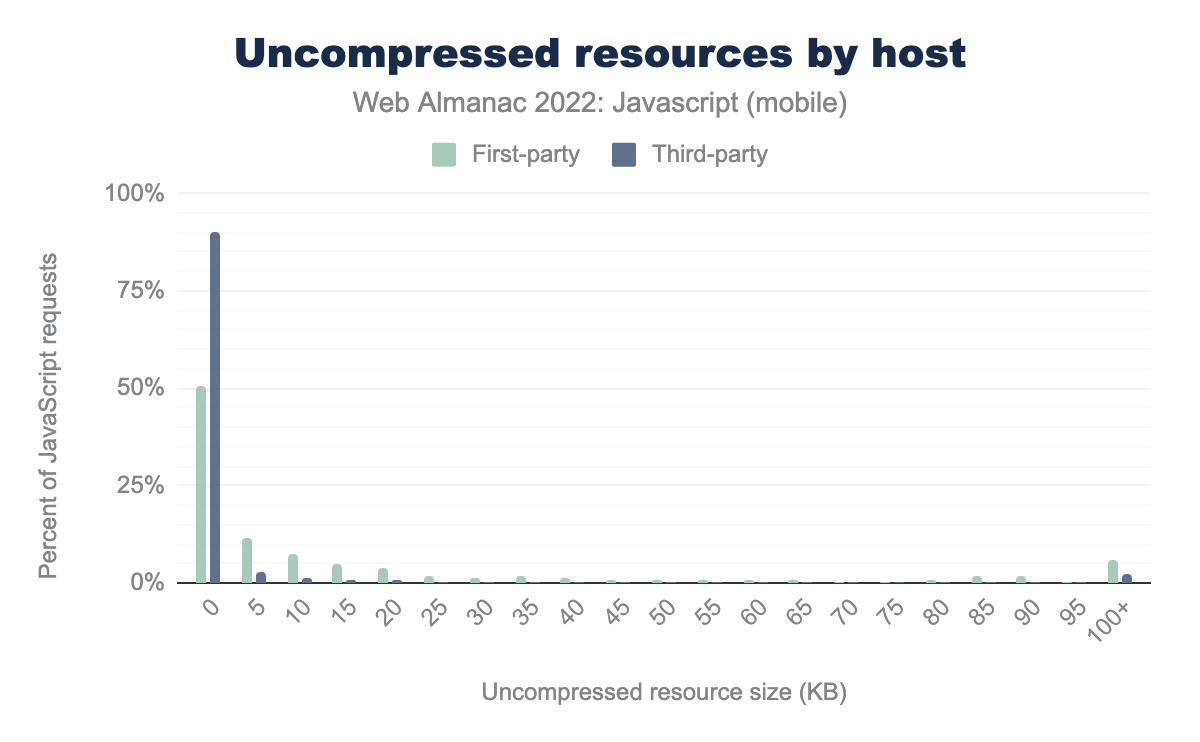
Thankfully, we’re seeing that it’s only mostly the smallest resources, specifically those third-party scripts that have payloads smaller than 5 KB, that are being delivered without compression. This is because compression yields diminishing returns when applied to small resources, and in fact, the added overhead of dynamic compression may cause delayed resource delivery. There are, unfortunately, some opportunities across the spectrum to compress larger resources, such as some first-party scripts with payloads over 100 KB.
Always check your compression settings to ensure you’re delivering the smallest possible script payloads over the network, and remember: compression speeds up resource delivery. Those scripts, once delivered to the browser, will be decompressed and their processing time will not change due to compression. Compression is not a good excuse to deliver huge script payloads that can make interactivity worse during startup.
Minification
Minification of text assets is a time-tested practice for reducing file size. The practice involves removing all of the unnecessary spaces and comments from source code in order to reduce their transfer size. A further step known as uglification is applied to JavaScript, which reduces all of the variables, class names, and function names in a script to shorter, unreadable symbols. Lighthouse’s Minify JavaScript audit checks for unminified JavaScript.
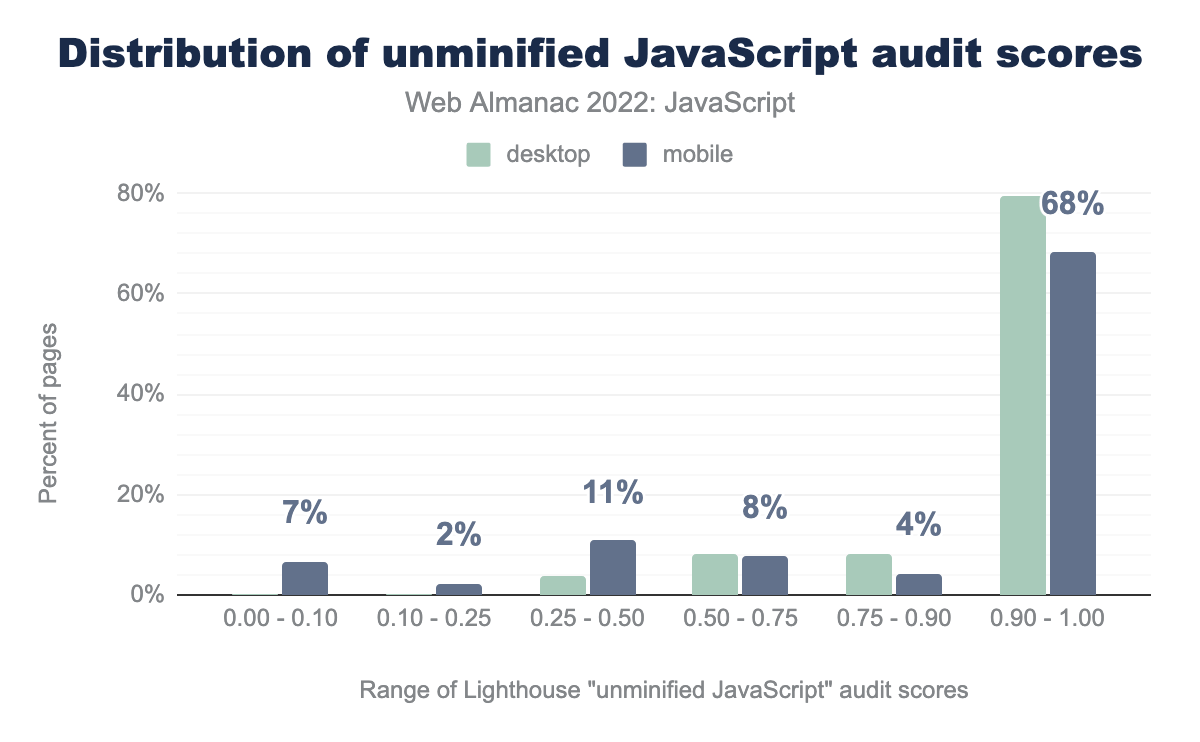
Here, 0.00 represents the worst score whereas 1.00 represents the best score. 68% of mobile pages are scoring between 0.9 and 1.0 on Lighthouse’s minified JavaScript audit, whereas the figure for desktop pages is 79%. This means that on mobile, 32% of pages have opportunities to ship minified JavaScript, whereas that figure for desktop pages is 21%.
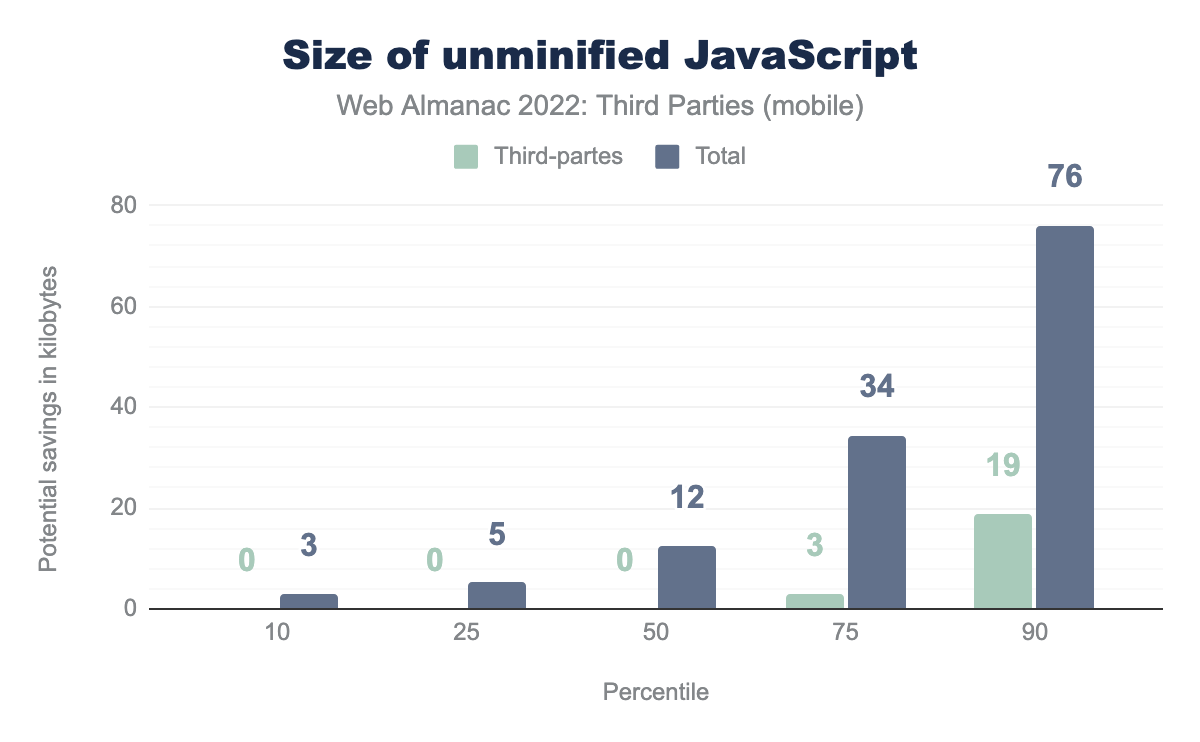
At the median, we see that pages are shipping around 12 KB of JavaScript that can be minified. By the time we get to the 75th and 90th percentiles, however, that number jumps quite a bit, from 34 KB to about 76 KB. Third-parties are pretty good throughout, up until we get to the 90th percentile, however, where they’re shipping around 19 KB of unminified JavaScript.
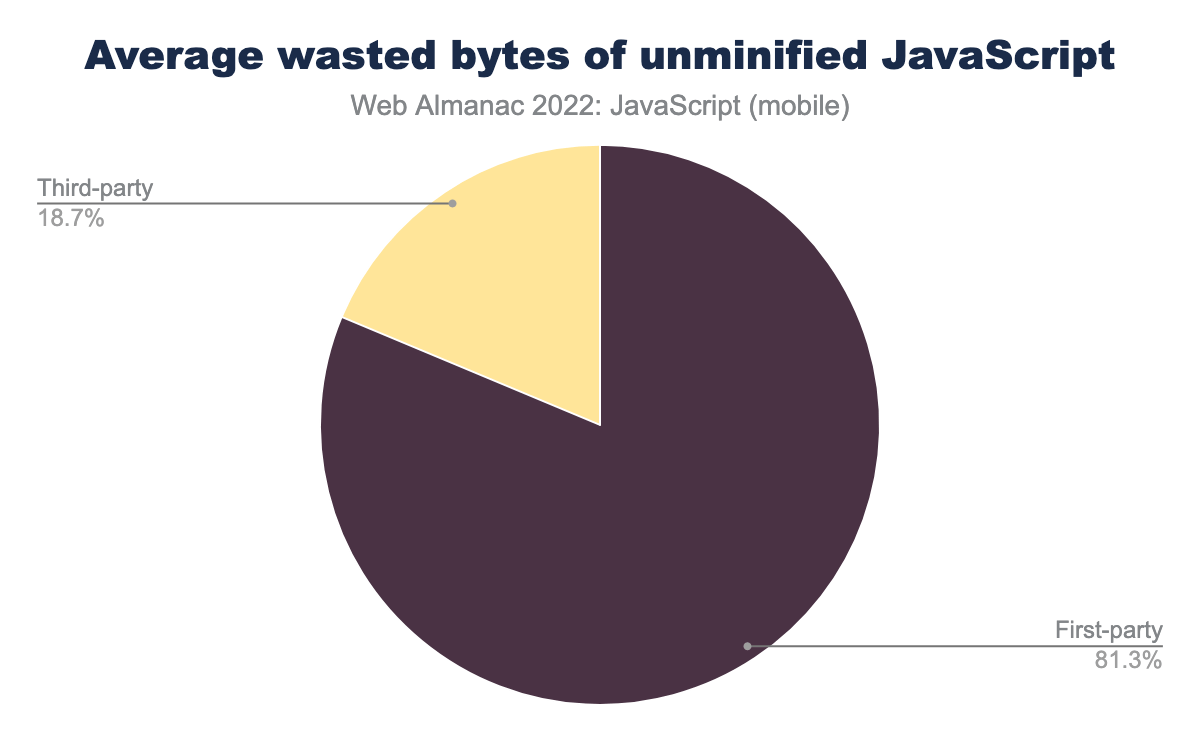
Given the data we just presented, wasted bytes of unminified JavaScript isn’t too surprising when you look at the average. First parties are overwhelmingly the biggest culprits in shipping unminified JavaScript at just over 80%. The remainder are just under 20% that could be doing a bit more to ship less bytes over the wire.
Minification addresses one of the first principles of web performance: ship less bytes. If you’re failing the Lighthouse audit for unminified JavaScript, check your bundler’s configuration to ensure your first party code is as streamlined for production as it can be. If you notice a third-party script that’s unminified, it might be time to have a chat with that vendor to see what they can do to fix it. Refer to the Third Parties chapter for an even deeper look into the state of third parties on the web.
Source maps
Source maps are a tool that web developers use to map minified and uglified production code to their original sources. Source maps are used in production JavaScript files, and are a useful debugging tool. Source maps can be specified in a comment pointing to a source map file at the end of a resource, or as the SourceMap HTTP response header.
14% of JavaScript resources accessed through mobile devices deliver a source map comment to a source map that is publicly accessible, whereas 15% of JavaScript resources accessed through desktop devices deliver them. However, the story is quite different for pages using a source map HTTP header.
Only 0.12% of requests for JavaScript resources on mobile devices used a source map HTTP header, whereas the number for desktop devices is 0.07%.
From a performance perspective, this doesn’t mean much. Source maps are a developer experience enhancement. What you should avoid, however, is the use of inline source maps, which insert a base64 representation of the original source into a production-ready JavaScript asset. Inlining source maps means that you’re not just sending your JavaScript resources to users, but also their source maps, which can lead to oversized JavaScript assets that take longer to download and process.
Responsiveness
JavaScript affects more than just startup performance. When we rely on JavaScript to provide interactivity, those interactions are driven by event handlers that take time to execute. Depending on the complexity of interactions and the amount of scripts involved to drive them, users may experience poor input responsiveness.
Metrics
Many metrics are used to assess responsiveness in both the lab and the field, and tools such as Lighthouse, Chrome UX Report (CrUX), and HTTP Archive track these metrics to provide a data-driven view of the current state of responsiveness on today’s websites. Unless otherwise noted, all of the following graphs depict the 75th percentile—the threshold for which Core Web Vitals are determined to be passing—of that metric at the origin level.
The first of these is First Input Delay (FID), which records the input delay of the very first interaction made with a page. The input delay is the time between which the user has interacted with the page and when the event handlers for that interaction begin to run. It’s considered a load responsiveness metric that focuses on the first impression a user gets when interacting with a website.
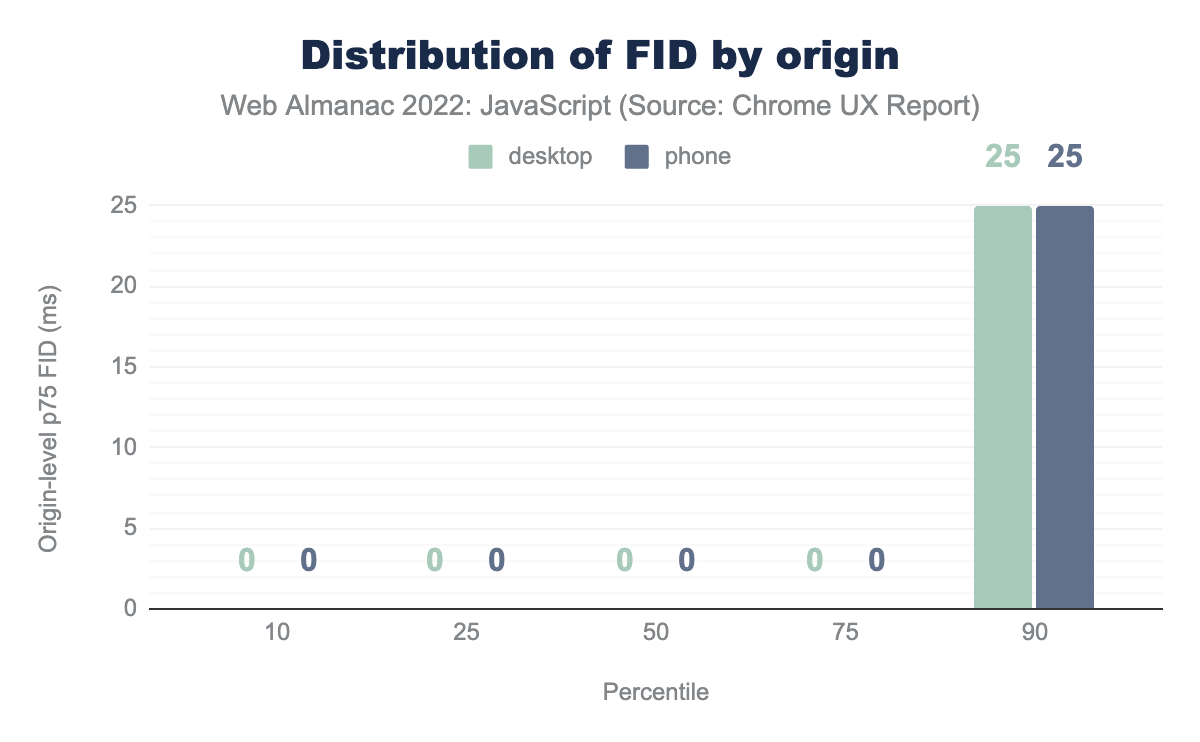
This chart shows the distribution of all websites’ 75th percentile FID values. The median website has a FID value of 0 ms for at least 75% of both desktop and phone user experiences. This “perfect FID” experience even extends into the 75th percentile of websites. Only when we get to the 90th percentile do we start to see imperfect FID values, but only 25 ms.
Given that the “good” FID threshold is 100 ms, we can say that at least 90% of websites meet this bar. In fact, we know from the analysis done in the Performance chapter that 100% of websites actually have “good” FID experiences on desktop devices, and 92% on mobile devices. FID is an unusually permissive metric.
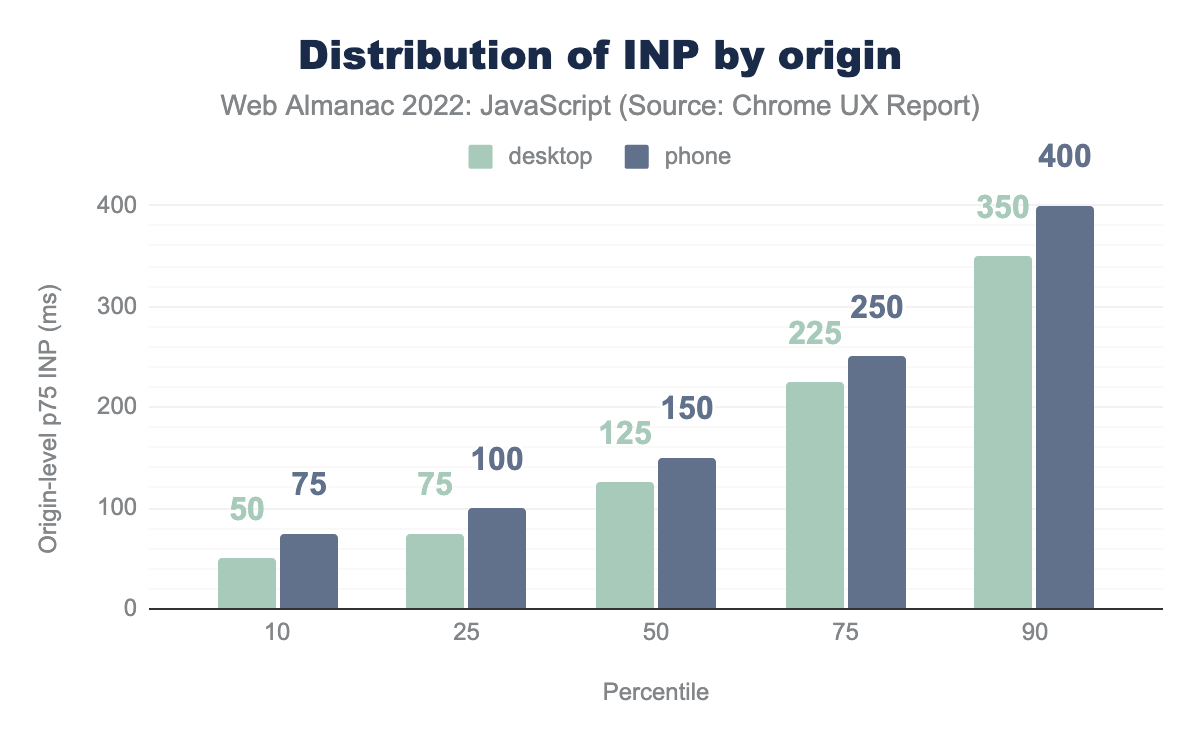
In order to get a comprehensive view of page responsiveness across the entire page lifecycle, though, we need to look at Interaction to Next Paint (INP), which assesses all keyboard, mouse, and touch interactions made with a page and selects a high percentile of interaction latency that’s intended to represent overall page responsiveness.
Consider that a “good” INP score is 200 milliseconds or less. At the median, both mobile and desktop score below this threshold, but the 75th percentile is another story, with both mobile and desktop segments well within the “needs improvement” range. This data, quite unlike FID, suggests that there are many opportunities for websites to do everything they can to run fewer long tasks on pages, which are a key contributor to less-than-good INP scores.
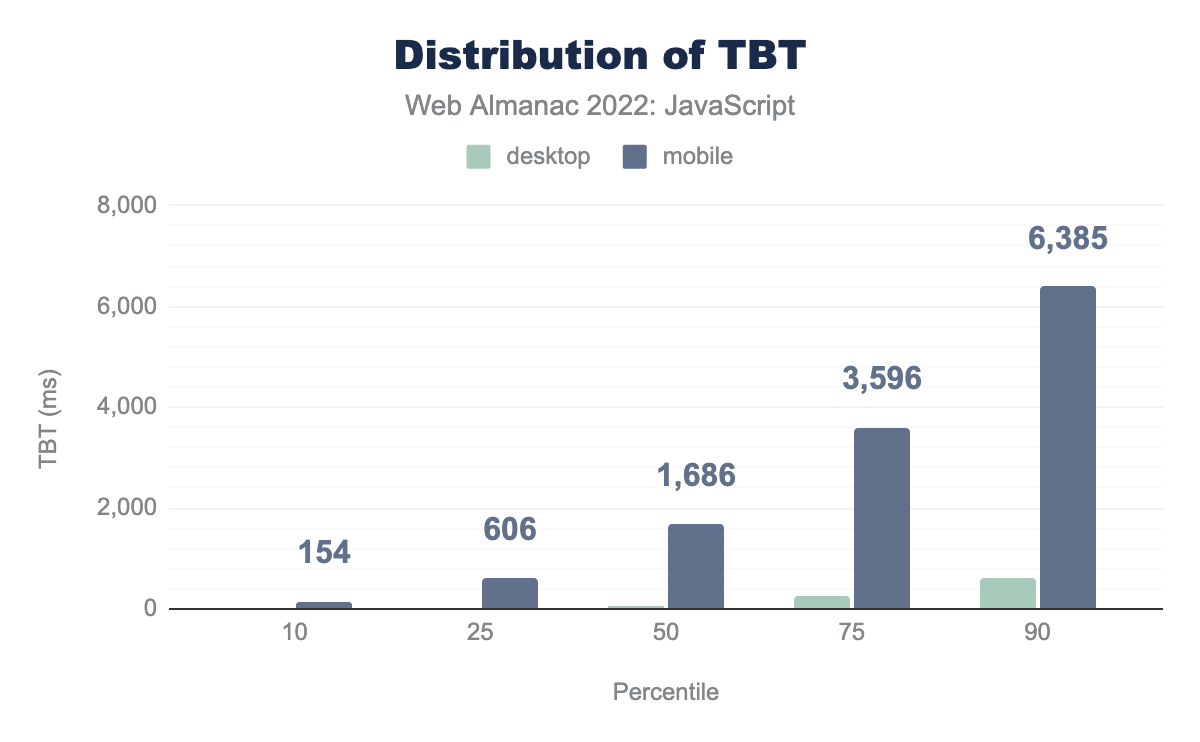
Dovetailing into long tasks, there’s the Total Blocking Time (TBT) metric, which calculates the total blocking time of long tasks during startup.
Note that unlike the preceding stats on FID and INP, TBT and TTI (below) are not sourced from real-user data. Instead, we’re measuring synthetic performance in simulated desktop and mobile environments with device-appropriate CPU and network throttling enabled. As a result of this approach, we get exactly one TBT and TTI value for each page, rather than a distribution of real-user values across the entire website.
Considering that INP correlates very well with TBT, it’s reasonable to assume that high TBT scores may produce poorer INP scores. Using our synthetic approach, we see a wide gulf between desktop and mobile segments, indicating that desktop devices with better processing power and memory are outperforming less capable mobile devices by a wide margin. At the 75th percentile, a page has nearly 3.6 seconds of blocking time, which qualifies as a poor experience.
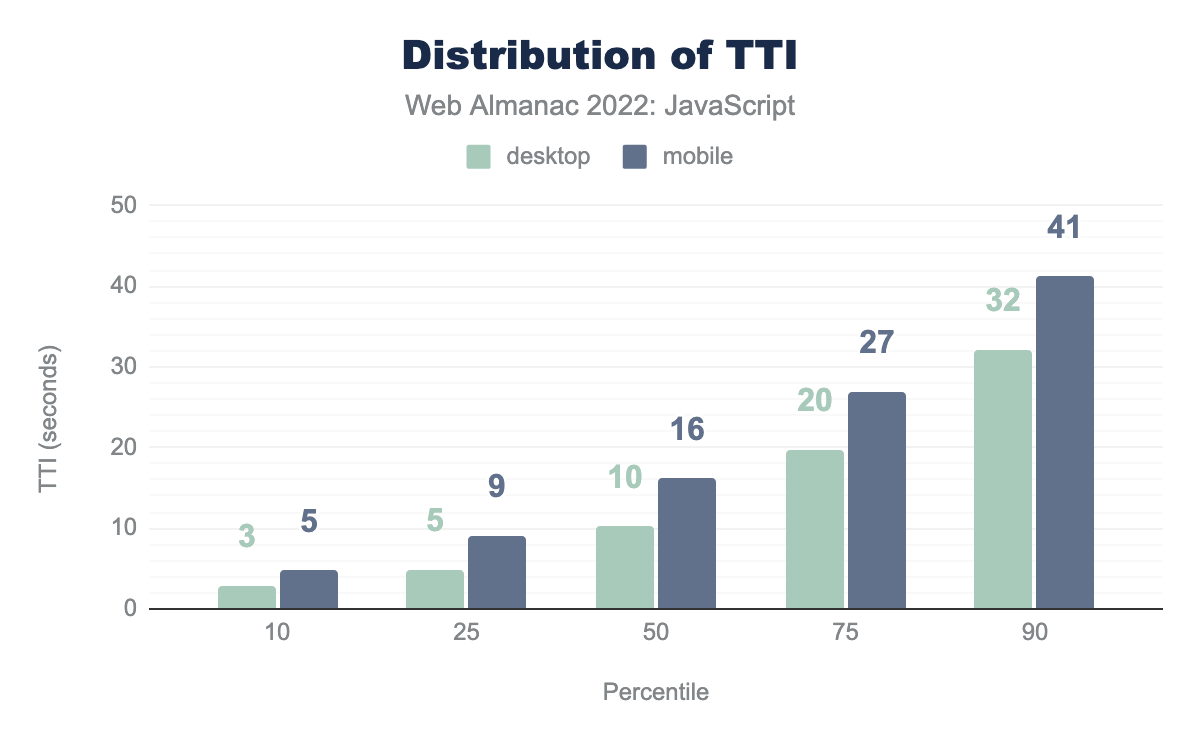
Finally, we come to Time to Interactive (TTI), which is considered “good” if the metric comes in at under 5 seconds. Given that only the 10th percentile barely slips in under the 5 second mark, most websites in our simulated environment are relying on JavaScript to such an extent that pages are unable to become interactive within a reasonable timeframe—especially the 90th percentile, which takes a staggering 41.2 seconds to become interactive.
Long tasks/blocking time
As you may have gleaned from the previous section, the principal cause of poor interaction responsiveness is long tasks. To clarify, a long task is any task that runs on the main thread for longer than 50 milliseconds. The length of the task beyond 50 milliseconds is that task’s blocking time, which can be calculated by subtracting 50 milliseconds from the task’s total time.
Long tasks are a problem because they block the main thread from doing any other work until that task is finished. When a page has lots of long tasks, the browser can feel like it’s sluggish to respond to user input. In extreme cases, it can even feel like the browser isn’t responding at all.
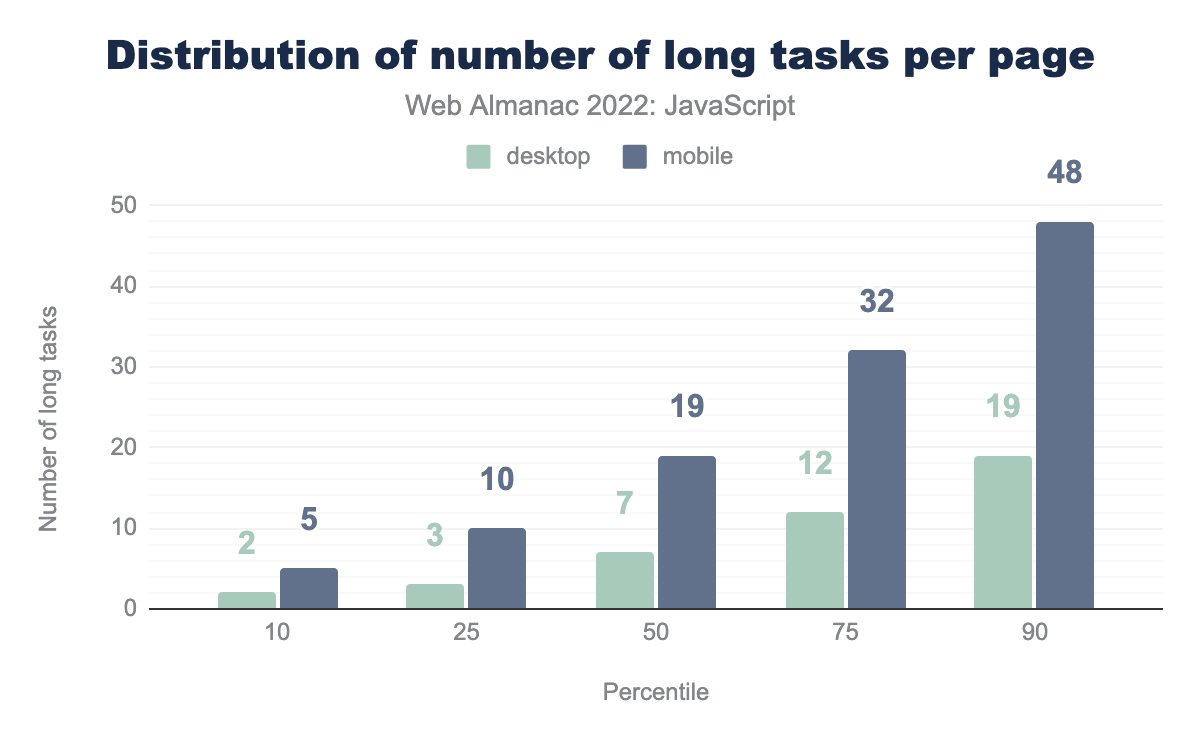
The median page encounters 19 long tasks on mobile and 7 long tasks on desktop devices. This makes sense when you consider that most desktop devices have greater processing power and memory resources than mobile devices, and are actively cooled.
However, the picture gets much worse at higher percentiles. Long tasks at the 75th percentile per page are 32 and 12 on mobile and desktop, respectively.
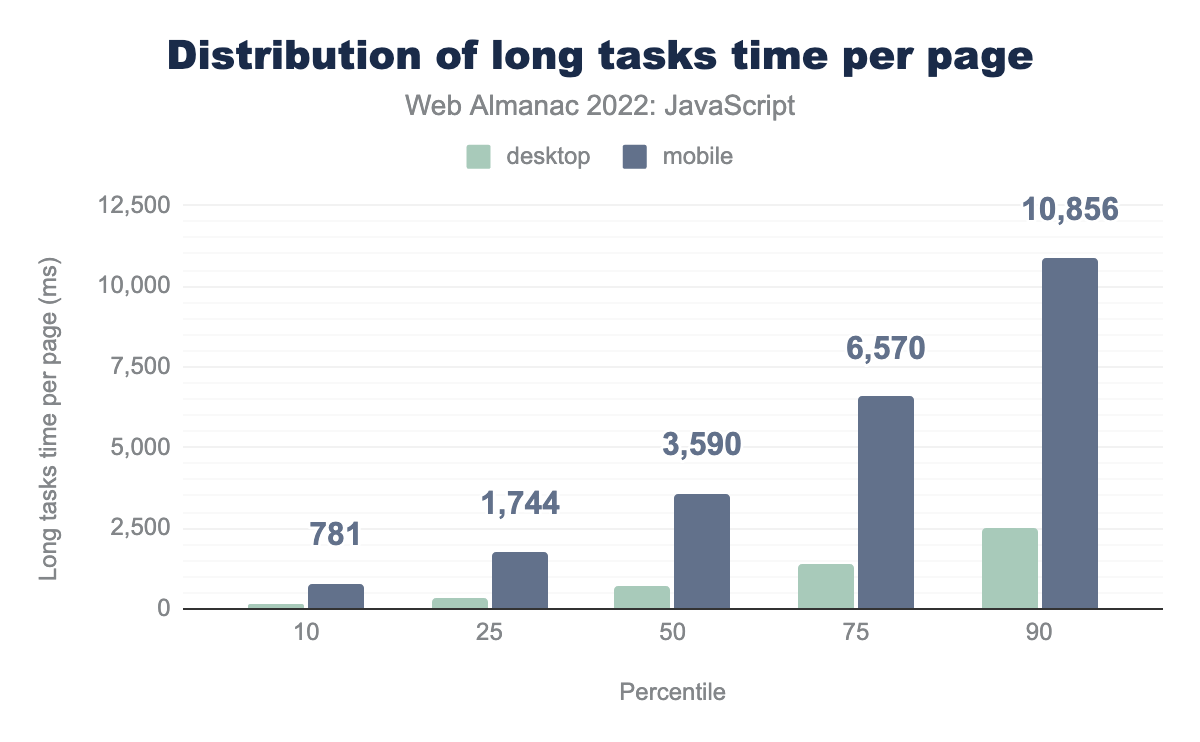
It’s not enough to know how many long tasks there are per page—we need to understand the total time those tasks are taking on pages. The median mobile page has 3.59 seconds of time dedicated to long tasks, whereas desktop pages have far less at 0.74 seconds.
The 75th percentile suggests a much worse picture for those on mobile devices, coming in at nearly 6.6 seconds of processing time per page dedicated to handling long tasks. This is a lot of time the browser is spending on intense work that could be optimized or even possibly be moved to web workers on a different thread. In any case, these results spell trouble for the mobile web and responsiveness.
Scheduler API
Scheduling JavaScript tasks has historically been deferred to the browser. There are newer methods such as requestIdleCallback and queueMicrotask, but these APIs schedule tasks in a coarse way, and—especially in the case of queueMicrotask—can cause performance issues if misused.
The Scheduler API has recently been released, and gives developers finer control over scheduling tasks based on priority—though it is currently only limited to Chromium-based browsers.
Only 20 per million (0.002%) mobile pages are currently shipping JavaScript that uses the Scheduler API, whereas 30 per million (0.003%) desktop pages do. This is not surprising, considering the lack of documentation on this very new feature, and its limited support. However, we expect this number to increase as documentation on the feature becomes available, and especially if it is used in frameworks. We believe that the adoption of this important new feature will eventually result in better user experience outcomes.
Synchronous XHR
AJAX—or usage of the XMLHttpRequest (XHR) method to asynchronously retrieve data and update information on the page without a navigation request—was a very popular method of creating dynamic user experiences. It has largely been replaced by the asynchronous fetch method, but XHR is still supported in all major browsers.
XHR has a flag that allows you to make synchronous requests. Synchronous XHR is harmful for performance because the event loop and main thread is blocked until the request is finished, resulting in the page hanging until the data becomes available. fetch is a much more effective and efficient alternative with a simpler API, and has no support for synchronous fetching of data.
While synchronous XHR is only used on 2.5% of mobile pages and 2.8% of desktop pages, its continued use—no matter how small—is still a signal that some legacy applications may be relying on this outdated method that harms the user experience.
Avoid using synchronous XHR, and XHR in general. fetch is a much more ergonomic alternative that lacks synchronous functionality by design. Your pages will perform better without synchronous XHR, and we hope someday to see this number fall to zero.
document.write
Before the introduction of DOM insertion methods (appendChild and others, for example), document.write was used to insert content at the position the document.write was made in the document.
document.write is very problematic. For one, it blocks the HTML parser, and is problematic for a number of other reasons the HTML spec itself warns against its use. On slow connections, blocking document parsing to append nodes in this way creates performance problems that are entirely avoidable.
document.write.
A staggering 18% of pages observed are still using document.write to add content to the DOM in lieu of proper insertion methods, whereas 17% of desktop pages are still doing so. The explanation for this could be legacy applications that haven’t been rewritten to use the preferred DOM methods to insert new nodes into the document, and even some third-party scripts that still use it.
We hope to see a decline in this trend. All major browsers explicitly warn against using this method. While it isn’t deprecated just yet, its existence in browsers in the years to come isn’t guaranteed. If document.write calls are in your website, you should prioritize removing them as soon as possible.
Legacy JavaScript
JavaScript has evolved considerably over the last several years. The introduction of new language features has turned JavaScript into a more capable and elegant language that helps developers to write more concise JavaScript, resulting in less JavaScript loaded—provided those features haven’t been unnecessarily transformed into a legacy syntax by using a transpiler such as Babel.
Lighthouse currently checks for Babel transforms that may be unnecessary on the modern web, such as transforming use of async and await, JavaScript classes, and other newer, yet widely supported language features.
Just over two thirds of mobile pages are shipping JavaScript resources that are being transformed, or otherwise contain unnecessary legacy JavaScript.
Transformations can add a lot of extra bytes to production JavaScript for the sake of compatibility, but unless there is a necessity to support older browsers, many of these transforms are unnecessary, and can harm startup performance. That so many pages on mobile—and 68% of pages on desktop—are shipping these transforms is concerning.
Babel is doing much to solve this problem out of the box, such as through the compiler assumptions feature, but Babel is still driven by user-defined configurations, and can only do so much in the presence of outdated configuration files.
As mentioned above, we strongly encourage developers to carefully review their Babel and Browserslist configurations to ensure that the minimum amount of transforms are applied to code in order for them to work in required browsers. Doing so can result in large reduction of bytes shipped to end users. Developers have a lot of work to do in this area, and we hope to see this figure decline over time now that the language’s evolution has relatively stabilized.
How is JavaScript used?
There’s more than one way to build a web page. While some may opt to use the web platform directly, it’s undeniable that the trend in the web developer industry is to reach for abstractions that make our work easier to do and reason about. As is the case with previous years, we’ll be exploring the role of libraries and frameworks, as well as how frequently those libraries and frameworks present security vulnerabilities that can make the web a riskier place for users.
Libraries and frameworks
Libraries and frameworks are a huge part of the developer experience—one that has the potential to harm performance through framework overhead. Though developers have largely accepted this trade-off, understanding what libraries and frameworks are commonly used on the web is extremely important, as it informs our understanding of how the web is built. In this section, we’ll be taking a look at the state of libraries and frameworks across the web in 2022.
Library usage
To understand the usage of libraries and frameworks, HTTP Archive uses Wappalyzer to detect the technologies used on a page.
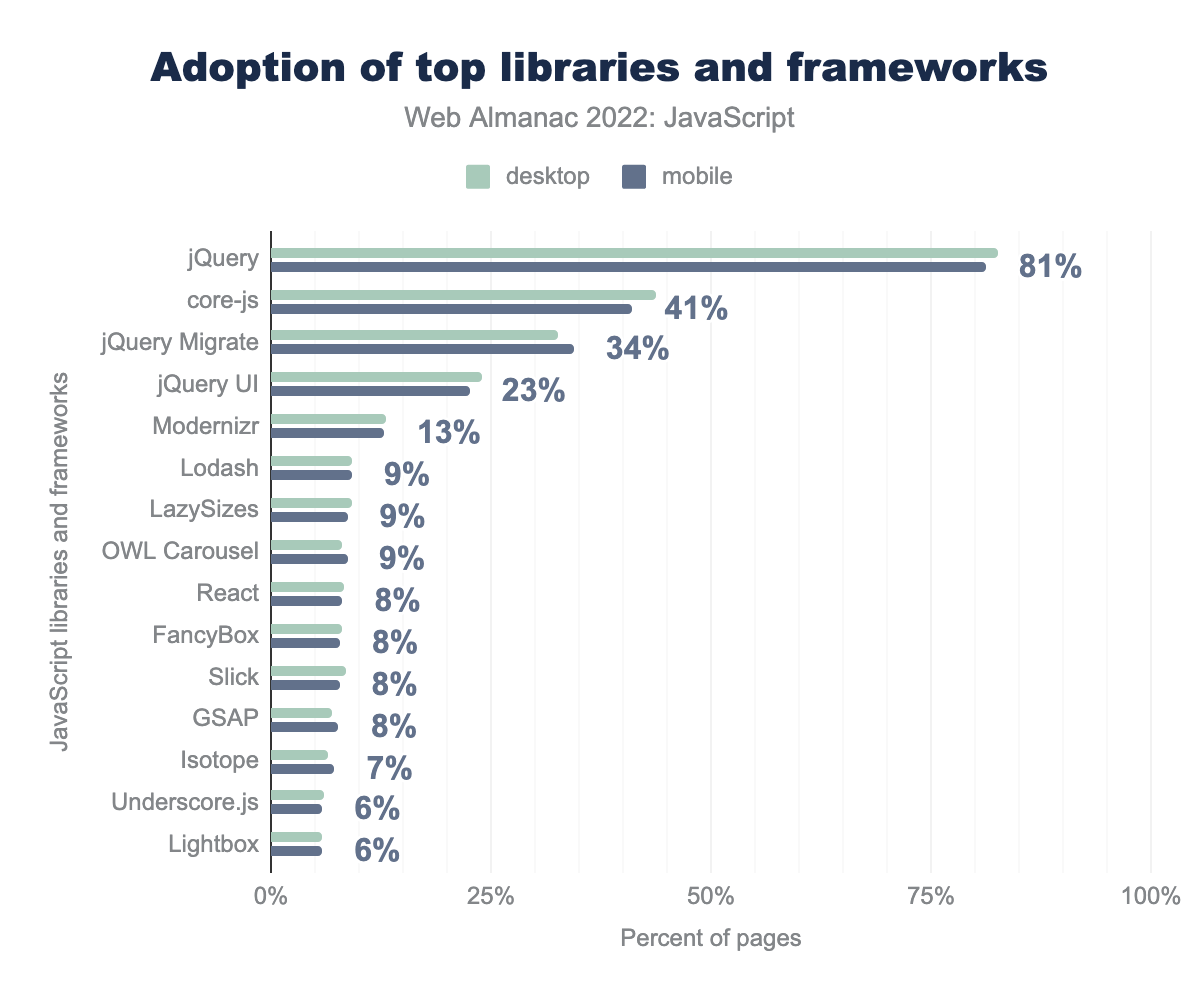
It’s still no surprise that jQuery is by far the most used library on the web today. Part of that is because WordPress is used on 35% of sites, but even so, the majority of jQuery usage occurs outside of the WordPress platform.
While jQuery is relatively small and reasonably quick at what it does, it still represents a certain amount of overhead in applications. Most of what jQuery offers is now doable with native DOM APIs, and may be unnecessary in today’s web applications.
The usage of core-js is also not surprising, as many web applications transform their code with Babel, which often uses core-js to fill in missing gaps in APIs across browsers. As browsers mature, this figure should drop—and that would be a good thing indeed, as modern browsers are more capable than ever, and shipping core-js code could end up being wasted bytes.
React usage notably remained the same from last year at 8%, which may be a signal that adoption of the library has plateaued due to an increasing amount of choices in the JavaScript ecosystem.
Libraries used together
It’s not an uncommon scenario to see multiple frameworks and libraries used on the same page. As with last year, we’ll examine this phenomenon to gain insight into how many libraries and frameworks have been used together in 2022.
| Libraries | Desktop | Mobile |
|---|---|---|
| jQuery | 10.19% | 10.33% |
| jQuery, jQuery Migrate | 4.30% | 4.94% |
| core-js, jQuery, jQuery Migrate | 2.48% | 2.80% |
| core-js, jQuery | 2.78% | 2.74% |
| jQuery, jQuery UI | 2.40% | 2.07% |
| core-js, jQuery, jQuery Migrate, jQuery UI | 1.18% | 1.36% |
| jQuery, jQuery Migrate, jQuery UI | 0.88% | 0.99% |
| GSAP, Lodash, Polyfill, React | 0.48% | 0.93% |
| Modernizr, jQuery | 0.87% | 0.86% |
| core-js | 0.92% | 0.85% |
It’s clear though that jQuery has some serious staying power, with some combination of it, its UI framework, and its migration plugin occurring in the top seven spots, with core-js having a prominent role in library usage as well.
Security vulnerabilities
Given the wide proliferation of JavaScript on today’s web, and with the advent of installable JavaScript packages, it’s no surprise that security vulnerabilities exist in the JavaScript ecosystem.
While 57% of mobile pages serving up a vulnerable JavaScript library or framework is significant, this figure is down from last year’s figure of 64%. This is encouraging, but there’s quite a bit of work to be done to lower this figure. We hope that as more security vulnerabilities are patched, developers will be incentivized to update their dependencies to avoid exposing their users to harm.
| Library or framework | Desktop | Mobile |
|---|---|---|
| jQuery | 49.12% | 48.80% |
| jQuery UI | 16.01% | 14.88% |
| Bootstrap | 11.53% | 11.19% |
| Moment.js | 4.54% | 3.91% |
| Underscore | 3.41% | 3.11% |
| Lo-Dash | 2.52% | 2.44% |
| GreenSock JS | 1.65% | 1.62% |
| Handlebars | 1.27% | 1.12% |
| AngularJS | 0.99% | 0.79% |
| Mustache | 0.44% | 0.57% |
With jQuery being the most popular library in use on the web today, it’s no surprise that it and its associated UI framework represents a fair amount of the security vulnerabilities that users are exposed to on the web today. This could likely be that some developers are still using older versions of these scripts which don’t take advantage of fixes to known vulnerabilities.
A notable entry is Bootstrap, which is a UI framework that helps developers to quickly prototype or build new layouts without using CSS directly. Given the release of newer CSS layout modes such as Grid or Flexbox, we may see usage of Bootstrap decrease over time, or in lieu of that, see developers update their Bootstrap dependencies to ship more safe and secure websites.
Regardless of what libraries and frameworks you use, be sure to regularly update your dependencies wherever possible to avoid exposing your users to harm. While package updates do result in some amount of refactoring or code fixes from time to time, the effort is worth the reduction in liability and increase in user safety.
Web components and shadow DOM
For some time, web development has been driven by a componentization model employed by numerous frameworks. The web platform has similarly evolved to provide encapsulation of logic and styling through web components and the shadow DOM. To kick off this year’s analysis, we’ll begin with custom elements.
This figure is down a bit from last year’s analysis of custom element usage on desktop pages, which was 3%. With the advantages that custom elements provide and their reasonably broad support in modern browsers, we’re hoping that the web component model will compel developers to leverage web platform built-ins to create faster user experiences.
Shadow DOM allows you to create dedicated nodes in a document that contain their own scope for sub-elements and styling, isolating a component from the main DOM tree. Compared to last year’s figure of 0.37% of all pages using shadow DOM, adoption of the feature has remained much the same, with 0.39% of mobile pages and 0.47% of desktop pages using it.
The template element helps developers reuse markup patterns. Their contents render only when referenced by JavaScript. Templates work well with web components, as the content that is not yet referenced by JavaScript is then appended to a shadow root using the shadow DOM.
Roughly 0.05% of web pages on both desktop and mobile are currently using the template element. Though templates are well supported in browsers, their adoption is currently scant.
is attribute.
The HTML is attribute is an alternate way of inserting custom elements into the page. Rather than using the custom element’s name as the HTML tag, the name is passed to any standard HTML element, which implements the web component logic. The is attribute is a way to use web components that can still fall back to standard HTML element behavior if web components fail to be registered on the page.
This is the first year we are tracking usage of this attribute, and unsurprisingly, its adoption is lower than custom elements themselves. Due to the lack of support in Safari, this means that browsers on iOS and Safari on macOS can’t make use of the attribute, possibly contributing to the attribute’s limited usage.
Conclusion
The state of JavaScript is largely continuing the way trends would have suggested last year. We’re shipping more of it, for sure, but we’re also trying to mitigate the ill effects of excessive JavaScript through increased usage of techniques such as minification, resource hints, compression, and even down to the libraries we use.
The state of JavaScript is a constantly evolving phenomenon. It’s clear that we have an increased reliance on it more than ever, but that spells trouble for the collective user experience of the web. We need to do all we can—and more—to stem the tide of how much JavaScript we ship on production websites.
As the web platform matures, we’re hoping that we see increased direct adoption of its various APIs and features where it makes sense to do so. For those experiences that require frameworks for a better developer experience, we’re hoping to see additional optimizations and opportunities for framework authors to adopt new APIs to help them deliver on both a better developer experience and better experiences for users.
Let’s hope that next year signals a shift in the trend. In the meantime, let’s continue to do all we can to make the web as fast as we possibly can, while keeping an eye on both lab and field data along the way.
