Markup
Introduction
As the 2020 chapter said, without HTML there are no web pages, no web sites, no web apps. You can say that without HTML, there’s no Web. That makes HTML one of the most important web standards, if not the most important web standard.
Accordingly, like every year, we used the millions of pages in our data set—7.9 million in the mobile set, 5.4 million in the desktop set, with overlap—to also look at HTML. This chapter doesn’t cover “everything” there is about HTML, so we explicitly encourage you to also analyze the data we gathered and to share your own conclusions—and when you do, tag them: #htmlalmanac.
Document data
There’s much to be curious about when it comes to how we write HTML. We can ask lots of questions, but when it comes to HTML in general, let’s have a look at how our HTML is sent to our browsers, before we even get into the contents of the markup itself.
Doctypes
| Doctype | Desktop | Mobile |
|---|---|---|
html |
88.1% | 90.0% |
html -//w3c//dtd xhtml 1.0 transitional//en http://www.w3.org/tr/xhtml1/dtd/xhtml1-transitional.dtd |
4.7% | 3.9% |
| No doctype | 3.0% | 2.7% |
html -//w3c//dtd xhtml 1.0 strict//en http://www.w3.org/tr/xhtml1/dtd/xhtml1-strict.dtd |
1.2% | 1.1% |
html -//w3c//dtd html 4.01 transitional//en http://www.w3.org/tr/html4/loose.dtd |
0.9% | 0.6% |
html -//w3c//dtd html 4.01 transitional//en |
0.4% | 0.4% |
Let’s start with doctypes—which one is the most popular? But you know the answer to this one: It’s the short, simple, boring standard HTML doctype, that is, <!DOCTYPE html>.
90% of all mobile pages use it—as the mobile data set is largest, this chapter will usually work with that data. Next most popular is XHTML 1.0 Transitional (3.9%, down from 4.6% in 2021). After that it’s no doctype being set at all at 2.7%, up from 2.5% last year.
Compression
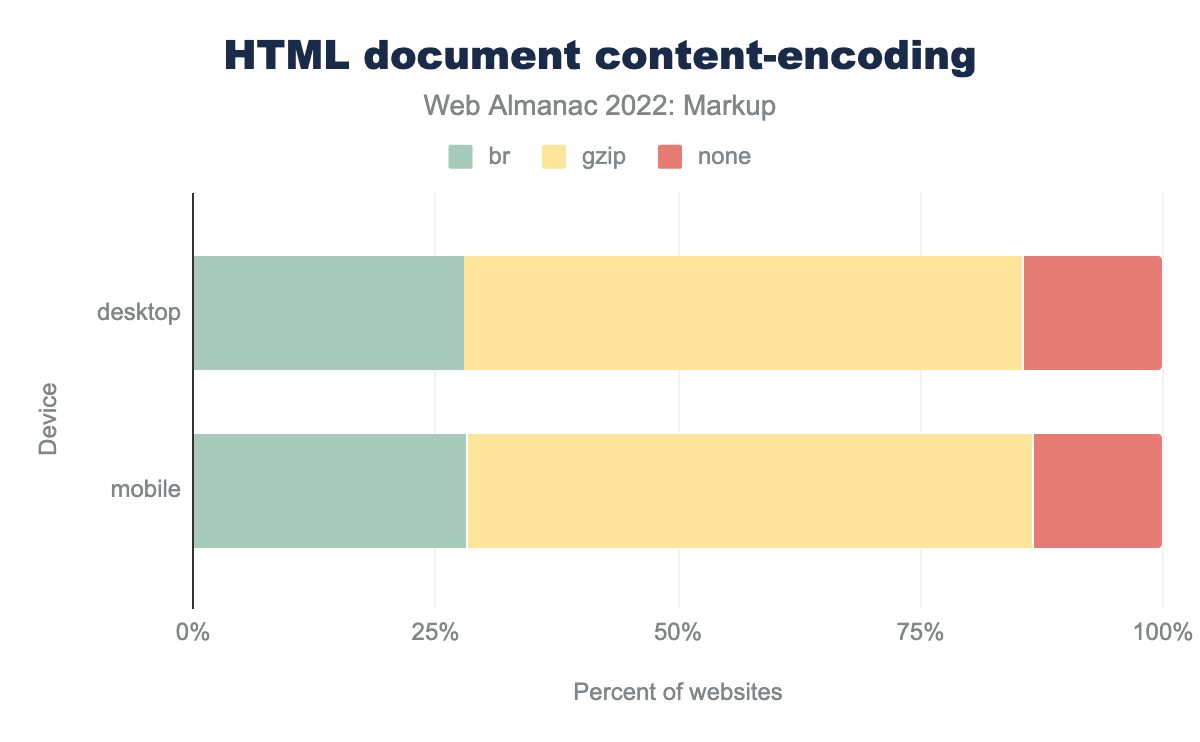
Are HTML documents being compressed? How many? How? 86% of them are—with 58% (down 5.8% since last year) overall being gzip-compressed, and 28% (up 6.1%) being compressed using Brotli. Overall, slightly more documents are being compressed, and compressed more effectively.
Languages
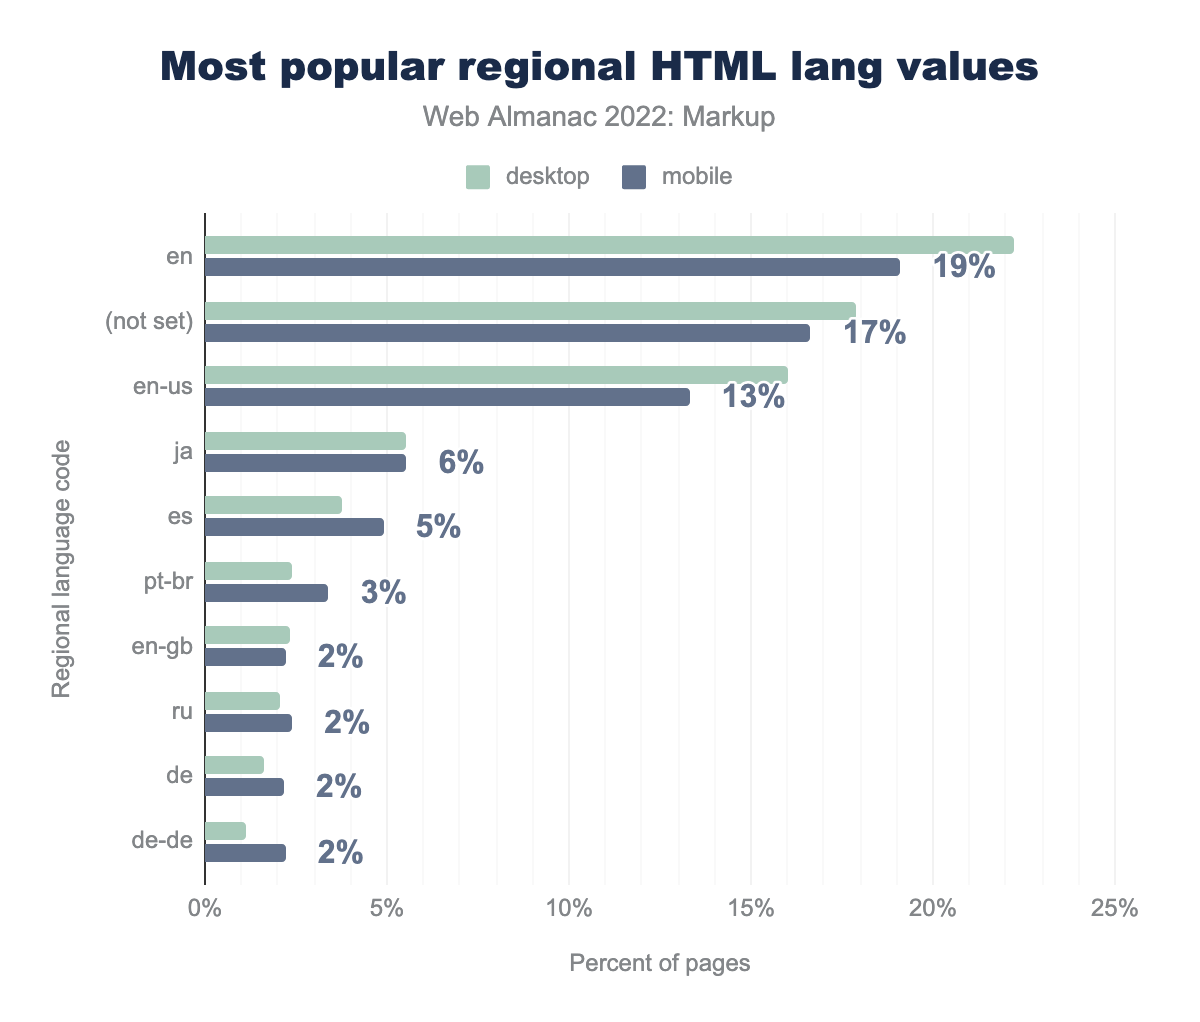
en is the language set on 22% of desktop and 19% of mobile pages, (not set) on 18% and 17% respectively, en-us on 16% and 13%, ja on 6% and 6%, es on 4% and 5%, pt-br on 2% and 3%, en-gb on 2% and 2%, ru on 2% and 2%, de on 2% and 2%, and de-de on 1% of desktop and 2% of mobile pages..What about languages? In our data set, 35% of pages used a lang attribute mapping to English; 17% had no language set; and you already see the difficulties—the sample is likely biased and also not as big as to reflect all of the world, and no lang attribute being used is not equaling no language being set so, this isn’t something our data would be useful for.
Conformance
Do documents conform with the HTML specification—i.e., are they valid? A quick way for you to tell is by using a tool like the W3C markup validation service.
We didn’t and we couldn’t check this yet. So why include this section?
The reason to at least mention conformance is that if you don’t check on conformance, if you don’t validate, there’s a good chance—in practice, effectively a 100% chance—you end up writing at least some fictitious and fantasy (and therefore wrong) HTML. But HTML isn’t fiction or fantasy—it’s a hard technical standard with clear rules on what works and what doesn’t.
For a professional, it’s good to know these rules. It’s good work to produce code that works and that doesn’t contain anything superfluous, too. And both of that—learning and not shipping anything non-working or superfluous—is why conformance matters, and why validation matters.
We don’t have conformance data to share in the Web Almanac yet, but that doesn’t mean the point is any less important. And if you haven’t focused on conformance yet—start validating your HTML output. Maybe one of the next editions of the Web Almanac will have some positive news to share because of you.
Document size
HTML payload and document size are a staple in this series—we’ve looked at this information since 2019. But the trend is clear, and while it follows a common theme that other chapters will confirm, too, it’s not a great one:
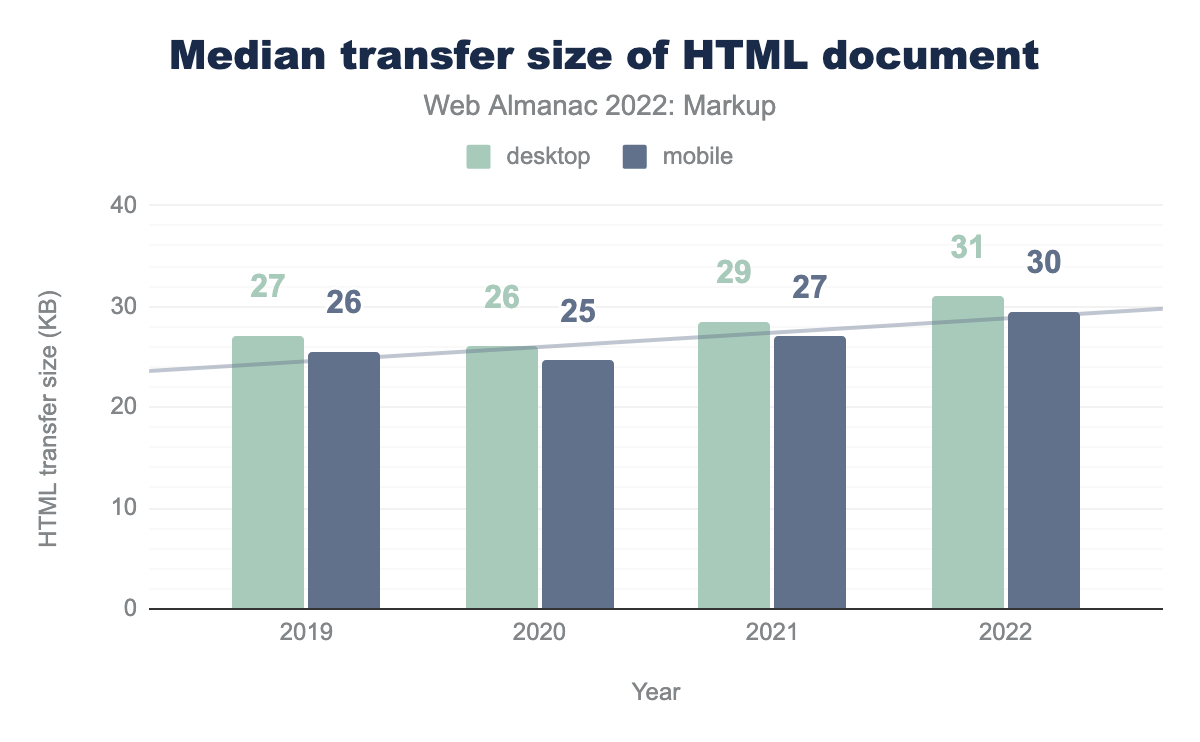
After some brief relief in 2020, document size has continued growing in 2021, and again in 2022, with a median transfer size of 30 kB in our mobile data set.
One way to counter this trend is to write HTML, the HTML way (and not the XHTML way), as that would already result in smaller HTML transfer size. Disclosure: Your author here likes to come up with HTML writing classifications, and enjoys promoting minimal HTML.
Elements
If you’re not including the svg and math elements—because they’re specified outside of HTML—the current HTML specification currently consists of 111 elements.
What can we observe?
Element diversity
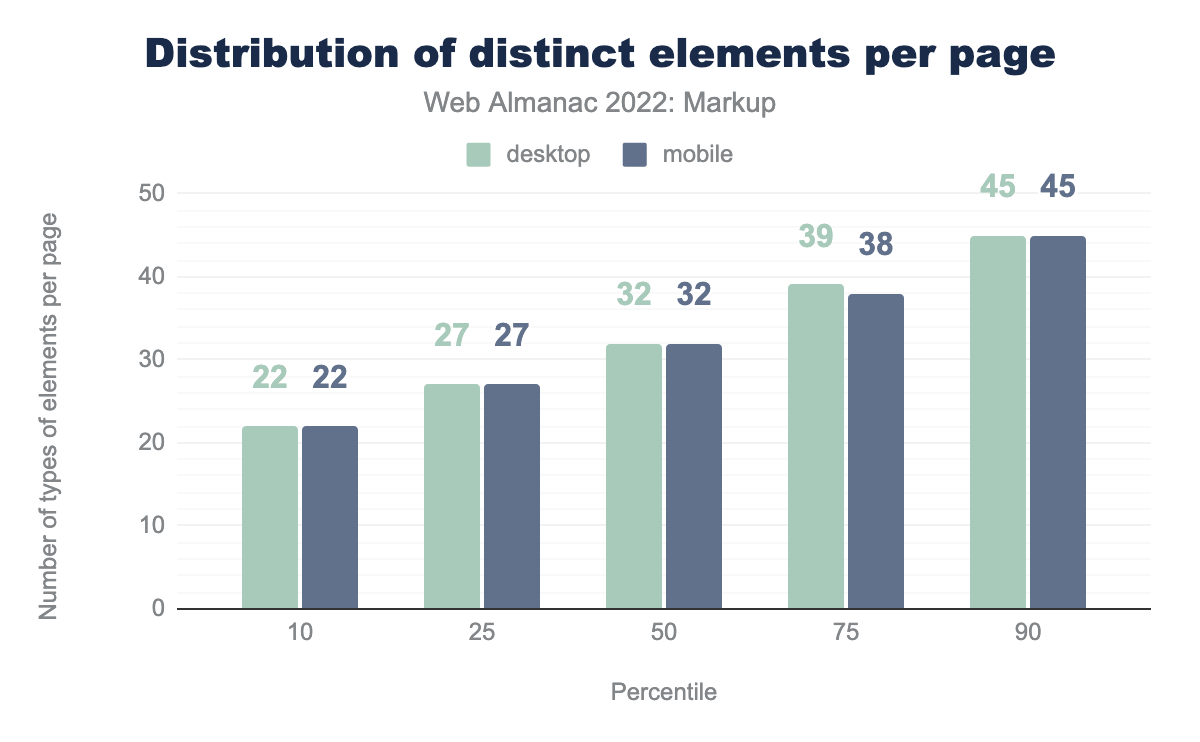
The first thing we can note is that developers use slightly more different elements per page now, with a median of 32 different elements per document.
The median is up from 31 elements in 2021, and 30 elements in 2020. As this is a trend throughout, it may be a tender sign that developers put HTML elements to better use, by using more of them for what they’re there for.
Alas, there’s another trend which aligns with an increasing document size, and that’s a growing number of elements per page in total:
The median is currently at 653 elements per page, up from 616 in 2021, and 587 in 2020—all per the respective mobile data set. Do we publish more content, requiring more elements to hold them (something like, more paragraphs per text, more p elements)? Or is this just another sign of an unchecked div pandemic? Our data doesn’t answer this but it is probably due to both—and more—reasons.
Top elements
The following elements are used most frequently:
| 2019 | 2020 | 2021 | 2022 |
|---|---|---|---|
div |
div |
div |
div |
a |
a |
a |
a |
span |
span |
span |
span |
li |
li |
li |
li |
img |
img |
img |
img |
script |
script |
script |
script |
p |
p |
p |
p |
option |
link |
link |
link |
i |
meta |
i |
|
option |
i |
meta |
The div element is—by far—the most popular element: We found 2,123,819,193 occurrences in the mobile data set, and 1,522,017,185 of them in our desktop data set.
div elements.
Divitis is real.
If you wonder about the odd one out, the i element, it stands to reason that this is still largely due to Font Awesome and its arguable misuse of this element. The element has also a bad reputation because during XHTML times, everyone suggested to use em instead—but that advice wasn’t sound, and i elements have their use cases.
When it comes to what elements are being used on the most documents, the list looks a little different:
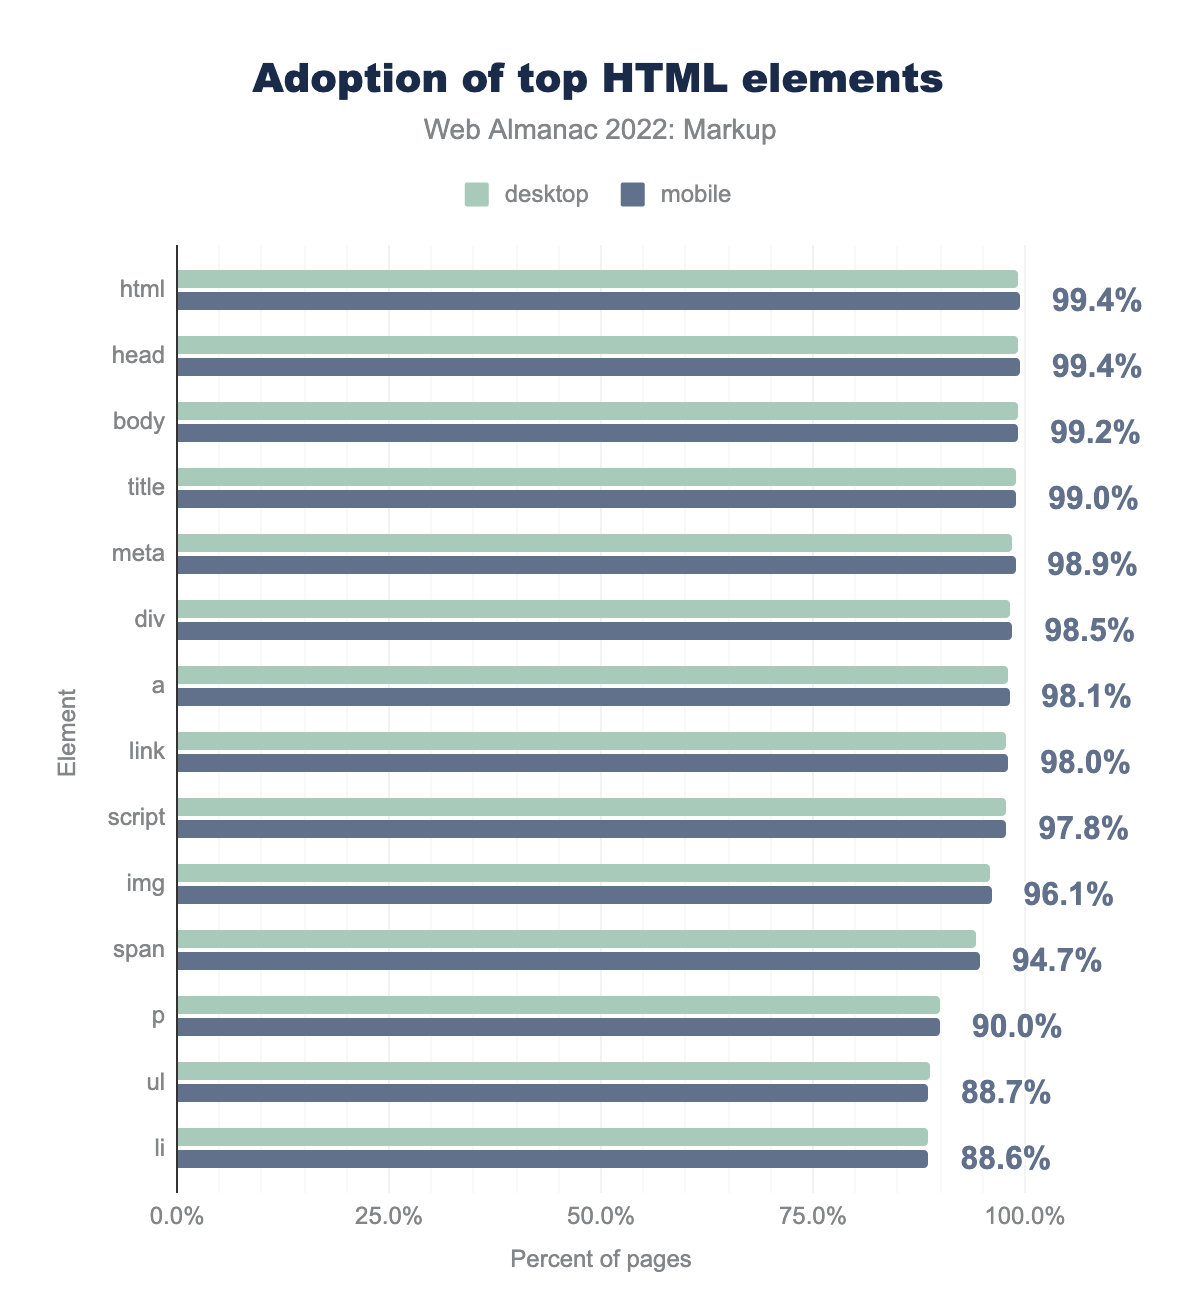
html is used on 99.3% of desktop and 99.4% of mobile page, head on 99.3% and 99.4% respectively, body on 99.1% and 99.2%, title on 98.9% and 99.0%, meta on 98.5% and 98.9%, div on 98.3% and 98.5%, a on 98.0% and 98.1%, link on 97.8% and 98.0%, script on 97.6% and 97.8%, img on 95.9% and 96.1%, span on 94.2% and 94.7%, p on 89.9% and 90.0%, ul on 88.8% and 88.7%, and finally li on 88.7% of desktop and 88.6% of mobile pages.It’s not a surprise that nearly every document uses html, head, or body tags—they are automatically inserted in the DOM and that is what is being counted here. That the numbers are slightly less than 100% is due to a small number of pages that break detection by overriding the JavaScript APIs we use—for example, MooTools overriding the JSON.stringify() API.
It’s a lot more surprising to miss title on 1% of all sampled documents—this element is not optional, and not being inserted in the DOM, and its omission an indicator for lack of conformance checking.
The elements that then follow are old friends—especially a, img, and meta have been popular elements ever since Ian Hickson’s seminal HTML study back in 2005.
What’s the least used HTML element that’s part of the current standard, you ask? That’s samp, with a mere 2,002 findings in our mobile set.
Custom elements
Custom elements—elements we can loosely identify by their inner-name use of a hyphen—also made it into our samples again. This year, however, the Top 10 is entirely dominated by Slider Revolution:
| Custom element | Desktop | Mobile |
|---|---|---|
rs-module-wrap |
2.1% | 2.3% |
rs-module |
2.1% | 2.3% |
rs-slides |
2.1% | 2.3% |
rs-slide |
2.1% | 2.3% |
rs-sbg-wrap |
2.0% | 2.2% |
rs-sbg-px |
2.0% | 2.2% |
rs-sbg |
2.0% | 2.2% |
rs-progress |
2.0% | 2.2% |
rs-layer |
1.8% | 2.0% |
rs-mask-wrap |
1.8% | 2.0% |
That’s impressive—but gives us little to work with other than saying that Slider Revolution is used on roughly 2% of all sampled pages.
What are the next popular custom elements that are not part of Slider Revolution?
| Custom element | Desktop | Mobile |
|---|---|---|
pages-css |
1.1% | 2.0% |
wix-image |
1.1% | 2.0% |
router-outlet |
0.7% | 0.5% |
wix-iframe |
0.4% | 0.7% |
ss3-loader |
0.5% | 0.5% |
rs-.
This is more diverse: pages-css, wix-image and wix-iframe come from the Wix website builder. router-outlet originates in Angular. And ss3-loader seems to be related to Smart Slider.
Obsolete elements
Are obsolete elements still a thing? Given that not-validating is still a thing, yes.
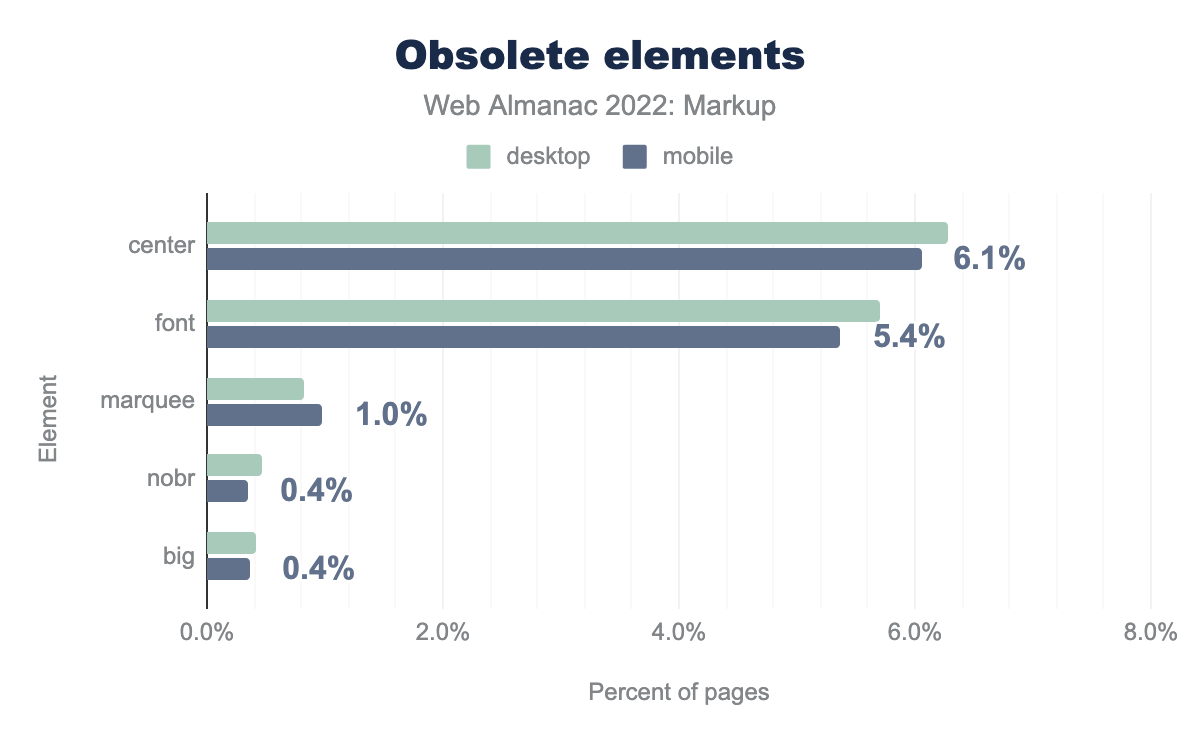
center is used on 6.3% of desktop and 6.1% of mobile pages, font is used on 5.7% and 5.4% pages respectively, marquee on 0.8% and 1.0%, nobr on 0.5% and 0.4%, and finally big 0.4% of desktop and mobile pages.On 6.1% of pages, you still find center elements (hi Google home page), and on 5.4% of pages, you find font elements. Use of both elements went down (down 0.5% in both cases), fortunately, while marquee, nobr, and big didn’t witness significant changes.
center and font make for the lion’s share (81.2%) of all obsolete elements, per our analysis:
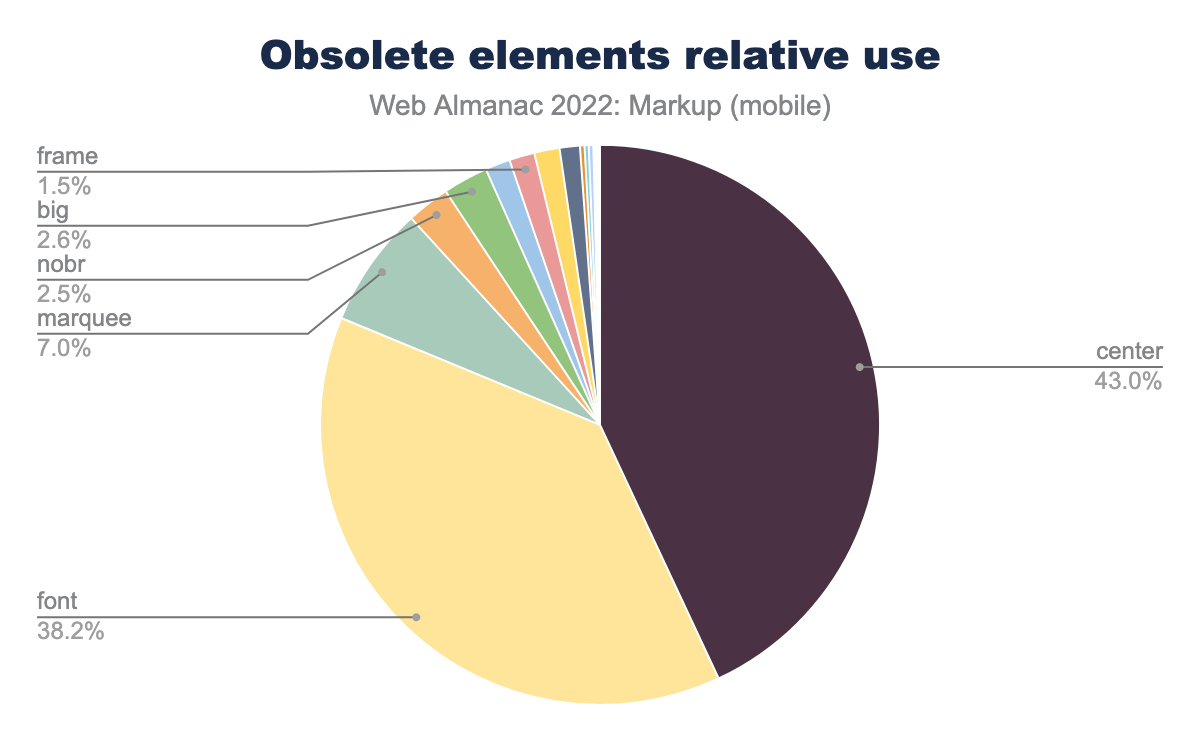
center is 43.0% of obsolete element usage on mobile, font is 38.2%, marquee is 7.0%, nobr 2.6%, big 2.6%, frame 1.5% and the rest of the pie is made up of unlabelled other elements.Attributes
If elements are the bread of HTML, then attributes are the butter. What can we learn here?
Top attributes
The most popular attribute, by far, was and still is class:
class is 34% of attribute usage on both mobile and desktop, href is 10% of usage on desktop and 9% on mobile, style is 5% on both, id is 5% on both, src is 4% on both, type is 3% on both, title is 2% on both, alt is 2% on both, rel is 2% on both, and finally value is 1% on both.This order isn’t any different from what we’ve seen last year, but there are some changes:
class(▼0.3%),href(▼0.9%),style(▼0.6%),id(▼0.2%),type(▼0.1%),title(▼0.3%), andvalue(▼0.5%) are all used a little less than before.src(▲0.3%) andalt(▲0.1%) are used more than before—tentatively good news for accessibility!relusage hasn’t changed significantly.
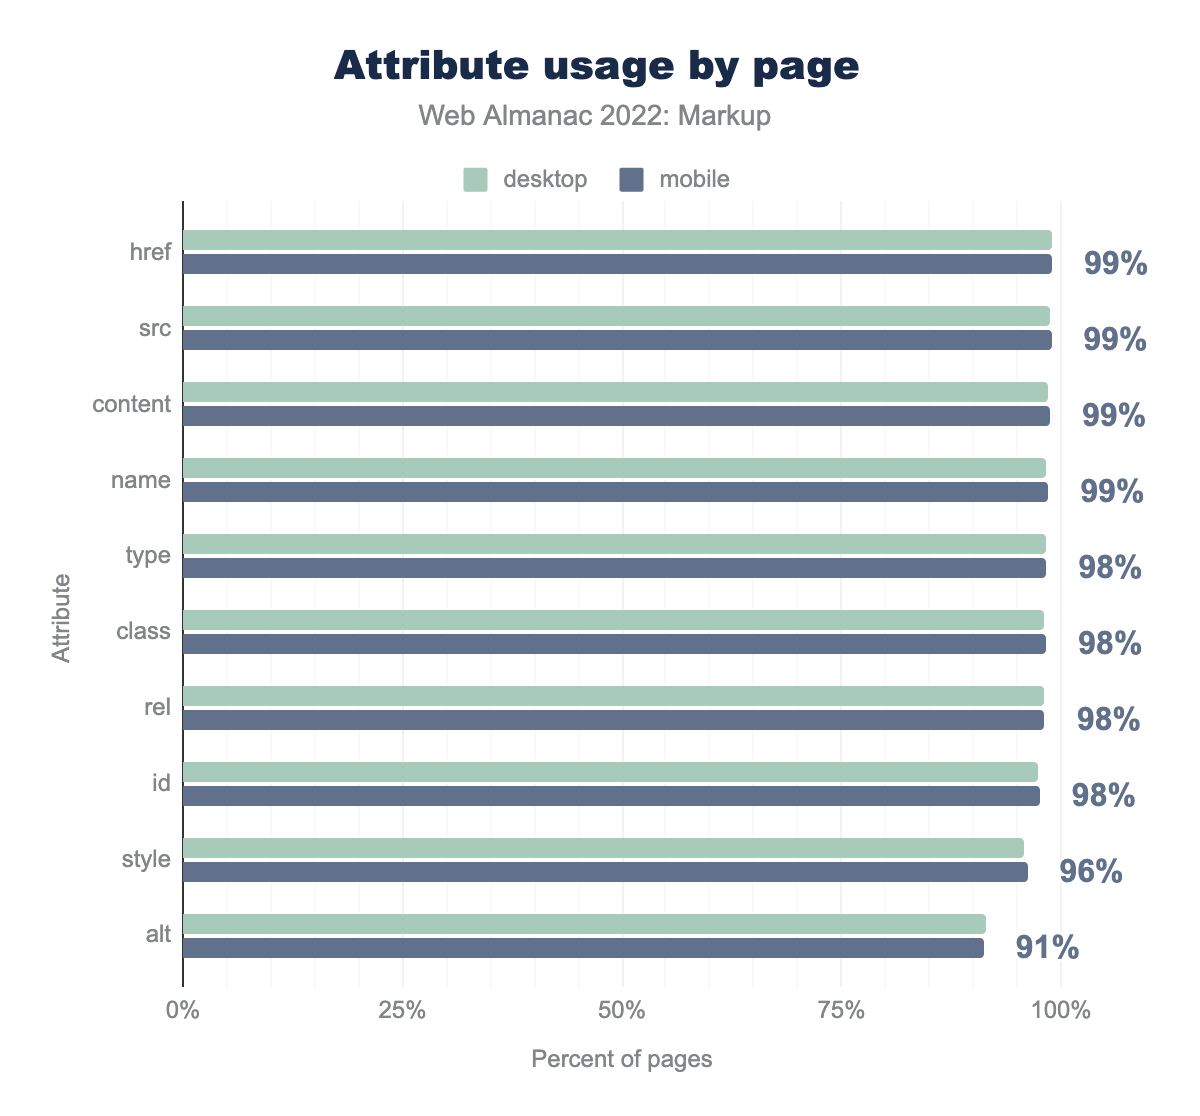
Are there attributes we find on (nearly) every document? Yes:
href is used on 99% of desktop and mobile pages, src on 99% of both, content on 98% of desktop and 99% of mobile, name on 98% and 99% respectively, type on 98% of both, class on 98% of both, rel on 98% of both, id on 97% and 98% of mobile, style on 96% of both, and finally alt is used on 91% of both.href, src, content (metadata), and name (metadata, form identifiers) are present on nearly every document in our sample.
data-* attributes
For data-* attributes—which allow authors to embed their own custom metadata—we also pulled new information.
This changed only little compared to last year’s data-* attributes stats. Here are some changes to call out:
data-idis still the most populardata-*attribute, with a 0.7% increase compared to 2021.data-element_type, though its position stayed the same, gained 0.7% as well.data-testidranked #6 before, gained 0.3%, and jumped to #4.data-widget_typeranked #8, gained 0.4% popularity, and also gained two spots, taking #6 in 2022.
data-element_type and data-widget_type relate to Elementor, while data-testid is coming from Testing Library.
Let’s have a look at how often we find data-* attributes on our pages:
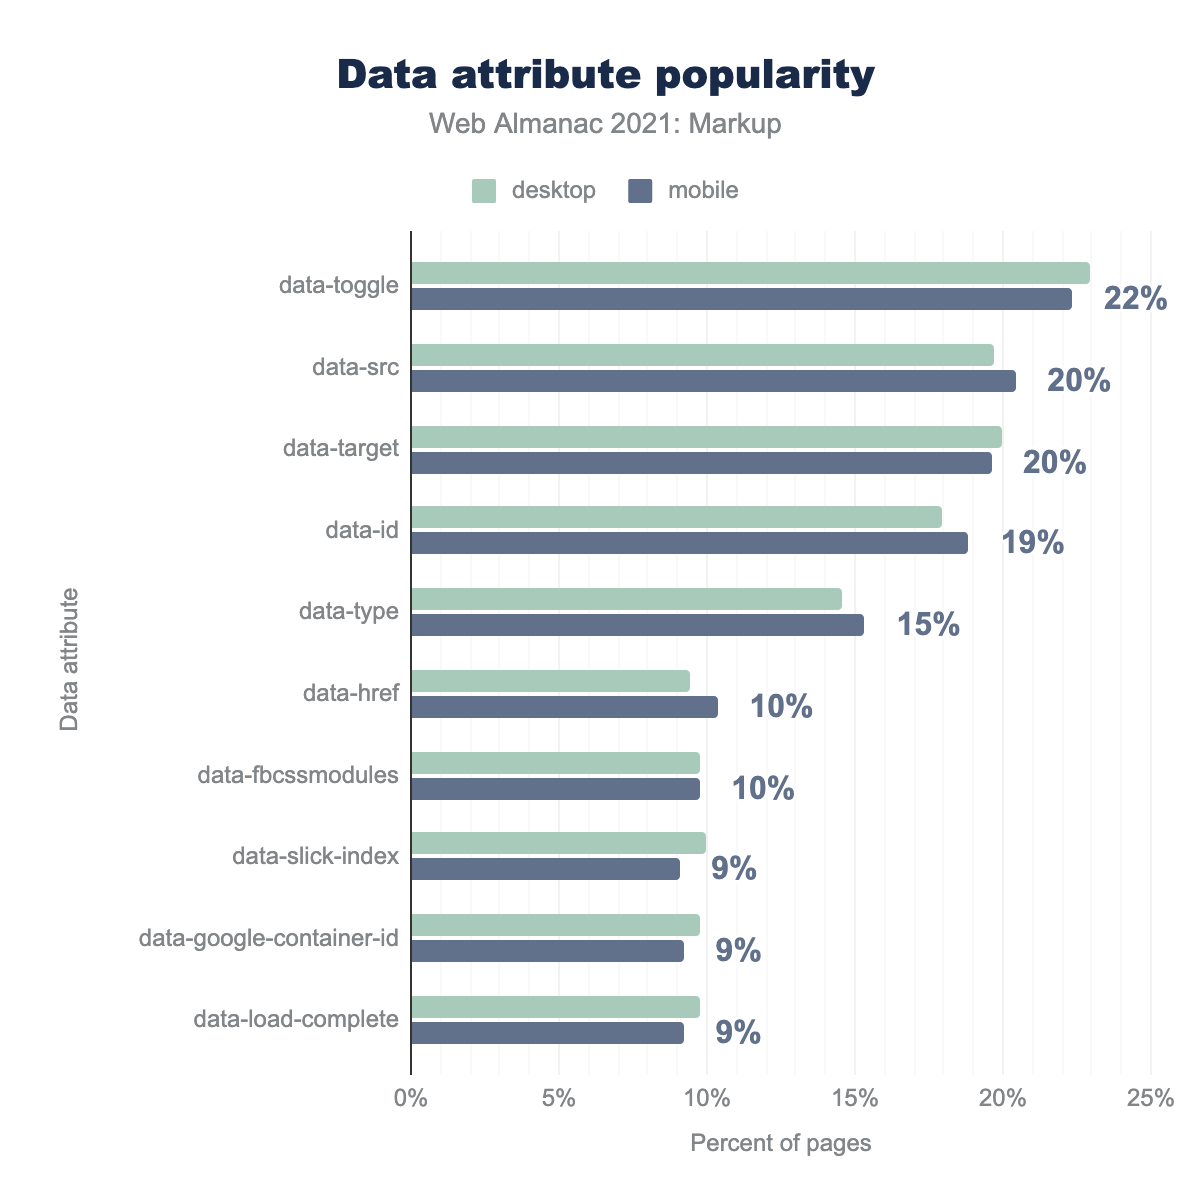
data-toggle is used on 23% of desktop and 22% of mobile pages, data-src on 20% and 20% respectively, data-target on 20% and 20%, data-id on 18% and 19%, data-type on 15% and 15%, data-href on 9% and 10%, data-fbcssmodules on 10% and 10%, data-slick-index on 10% and 9%, data-google-container-id on 10% and 9%, and finally data-load-complete is used on on 10% of mobile and 9% of desktop pages.Their popularity is high! Per the chart above close to every fourth document uses data-* attributes. But the overall data show that 88% of documents use at least one data-* attribute. That’s quite some adoption.
Social markup
Last year’s edition introduced a section on social markup, special markup which makes it easier for social platforms to identify and display the respective metadata. Here’s the 2022 update:
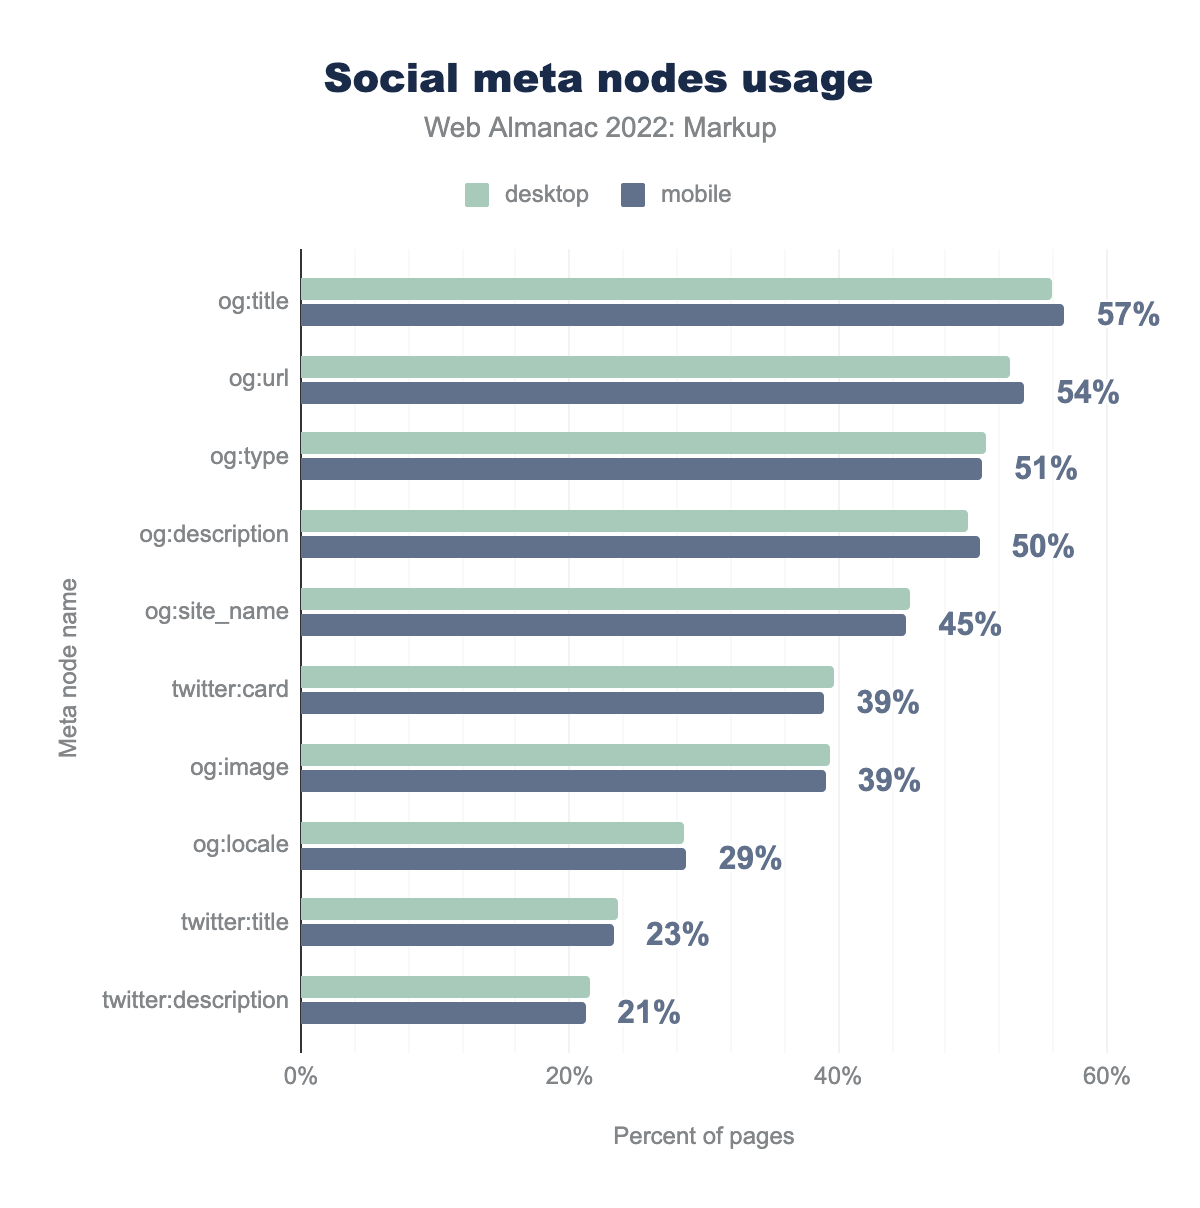
og:title is on 56% of desktop and 57% of mobile pages, og:url on 53% and 54% respectively, og:type on 51% and 51%, og:description on 50% and 50%, og:site_name on 45% and 45%, twitter:card on 40% and 39%, og:image on 39% and 39%, og:locale on 28% and 29%, twitter:title on 24% and 23%, and finally twitter:description on 21% of both.Do you need all of this metadata? That depends on your requirements. But if these requirements are about showing title, description, and image, you don’t seem to need nearly as much. You may be able to do with twitter:card, og:title, og:description (hooked up to standard description metadata), and og:image. The author and many others have described options for minimal social markup.
Conclusion
This was a glance at HTML in 2022.
The conclusion is brief: Going from year to year, it’s hard to say what important trends were started or reversed. Document size seems to keep growing—at least from 2020 to 2021 to 2022. The number of elements per page goes up every year too. There may be slightly more alt attributes now, but that’s relative to itself and we can’t tell whether more images now do have an appropriate alt attribute set—nor whether its text is really meaningful.
But with all of this, the Web Almanac will help. We’re going to look at HTML again—next year, the year after next, and the year after that. And we’ll go into more detail again and we’ll look back at more years.
What perhaps we’ll also be able to do is to look at conformance too. Not everyone may care about this at this time in our field. But we’re all professionals, and it seems at least relevant to know whether overall, we produce work that corresponds to the underlying standard(s). After all, this shouldn’t be a chapter about fantasy HTML—it should be one about HTML that actually works. It’s one of the most important web standards.
