CMS

Introduction
In this chapter, we work to understand the current state of Content Management System (CMS) ecosystems and the growing role they play in shaping users’ perception of how content can be experienced on the web. Our goal is to explore the CMS landscape in general and the characteristics of web pages created by these systems.
We believe that the CMS plays a key role in the success of our collective efforts to build a fast and resilient web. Understanding the current state, asking questions, and posing lines of inquiry for future work is our path to achieving this goal.
As a team, we’ve approached this year’s data with curiosity, and we’ve combined that curiosity with personal expertise with several of the most popular CMSs. We recommend that you read our analysis in light of the variability between CMSs and types of content on them.
What is a CMS?
The term Content Management System (CMS) refers to systems enabling individuals and organizations to create, manage, and publish content. A CMS for web content, specifically, is a system aimed at creating, managing, and publishing content to be experienced on the web.
Each CMS implements a range of content management capabilities and corresponding mechanisms for users to build websites around their content. CMSs also provide administrative capabilities to facilitate the addition and management of content.
CMSs differ widely in the approaches they offer for building sites. Some provide ready-to-use templates which are supplemented with user content, and others require user involvement for designing and constructing the site structure.
In this chapter of the Web Almanac, we tried to account for all the things that form an ecosystem around a CMS platform, including hosting providers, extension developers, development agencies, site builders, etc. For this reason, when we refer to a CMS, we usually intend both the platform itself and its surrounding ecosystem.
Our dataset, based on Wappalyzer’s definition of a CMS, identified over 270 individual CMSs. Know a CMS that’s missing? Contribute to Wappalyzer.
Some CMSs in the dataset are open source (e.g., WordPress and Joomla), and some of them are proprietary (e.g., Wix and Squarespace). Some CMSs can be used on “free” hosted or self-hosted plans, and there are also options for using these platforms on higher-tier plans up to the enterprise level.
The CMS space as a whole is a complex, federated universe of discrete but also interrelated CMS ecosystems.
CMS adoption
Our analysis throughout this work included desktop and mobile websites. The vast majority of URLs we looked at are in both datasets, but some URLs are only accessed by desktop or mobile devices. This can cause divergences in the data, so we considered desktop and mobile results separately.
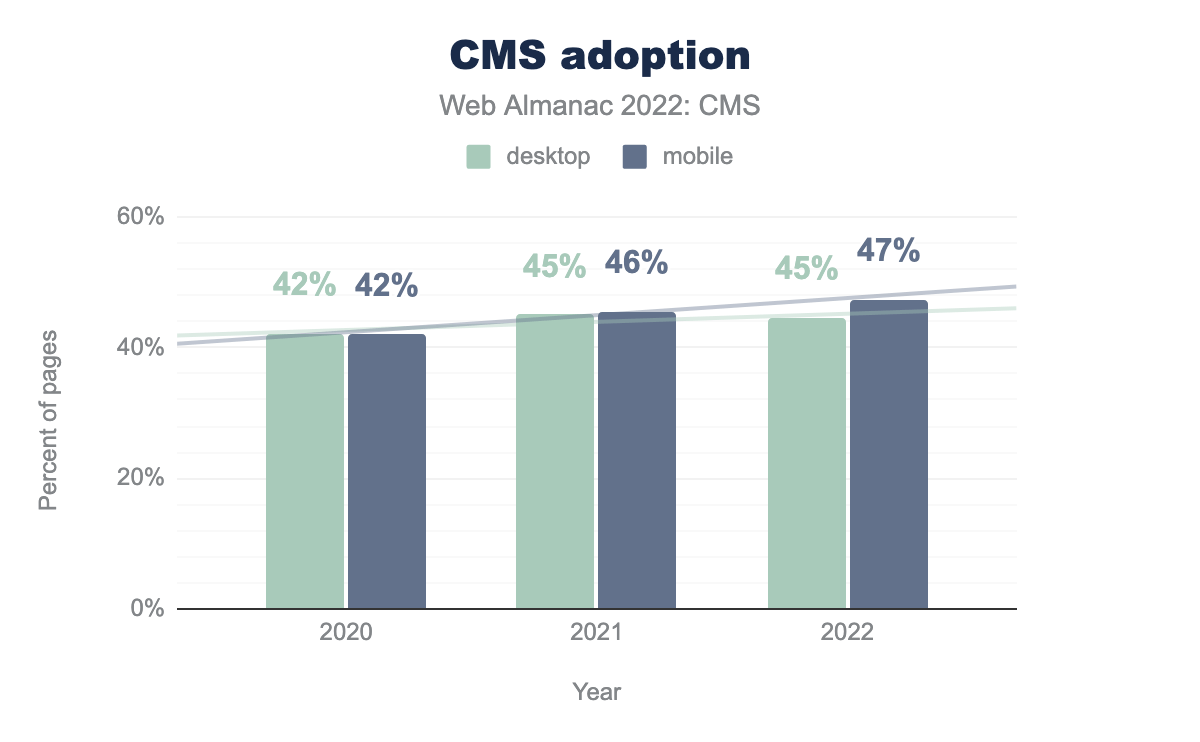
As of June 2022, 45% of the websites in the Web Almanac’s desktop dataset were powered by a CMS, indicating similar usage to 2021. The mobile dataset shows an increase from 46% in 2021 to 47% here in 2022. Looking closer at the desktop raw figures we actually see a slight drop in both absolute and percentage terms, but the drop is more likely an artifact of minor variances in attribution than an indicator of a downward trend in CMS usage. It should be noted that the number of desktop sites tracked by HTTP Archive (and the source CrUX dataset) has fallen considerably from 6.4 million sites to 5.4 million sites, while the number of mobile sites has grown by about 400,000 sites from 7.5 million to 7.9 million sites. We take this increase to reflect continued growth in mobile device usage at the expense of the desktop.
It is instructive to compare these numbers with another commonly used dataset, such as W3Techs. W3Techs reported that as of June 2021, 64.6% of websites are created using a CMS. This is up from 59.2% in June 2020–an increase of over 9%.
The deviation between our analysis and W3Techs’ analysis can be explained by differences in research methodologies and definitions of a CMS.
W3Techs’ definition is as follows: “Content Management Systems are applications for creating and managing the content of a website. We include all such systems in this category, also systems that are often classified as wikis, blog engines, discussion boards, static site generators, website editors or any type of software that provides website content.”
As we mentioned previously, Wappalyzer has a stricter definition of a CMS than we do. Wappalyzer excludes some major CMSs that appear in W3Techs reports. You can read more about our definition of a CMS on the Methodology page.
CMS adoption by geography
CMSs are used around the world, with some variance by country.
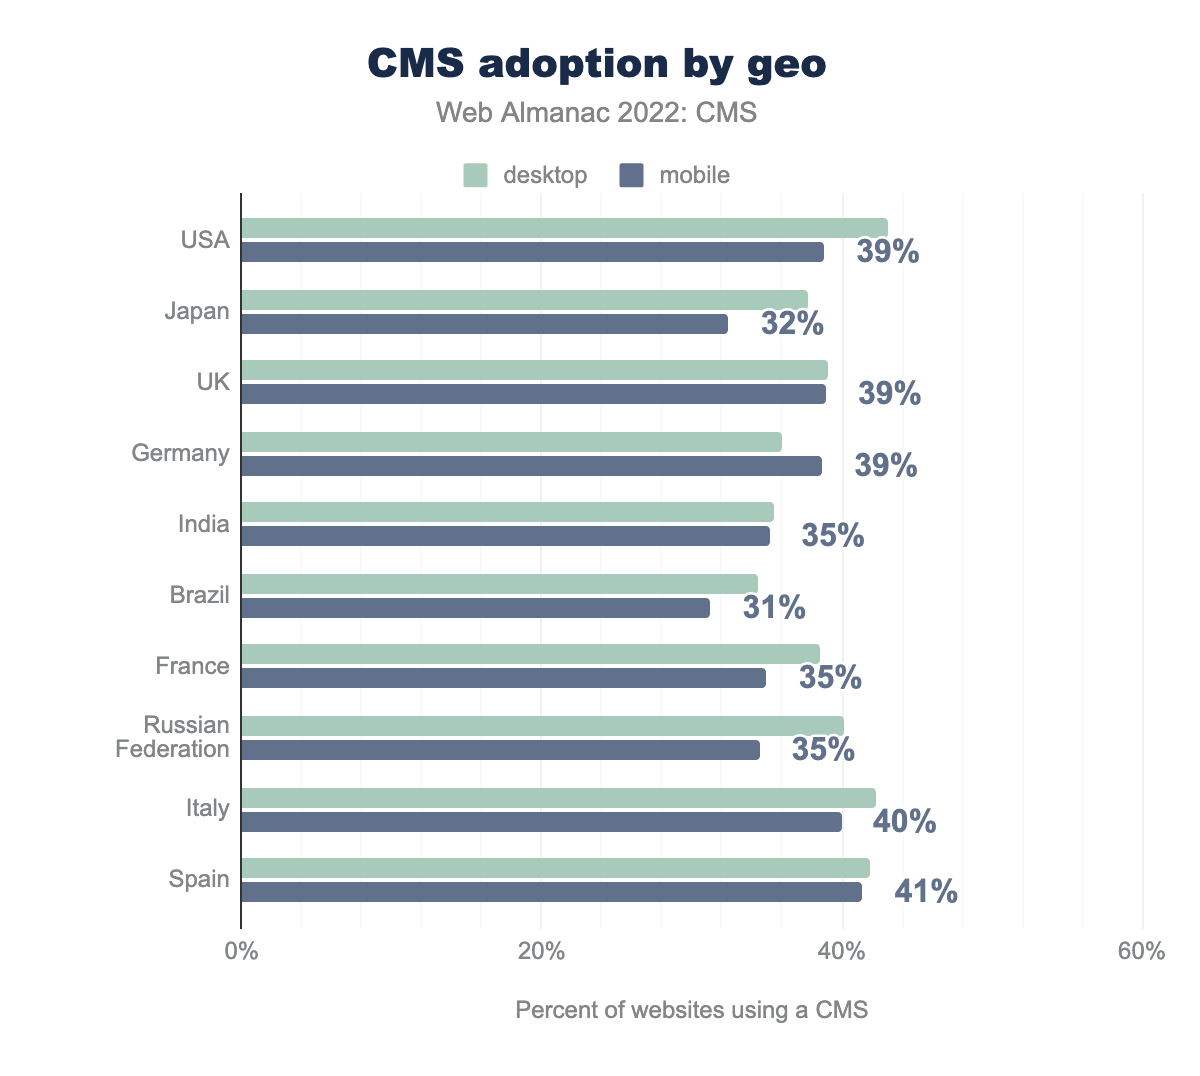
Among the countries with the highest number of websites, CMS adoption is highest in Italy and Spain where 40%–41% of mobile sites are built with a CMS. Brazil and Japan have the lowest adoption with only 31% and 32% respectively.
Of particular interest is the decrease across the board compared to our 2021 dataset when individual countries are considered. Comparing year-over-year for mobile results, all countries except India appear to show a drop, ranging from a 4% decrease for the UK and Germany to an 8% decrease for the US and Italy. Given the consistency of the decreases across geographies, it seems more plausible to be a variance in attribution than a wholesale drop in CMS adoption. We recommend evaluating this further in next year’s analysis.
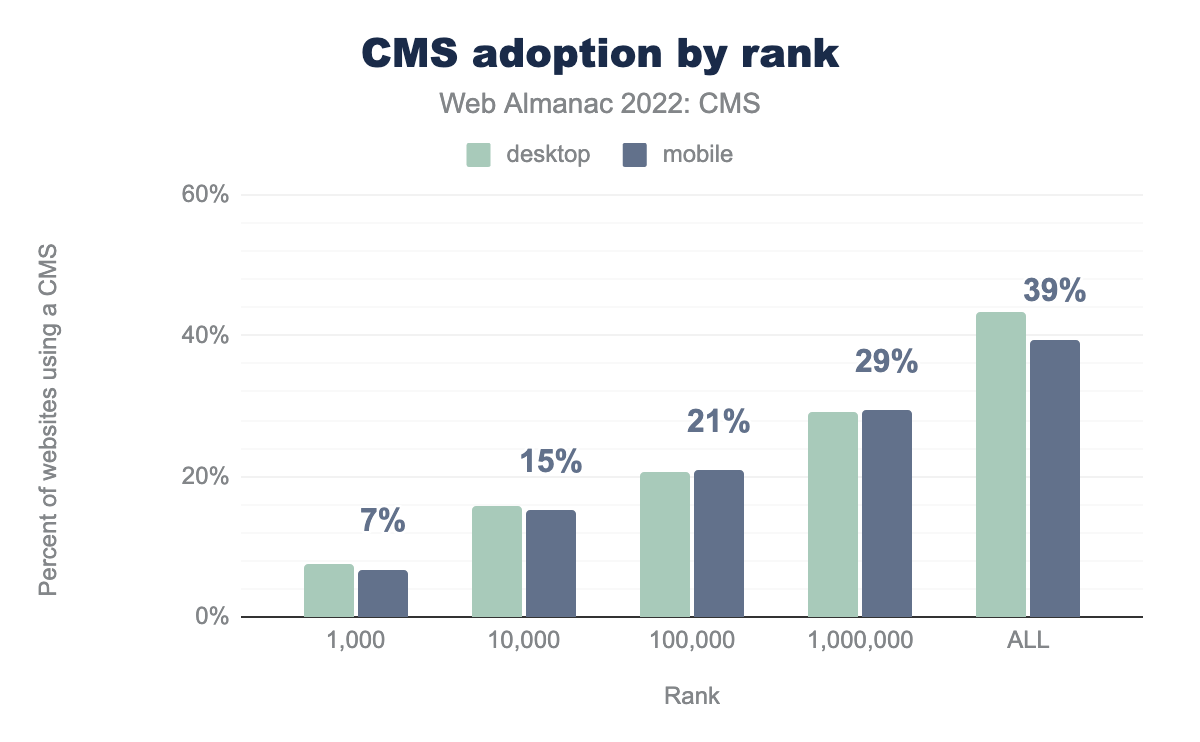
CMS adoption by rank
We examined CMS adoption by the estimated rank of the sites included within the dataset.
According to the dataset, CMSs are used by fewer than 7% of the top 1,000 websites for both desktop and mobile even though 47% of all mobile sites in the dataset use a CMS. A possible explanation for this apparent discrepancy, and the one we offered last year, is that smaller businesses with websites tend to use a popular CMS for their ease of use, and those CMSs are easily identified. However, larger businesses with higher ranked websites tend to have custom-built CMS solutions that we can’t identify.
Another explanation is that higher ranking sites with more resources allocated to their development are more likely to obfuscate the identity of their CMS for security reasons. It is improbable that more than 90% of the top 1,000 would forgo a CMS entirely and more likely that they just don’t show up in our dataset.
A potentially correlated trend is the adoption of “headless” CMSs and the move to separate content—and the CMS that powers it—from the frontend experience offered to end-users.
While our confidence in the overall dataset remains high, we’re interested in investigating the adoption-by-rank dataset further in future editions of this report to see if more can be done to detect and identify a greater number of CMSs to improve the overall accuracy of our results.
Most popular CMSs
Among all websites that use an identifiable CMS, WordPress sites account for the majority of the relative market share—with over 35% adoption on mobile—followed by Wix (2%), Joomla (1.8%), Drupal (1.6%), and Squarespace (1.0%).
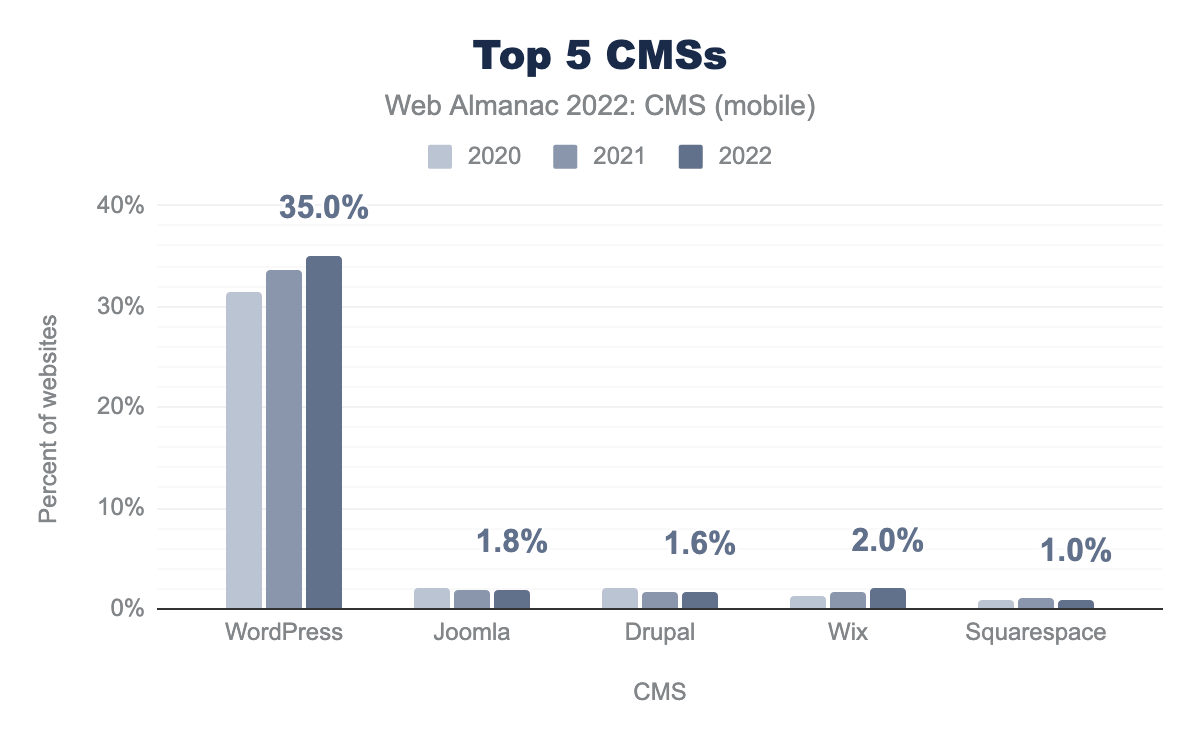
Comparing year-over-year, Drupal and Joomla continue to decline in market share, while Squarespace remains steady and Wix grows. WordPress continues its ascent, increasing 1.4% over 2021 on mobile, and 0.2% over 2021 on desktop.
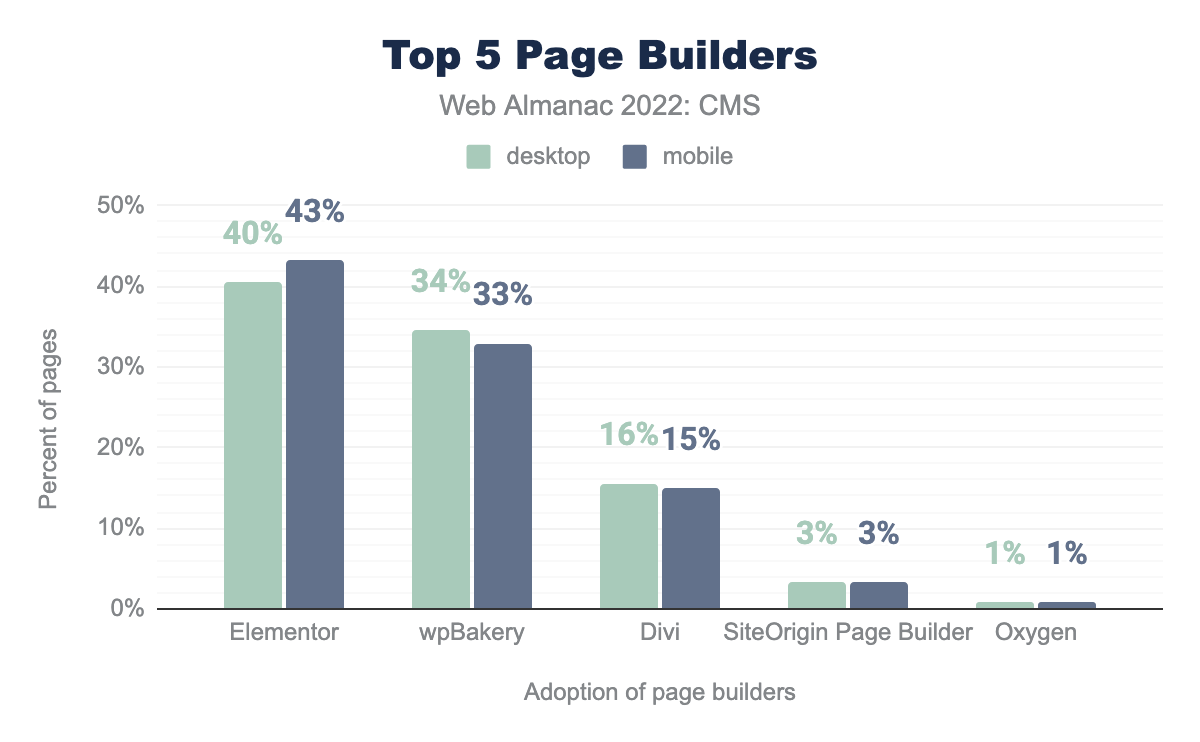
Within WordPress, users often make use of a “page builder” that provides an interface for content management. This year, with Wappalyzer’s detection methods improving, we looked at page builder adoption. We discovered that of the WordPress sites attributed to a page builder (approximately 34% of all WordPress sites in our dataset), Elementor and WP Bakery are the clear winners, with Divi, SiteOrigin, and Oxygen trailing behind.
As we see it today, page builders exert significant influence on the performance of a site. Historically, page builders have been anecdotal indicators of poor performance. As one example, our dataset indicates that it’s not uncommon for websites to have multiple page builders installed, adding a significant increase to the resources loaded by a site.
Now that we’re tracking page builder data, we’ll have the opportunity in future editions to evaluate year-over-year changes in page builder adoption and look for correlations in those changes to the overall performance of WordPress as a CMS.
CMS user experience
An important feature of CMSs is the user experience they provide for users visiting sites built on these platforms. We attempt to examine these experiences through Real User Measurements (RUM) via the Chrome User Experience Report (CrUX), and synthetic testing using Lighthouse.
Core Web Vitals
The Core Web Vitals Technology Report can be used to drill down into the available data and view the progress of evaluated platforms updated on a monthly basis.
In this section we focus on data from June 2022 to provide a consistent timeframe for data presented across the Web Almanac. We examine three important metrics provided by the Chrome User Experience Report which can shed light on our understanding of how users are experiencing CMS-powered web pages in the wild:
- Largest Contentful Paint (LCP)
- First Input Delay (FID)
- Cumulative Layout Shift (CLS)
These metrics aim to cover the technical fundamentals of a great web user experience. The Performance chapter covers these metrics in greater detail, but here we are interested in looking at them specifically in terms of CMSs.
Initially, let’s review the 10 CMS platforms with the highest number of origins and examine the percentage of sites on each platform that have a “passing” grade. A passing grade means that each of the above metrics must be in the “good” (green) range for each site: an LCP of 2.5 seconds or less, a FID of 100ms or less, and a CLS of 0.1 or less.
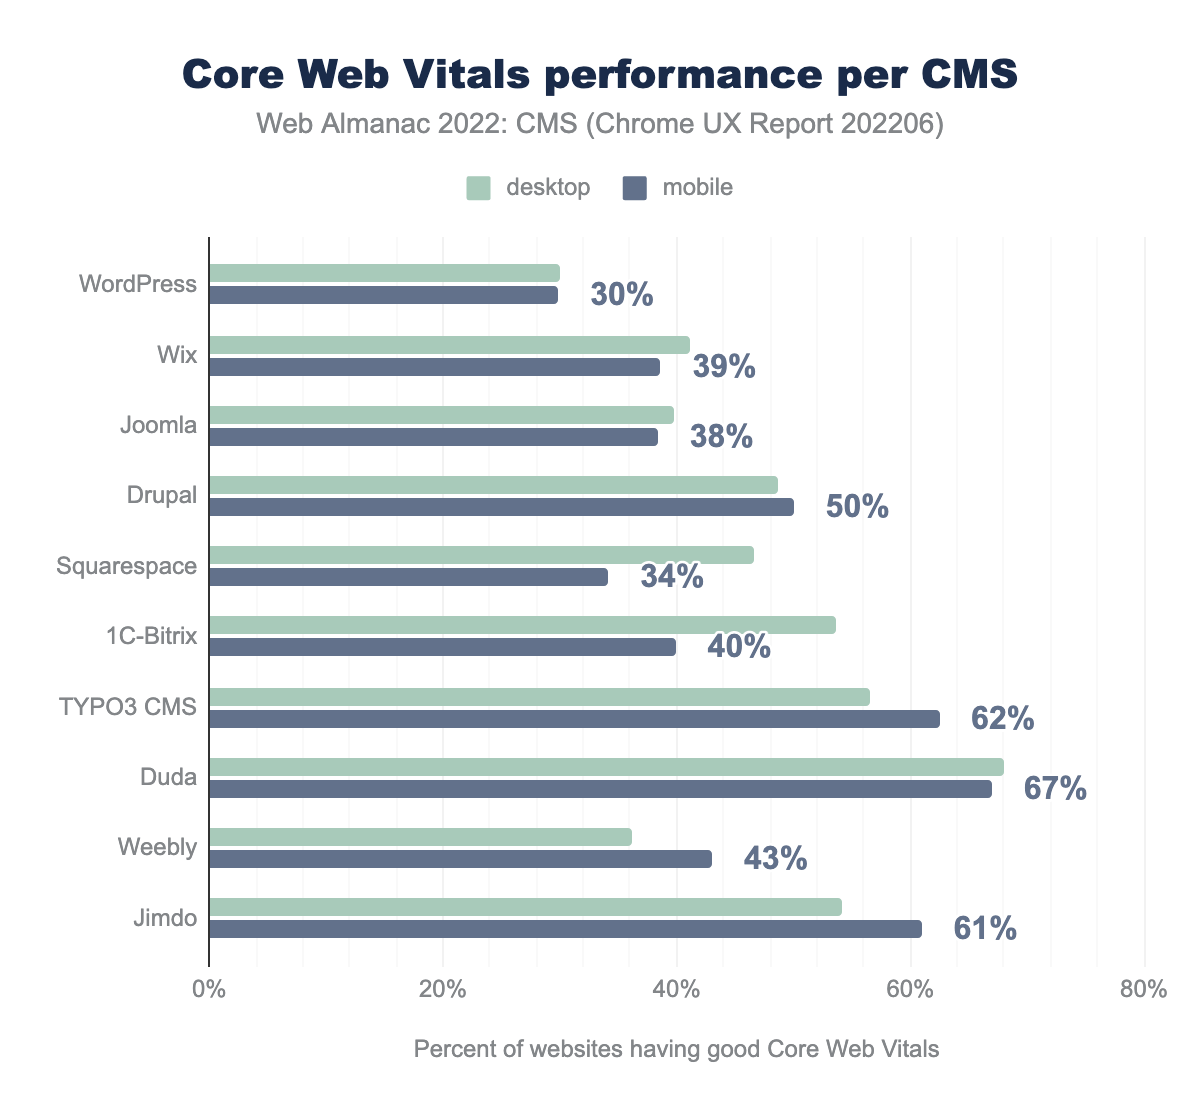
We can see that desktop visitors generally score better than mobile. This can be explained by resource limitations on mobile devices and poorer connections. The large difference between mobile and desktop performance on some platforms also suggests that very different pages are served to users depending on the device they use.
In June, for mobile devices, Duda had the largest percentage of passing sites, with 67% of mobile sites passing all three CWVs. WordPress trailed farthest behind, with 30% of its sites passing. Nevertheless, this indicates a significant increase over our 2021 data, where only 19% of WordPress sites passed.
Desktop device experience was better for most CMSs. Duda had the largest CWV passing rate at 68%. WordPress had the lowest ratio of passing sites: 30%.
We can also evaluate the progress of these CMS platforms’ performance on mobile devices by looking at last year’s data:
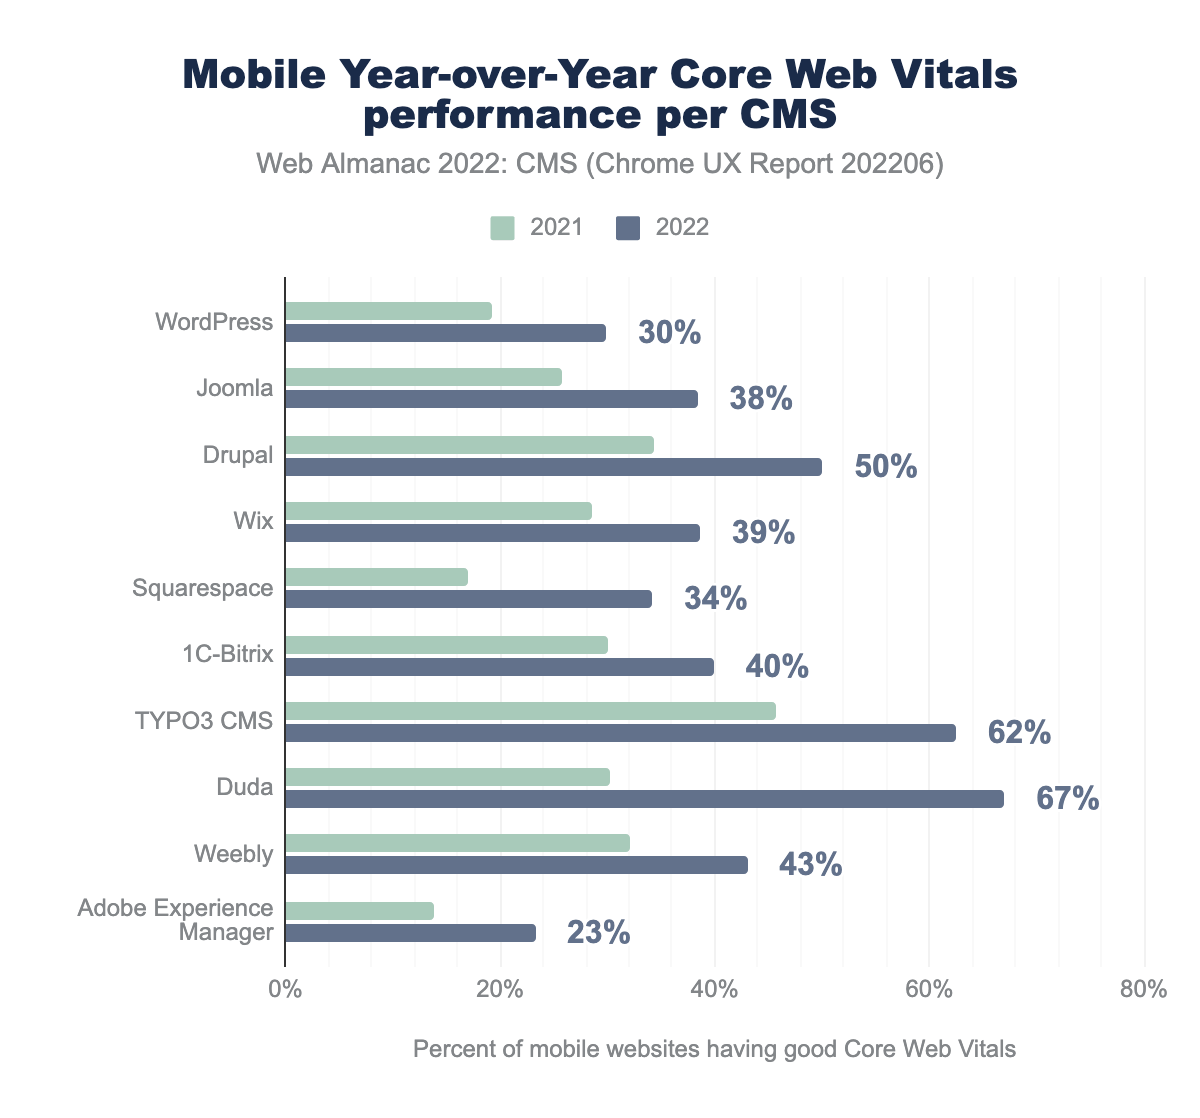
All of these CMSs showed an improvement in the percentage of origins with good CWVs since June 2021.
Let’s drill into the three Core Web Vitals to see where each platform has room to improve and which metrics improved the most since last year:
Largest Contentful Paint (LCP)
Largest Contentful Paint (LCP) measures the point in time when the page’s main content has likely loaded and thus the page is useful to the user. LCP is assessed by measuring the render time of the largest image or text block visible within the viewport.
A “good” LCP is regarded as being under 2.5 seconds.
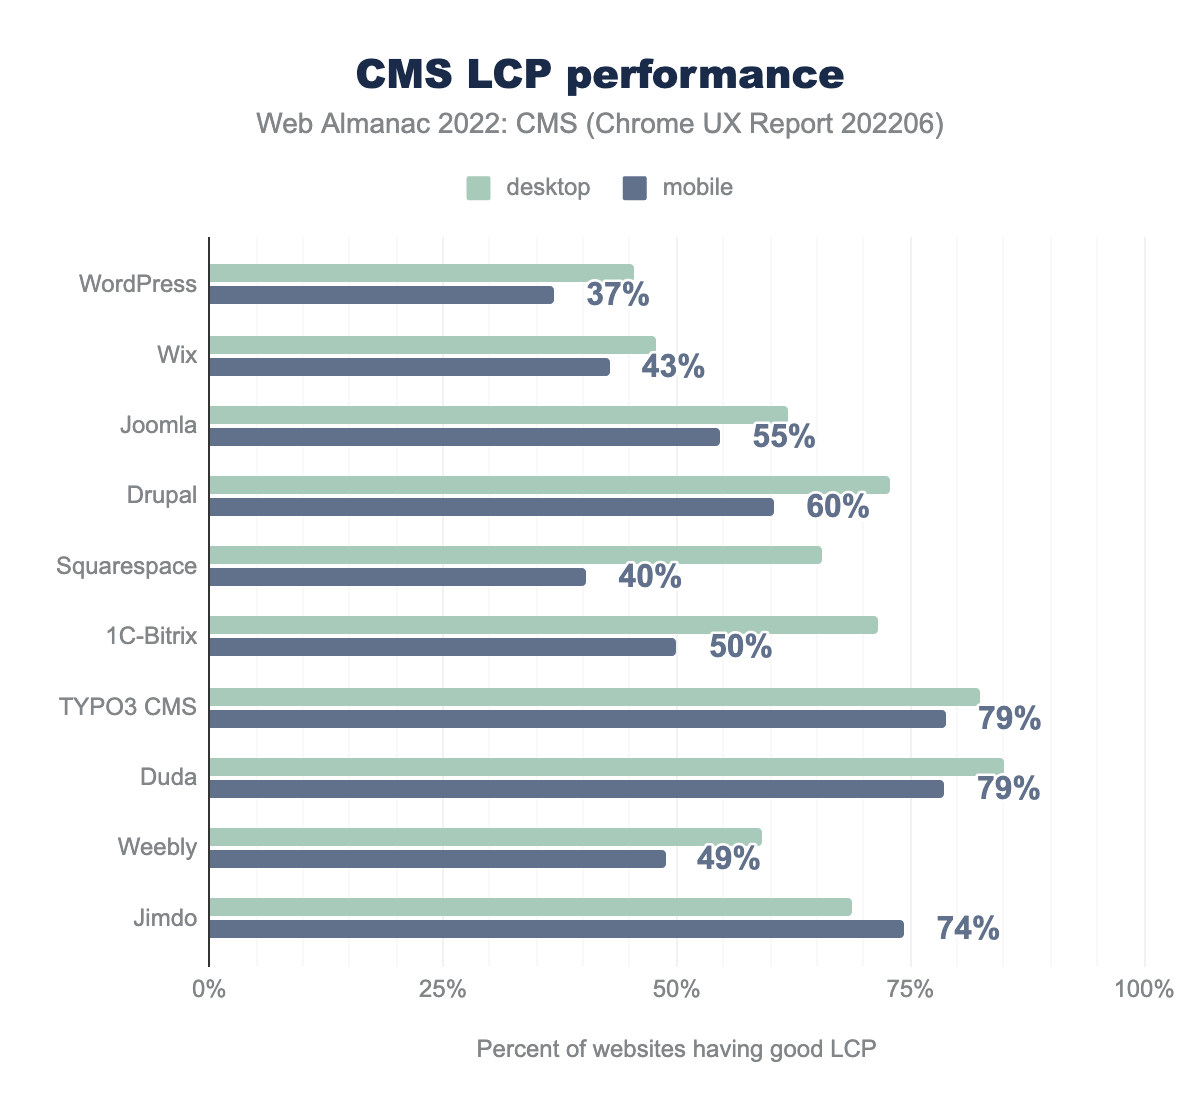
TYPO3 and Duda had the best LCP scores with 79% of origins having a “good” LCP experience. WordPress and Squarespace have the worst LCP scores with 37% and 40% of origins having good LCP scores, respectively.
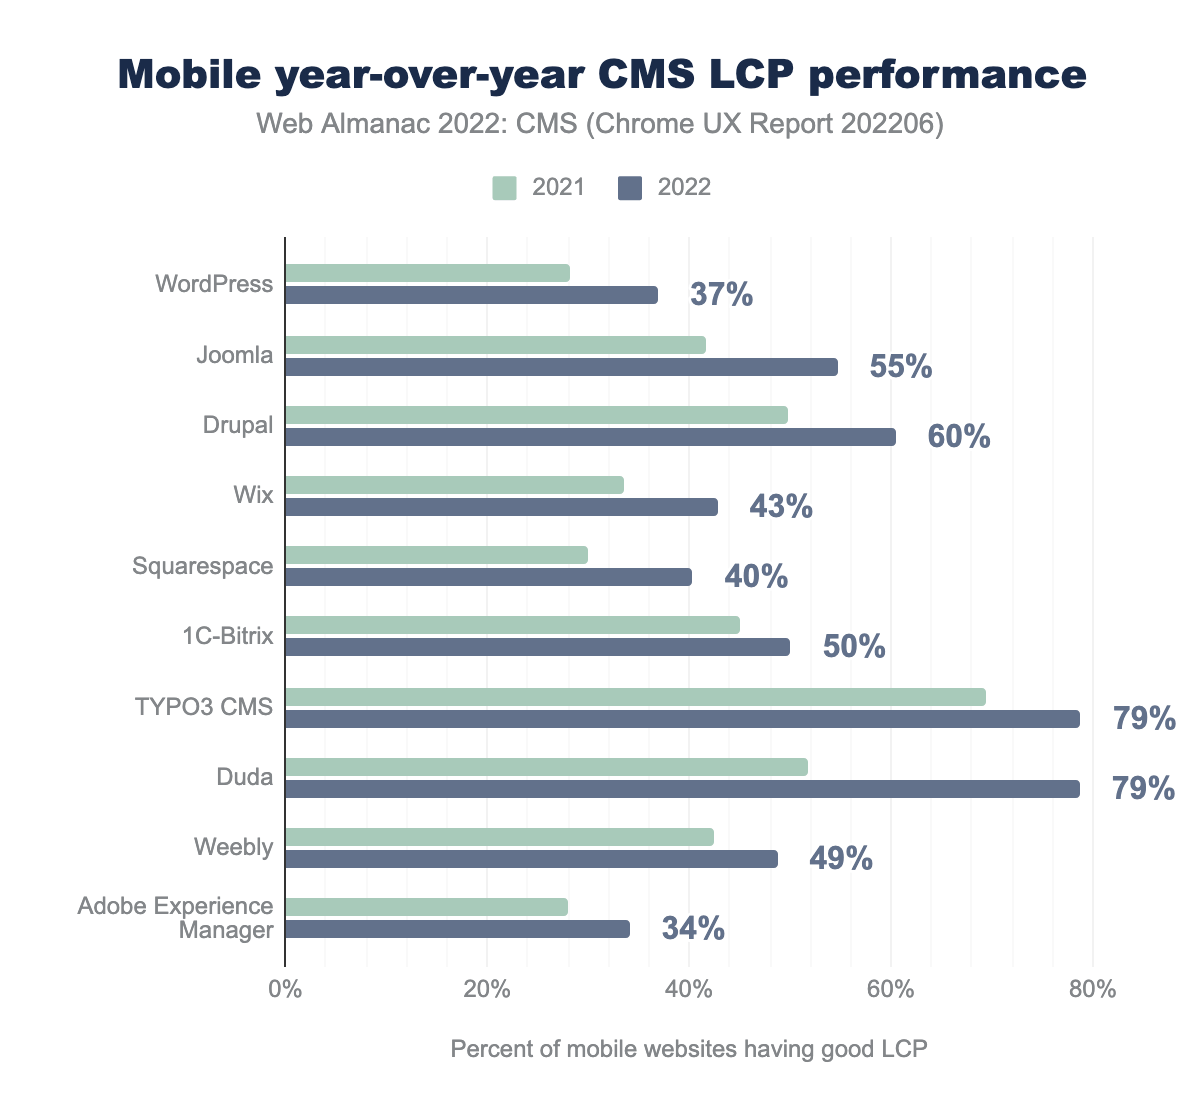
Compared to the 2021 dataset, all CMSs showed improvements in LCP. Joomla improved by 13%. Drupal, Squarespace, and TYPO3 improved by 10%. WordPress improved by 9%.
These improvements are a positive sign even though the numbers still are low for most CMSs. The difficulty in achieving a good LCP score probably relates to the fact that the LCP is dependent on the download of image/font/CSS and then displaying the appropriate HTML elements. Achieving this in under 2.5 seconds for all device types and connection speeds can be challenging. Improving LCP scores usually involves the correct use of caching, pre-loading, resource prioritization, and lazy loading of other competing resources.
First Input Delay (FID)
First Input Delay (FID) measures the time from when a user first interacts with the page (i.e., when they click a link, tap on a button, or use a custom, JavaScript-powered control) to the time when the browser is able to process that interaction. A “fast” FID from a user’s perspective would be almost immediate feedback from their actions rather than a stalled experience.
Any delay is a pain point and could correlate with interference from other parts of the site loading while the user tries to interact with the site. A “good” FID is regarded as being under 100 milliseconds.
In 2021’s report, the fact that almost all platforms manage to deliver a good FID raised questions about the strictness of this metric. The Chrome team published an article that was updated in May of 2022 to include a reference to a new metric, Interaction to Next Paint (INP) . Given its beta nature at the time of this writing, we’re limiting its inclusion to this reference in anticipation of a possible expansion in next year’s report.
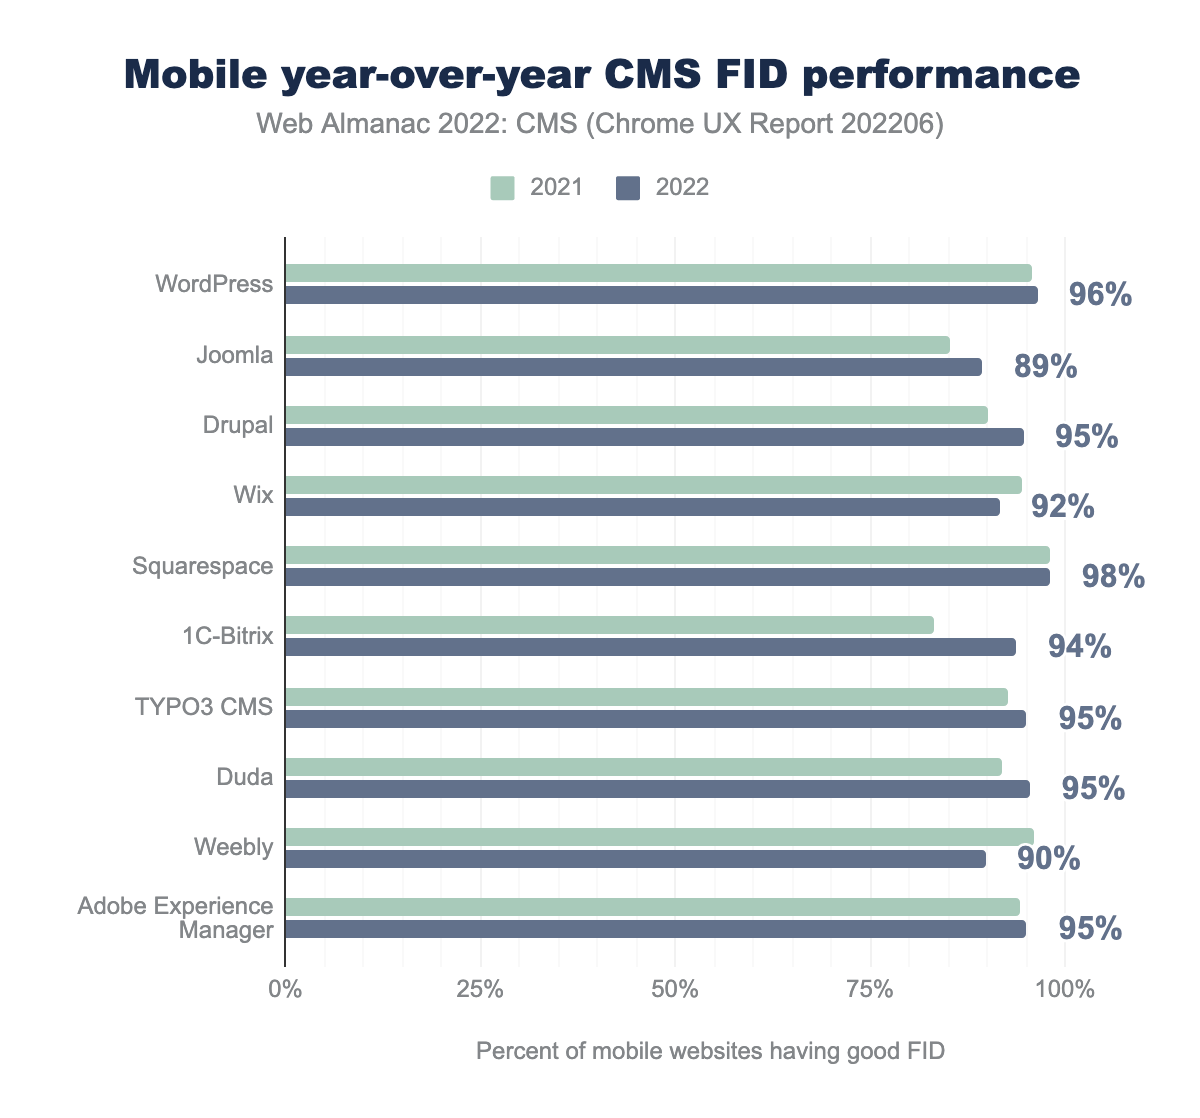
Yearly data shows that most CMSs managed to improve their FID over the past year. Wix and Weebly both regressed by several percentage points over the previous year’s data.
Cumulative Layout Shift (CLS)
Cumulative Layout Shift (CLS) measures the visual stability of content on a web page, measuring the largest burst of layout shift scores for every unexpected layout shift that occurs during the entire lifespan of a page that was not caused by direct user interactions.
A layout shift occurs any time a visible element changes its position from one rendered frame to the next. The CLS metric evolved in 2021, mainly introducing the concept of Session Windows, to be fairer to long-lived pages and Single Page Apps (SPAs).
A score of 0.1 or below is measured as “good,” over 0.25 as “poor,” and anything in between “needs improvement.”
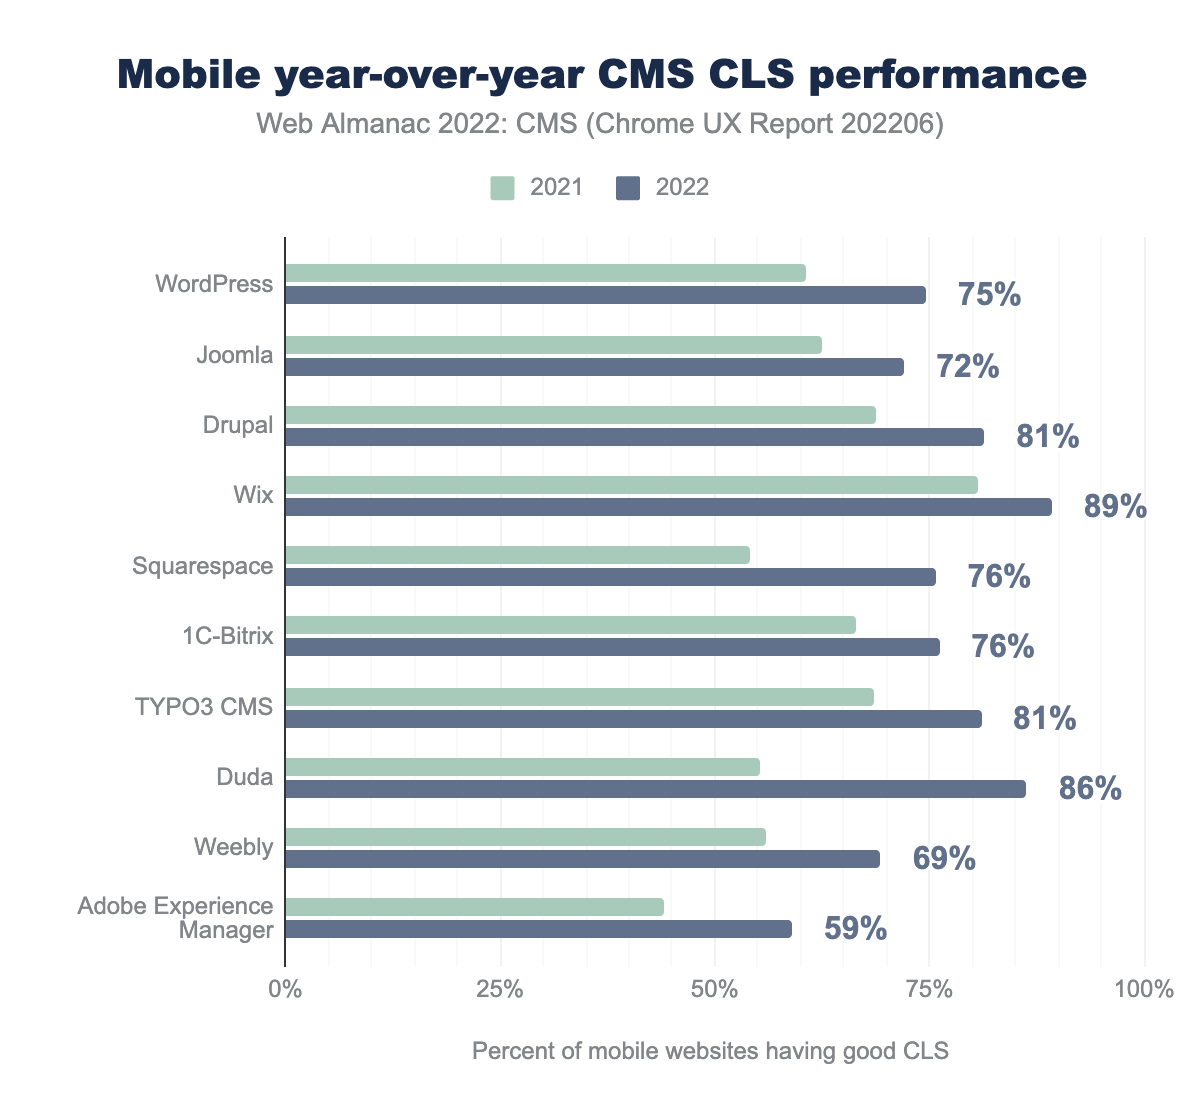
Comparing yearly data, we can see that all CMSs made progress. WordPress, Squarespace, Duda, and Adobe Experience Manager in particular show significant gains.
Lighthouse
Lighthouse is an open-source, automated tool for improving the quality of web pages. One key aspect of the tool is that it provides a set of audits to assess the status of a website in terms of performance, accessibility, SEO, best practices, and more. Lighthouse reports provide lab data, a way developers can get suggestions on how to improve website performance, but the Lighthouse score has no direct implications on the actual field data collected by CrUX. You can read more on Lighthouse and the correlation between its lab scores and field data.
HTTP Archive runs Lighthouse on its mobile web pages, which are also throttled to emulate a slow 4G connection with a CPU slowdown, and also this year they started running on Desktop as well.
We can analyze this data to provide another perspective on CMS performance, using the results of these synthetic tests, which also include metrics that are not tracked in CrUX.
Performance score
The Lighthouse performance score is a weighted average of several scored metrics.
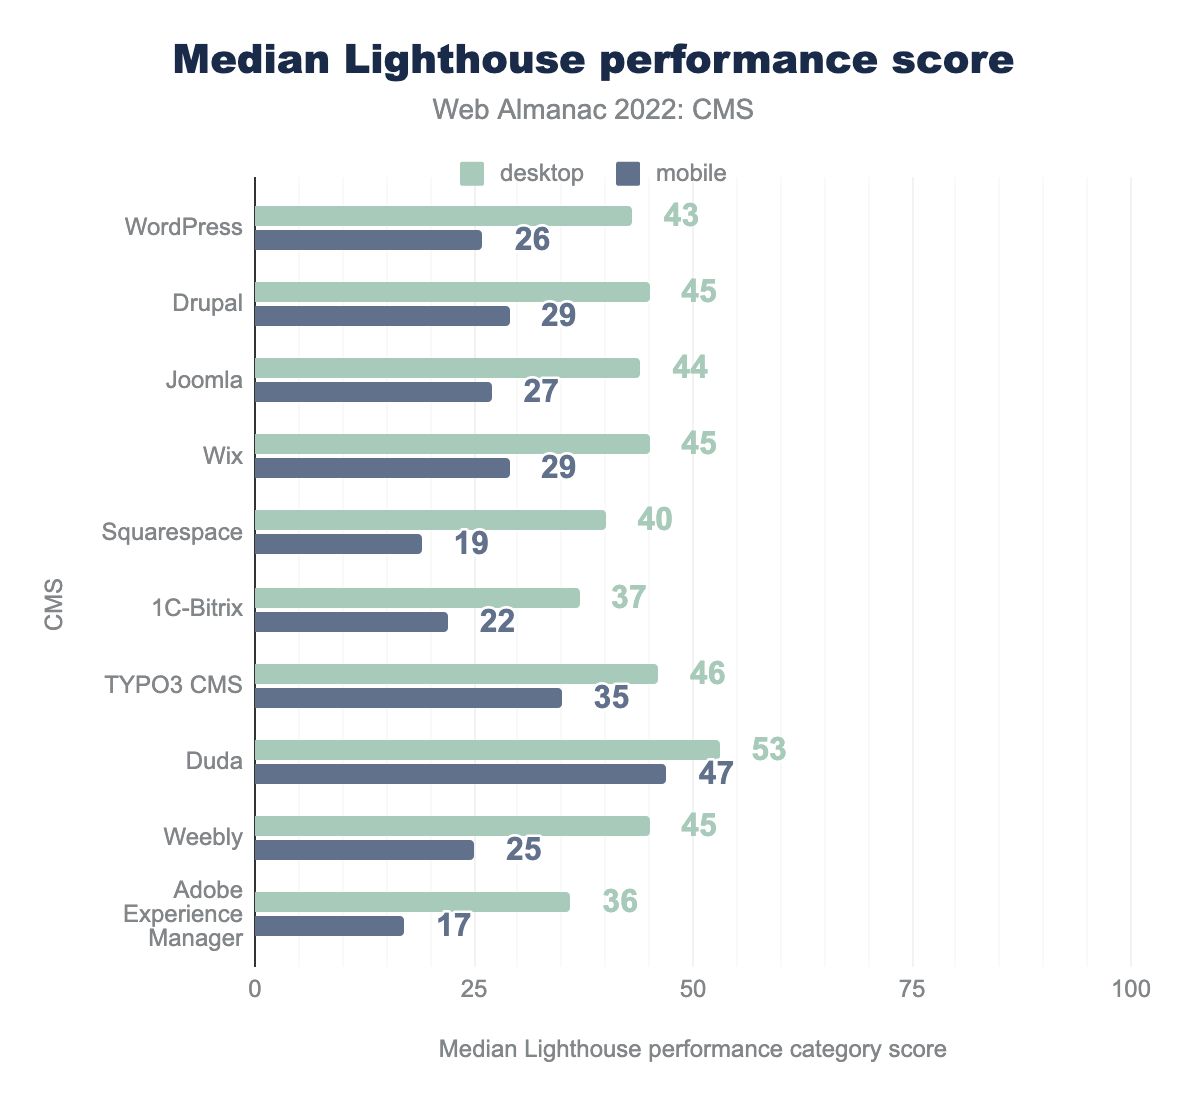
We can see that the median performance scores for most platforms on mobile are low and range from about 19 to 35. Duda at 47 is the exception. As Philip Walton noted in 2021, this does not directly imply bad results in mobile field data, but it does imply that all platforms have room for improvement, especially on low-end devices with network connections similar to those Lighthouse attempts to emulate.
WordPress, Joomla, Drupal, and 1C-Bitrix showed no change from last year’s results. Wix dropped from 30% to 29% while the rest showed improvement.
Desktop scores were good across the board with all CMSs seeing 10-20 point improvements. This isn’t surprising, given the faster CPUs and networks available to the desktop.
SEO score
Search Engine Optimization (or SEO) is the practice of improving a website to make it more easily found in search engines. This is covered more in-depth in our SEO chapter, but it relates to CMSs as well. A CMS and content on it is generally set up to serve as much information to search engine crawlers as possible to make it as easy as possible for them to index site content appropriately in search engine results. Compared to a custom-built website, one might expect a CMS to provide good SEO capabilities, and the Lighthouse scores in this category are appropriately high.
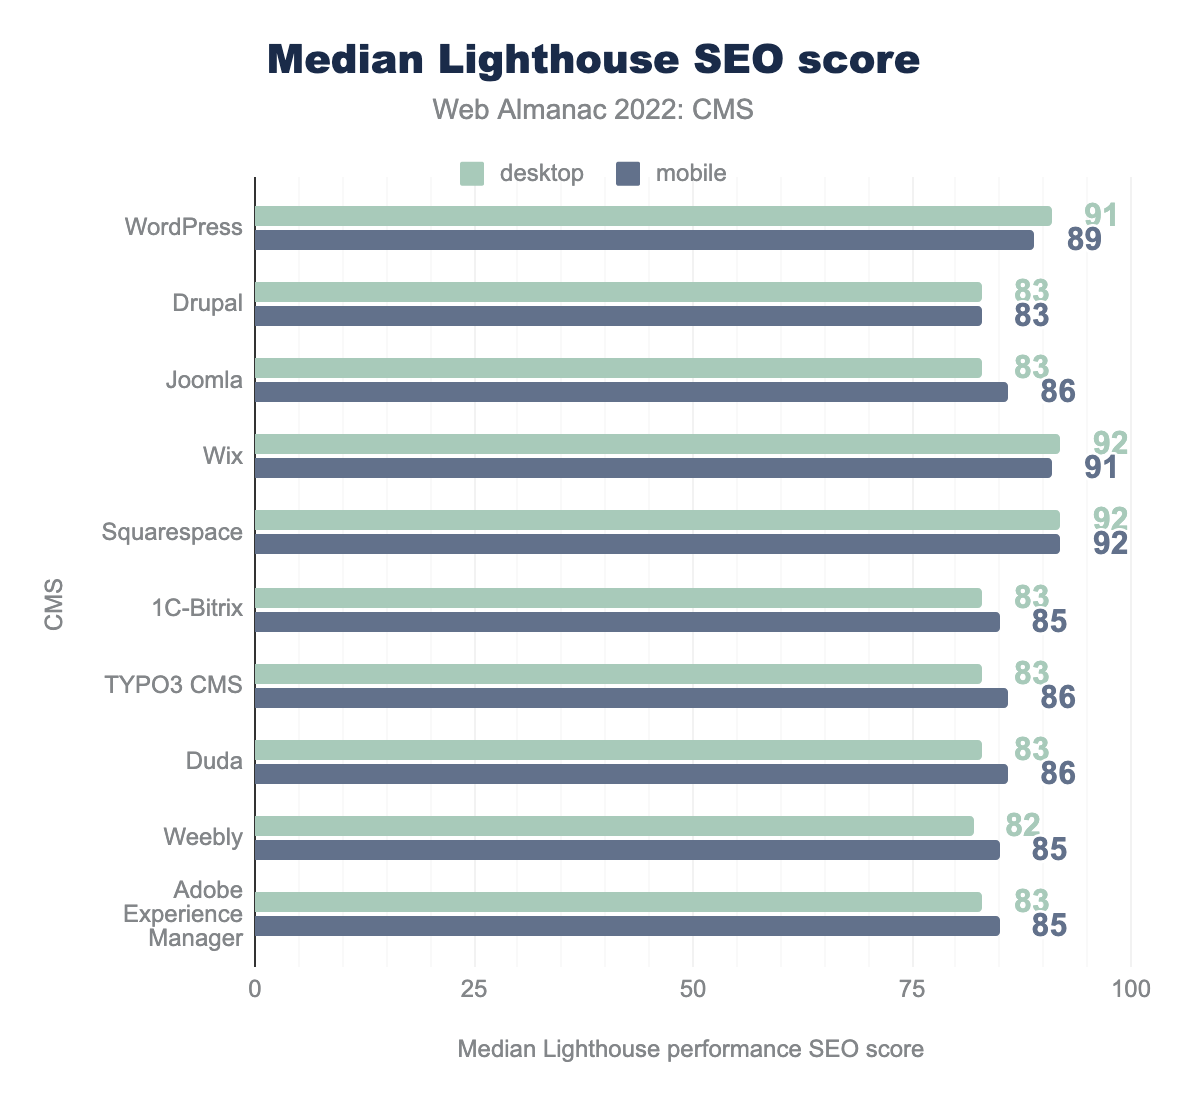
The median SEO scores in all of the top 10 platforms range from 83-92, a slight reduction from 84-95 in 2021. Desktop scores are similar—slightly better in some cases, slightly worse in others.
Accessibility score
An accessible website is a site designed and developed so that people with disabilities can use them. Web accessibility also benefits people without disabilities, such as those on slow internet connections. Read more in our Accessibility chapter.
Lighthouse provides a set of accessibility audits, and it returns a weighted average of all of them. See Scoring Details for a full list of how each audit is weighted.
Each accessibility audit is either a pass or a fail, but unlike other Lighthouse audits, a page doesn’t get points for partially passing an accessibility audit. For example, if some elements have screen reader-friendly names, but others don’t, that page gets a zero for the screen reader-friendly-names audit.
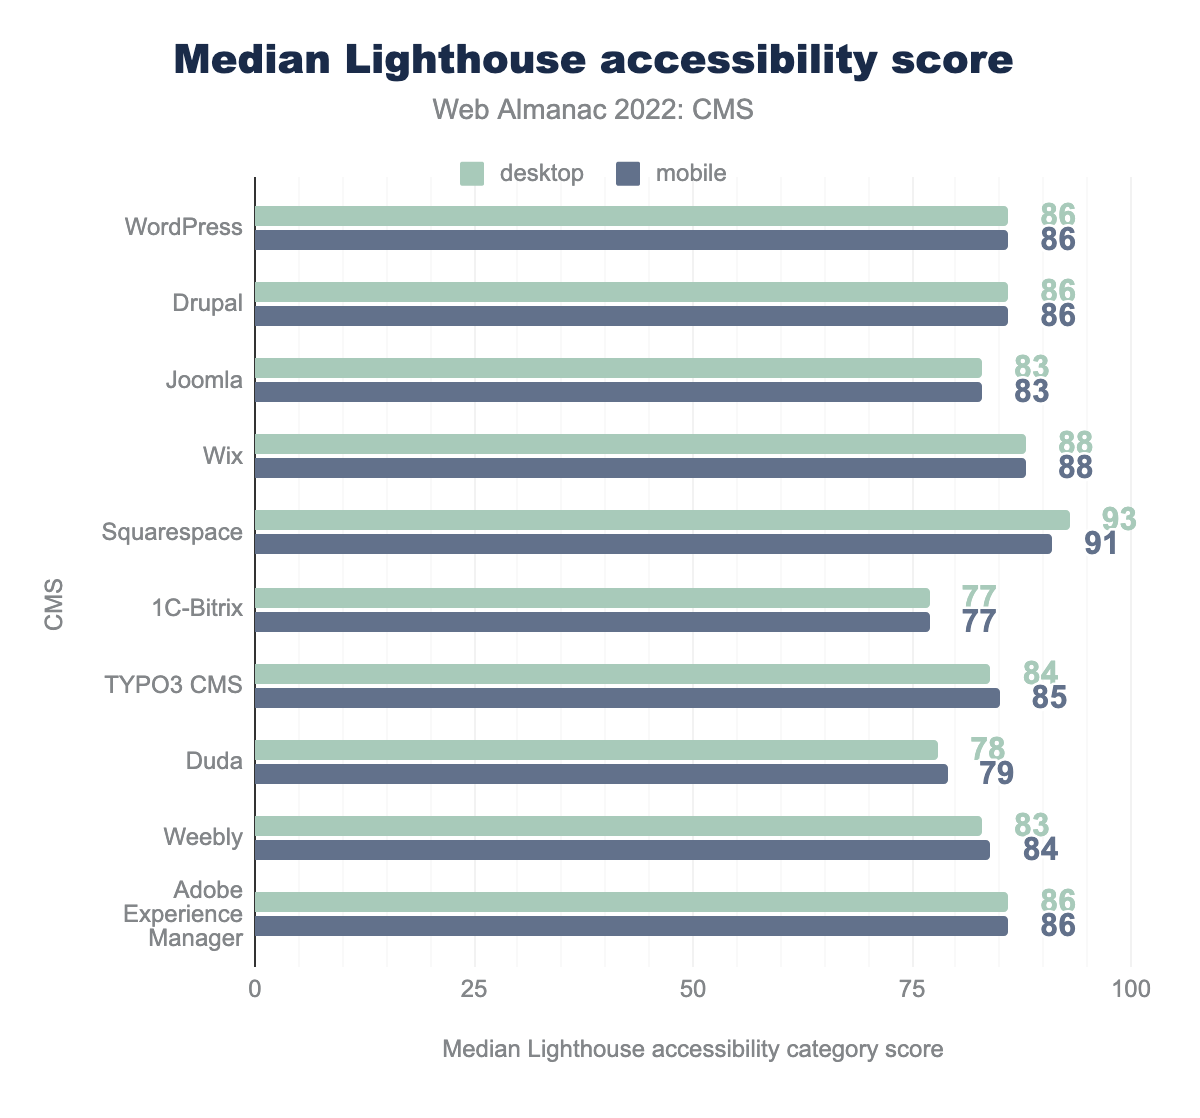
The median Lighthouse accessibility score for the top 10 CMSs ranges between 77 and 91. Squarespace had the highest score of 91, while 1C-Bitrix had the lowest accessibility scores. The desktop scores are almost identical to mobile, perhaps reflecting that the same sites are delivered to both desktop and mobile devices.
Best practices
The Lighthouse best practices try to ensure that web pages are following best practices for the web for a variety of different metrics such as supporting HTTPS, no errors logged in the console, and more.
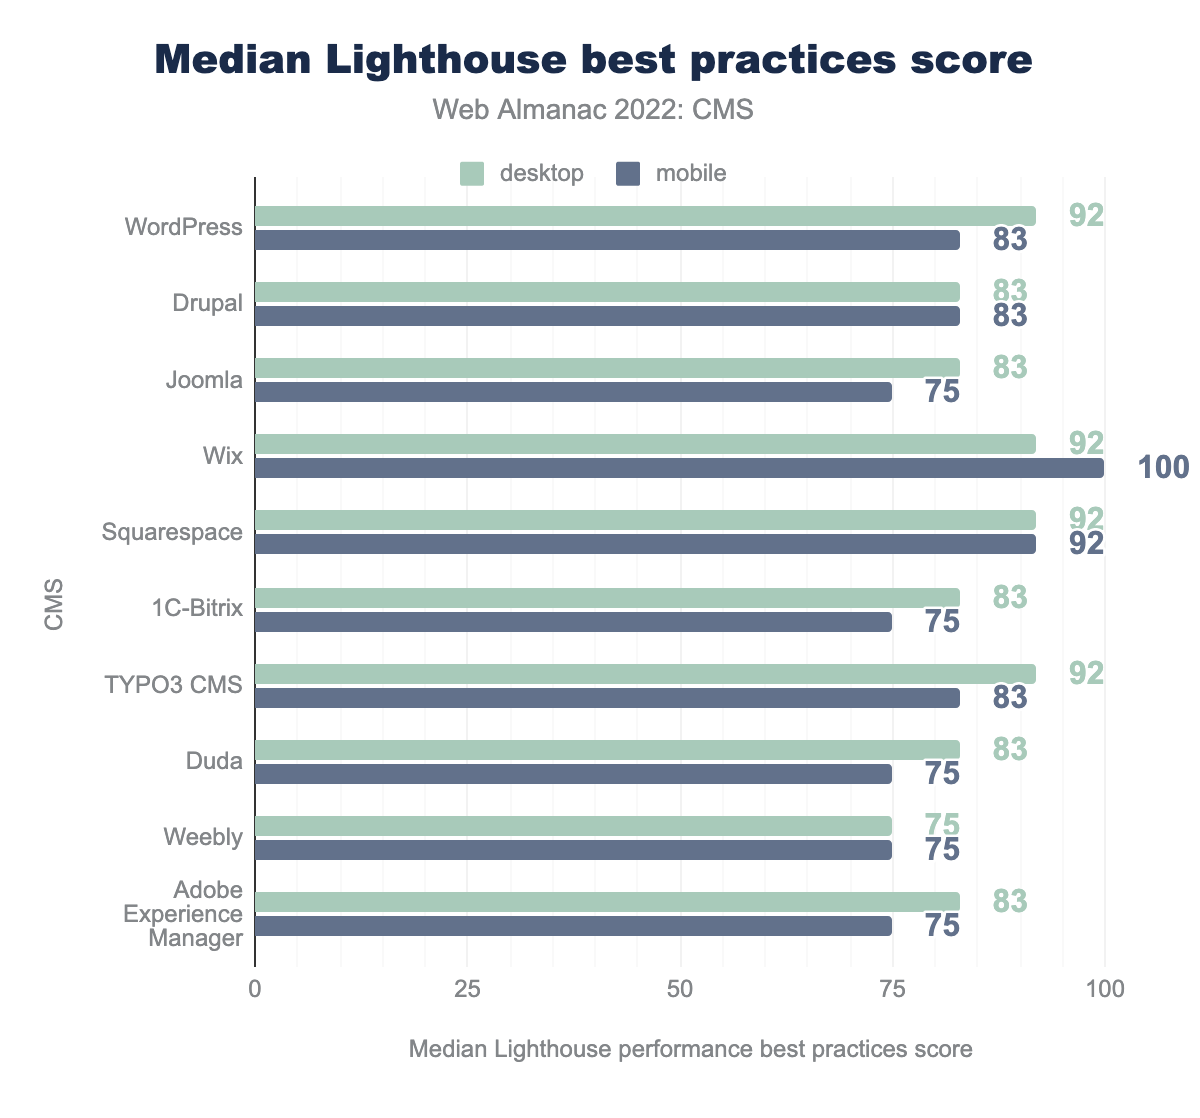
Wix had the highest median best practices score of 100, while many of the other top 10 platforms share the lowest score of 75. Again, desktop results are very similar though larger in some cases. This may reflect incorrect image aspect ratios on mobile pages since most of the other audits in this category are platform-based.
Resource weights
We also used HTTP Archive data to analyze the weight of resources used across different platforms. We did this to highlight possible opportunities for performance improvement. Page loading performance does not depend exclusively on the number of downloaded bytes, but fewer bytes necessary to load a page results in reduced costs, fewer carbon emissions, and potentially faster performance—especially for slower connections.
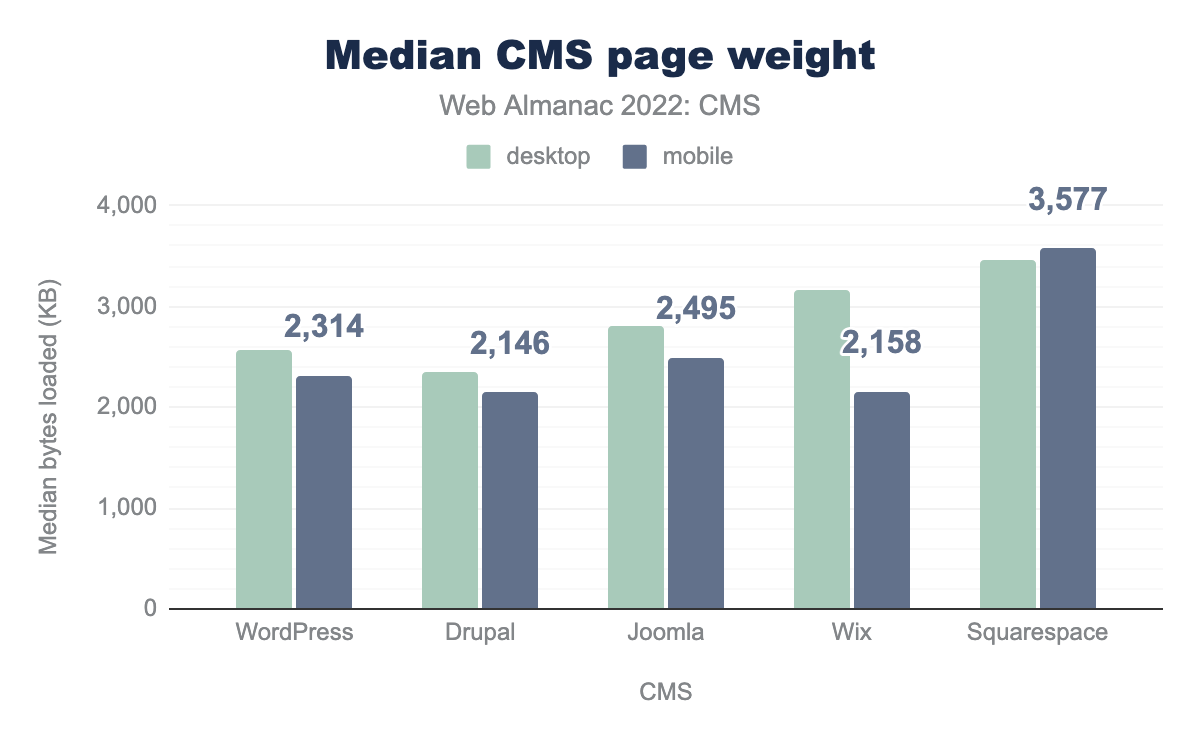
Most of the top five CMSs deliver a median page weight of around ~2 MB, except Squarespace which delivers a larger ~3.5 MB. All except Joomla showed increases in page weight over 2021 data.
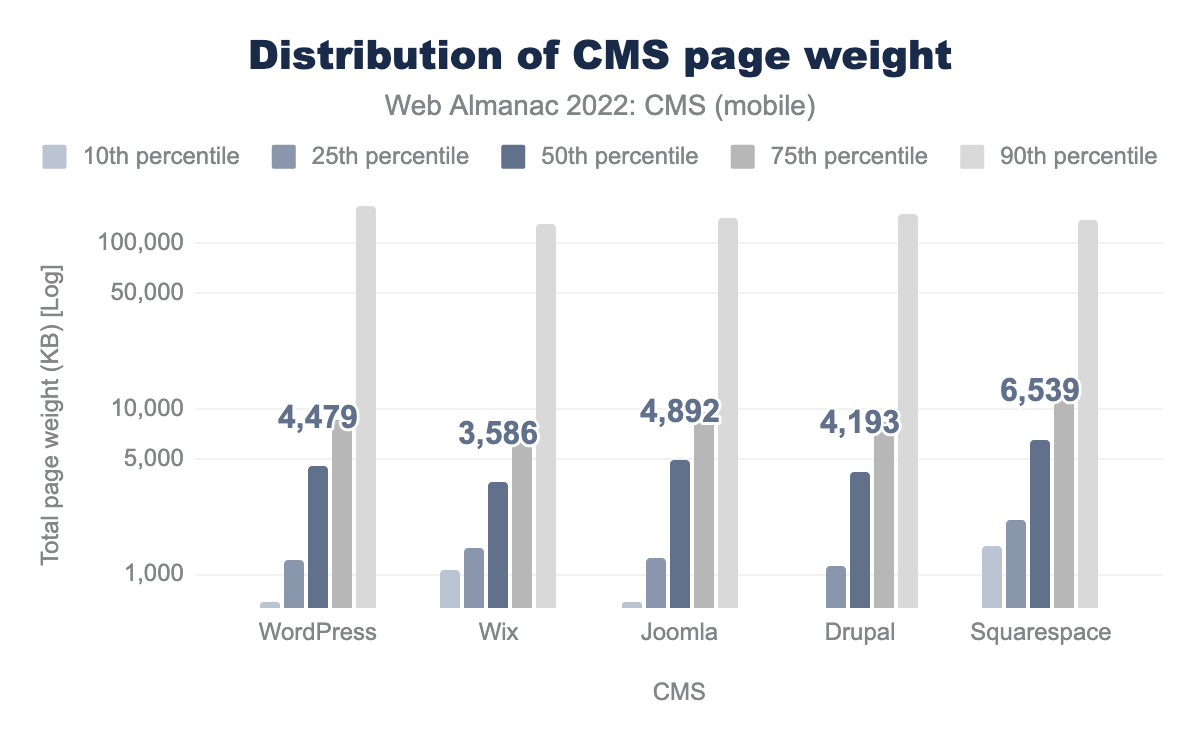
The distribution of page weight in each platform’s percentiles is substantial. Page weight is probably related to the differences in user content across web pages, the number of images used, plugins installed, etc. The smallest pages delivered per platform come from WordPress, a marked improvement over last year’s data. This year, WordPress only sends 673 KB for their 10th percentile of visits. The largest pages come from Squarespace, with ~11.4 MB delivered for their 90th percentile of visits, a ~2 MB increase over last year’s data.
Page weight breakdown
Page weight is the sum in kilobytes of resources used on a page. We can attempt to evaluate these different resource sizes across different CMSs.
Images
Images, which are usually the heaviest resource loaded on a web page, account for a large portion of the resource weight.
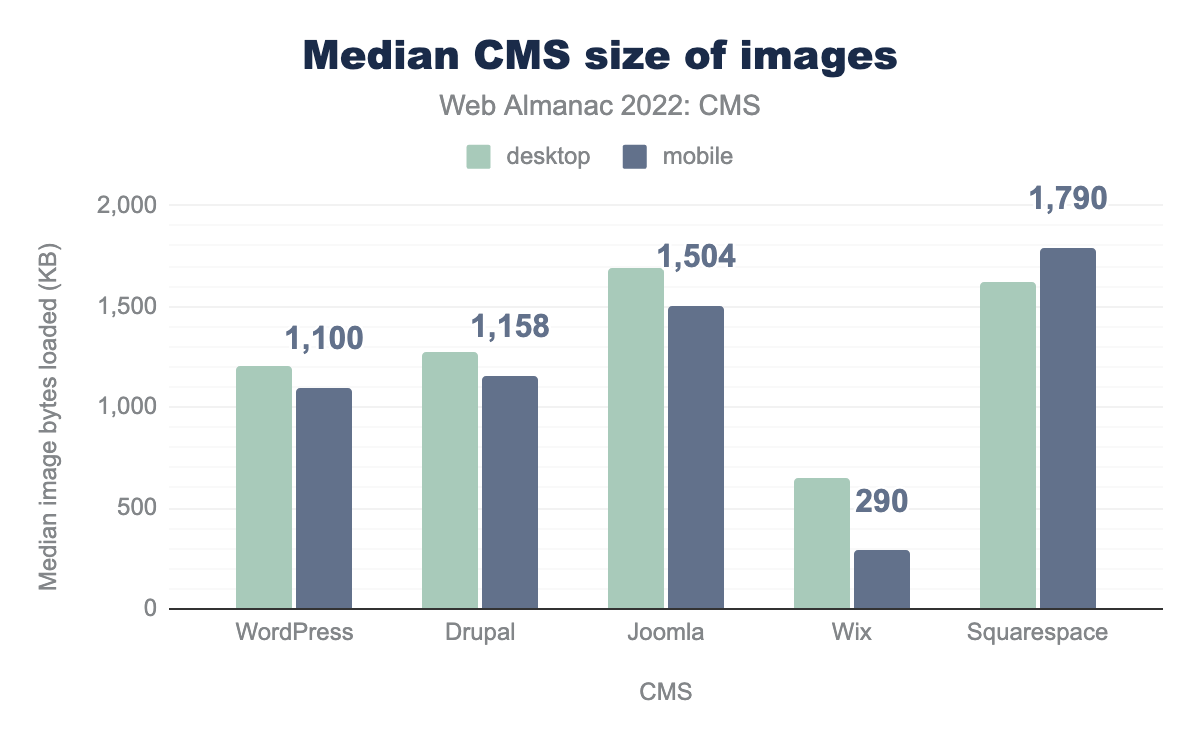
Wix delivers substantially fewer image bytes, with only 290 KB delivered for the median of mobile views. This suggests good use of image compression and lazy image loading. All of the other top five platforms deliver over 1 MB of images, with Squarespace delivering the largest ~1.7 MB.
Advanced image formats provide a considerable improvement in compression, enabling resource savings and faster site loading. WebP is commonly supported in all major browsers today, with over 95% support. In addition, there are several newer image formats gaining popularity and adoption, namely AVIF, and JPEG-XL.
We can examine the usage of the different image formats across the top CMSs:
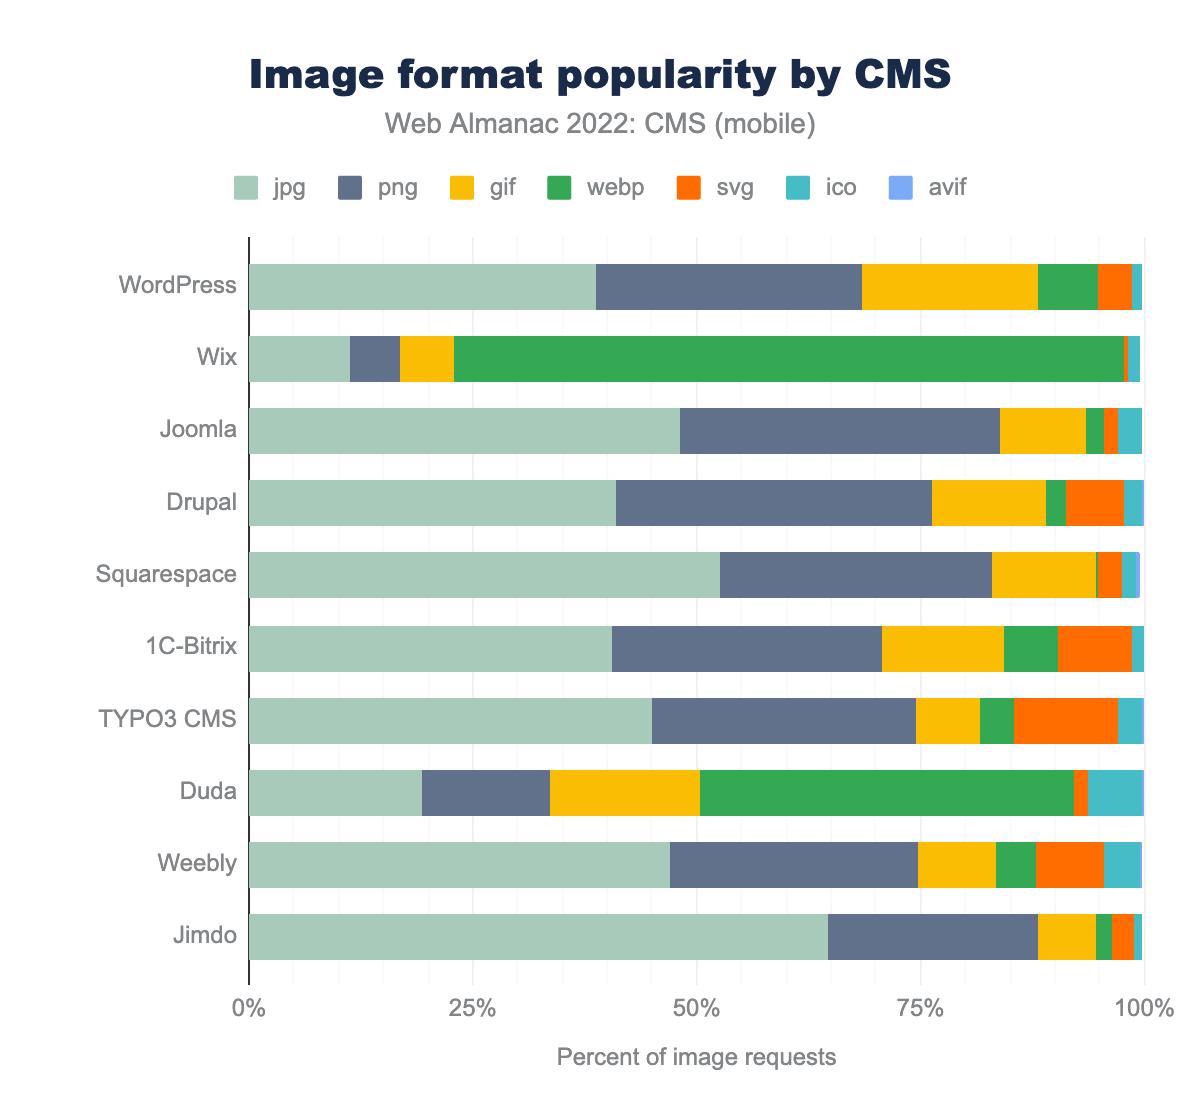
Wix and Duda make the most use of WebP, at ~75% and 42% adoption respectively, while the rest show minor increases.
With the growing support of WebP, it seems all platforms have work to do to reduce the usage of the older JPEG and PNG formats without compromising on image quality.
WordPress introduced support for WebP in WordPress 5.8, which was released in June of 2021. WebP support was planned to be included by default in WordPress 6.1. However, this decision has been delayed. Eventually, we expect a significant increase in WebP adoption via WordPress which may be apparent in the 2023 results.
JavaScript
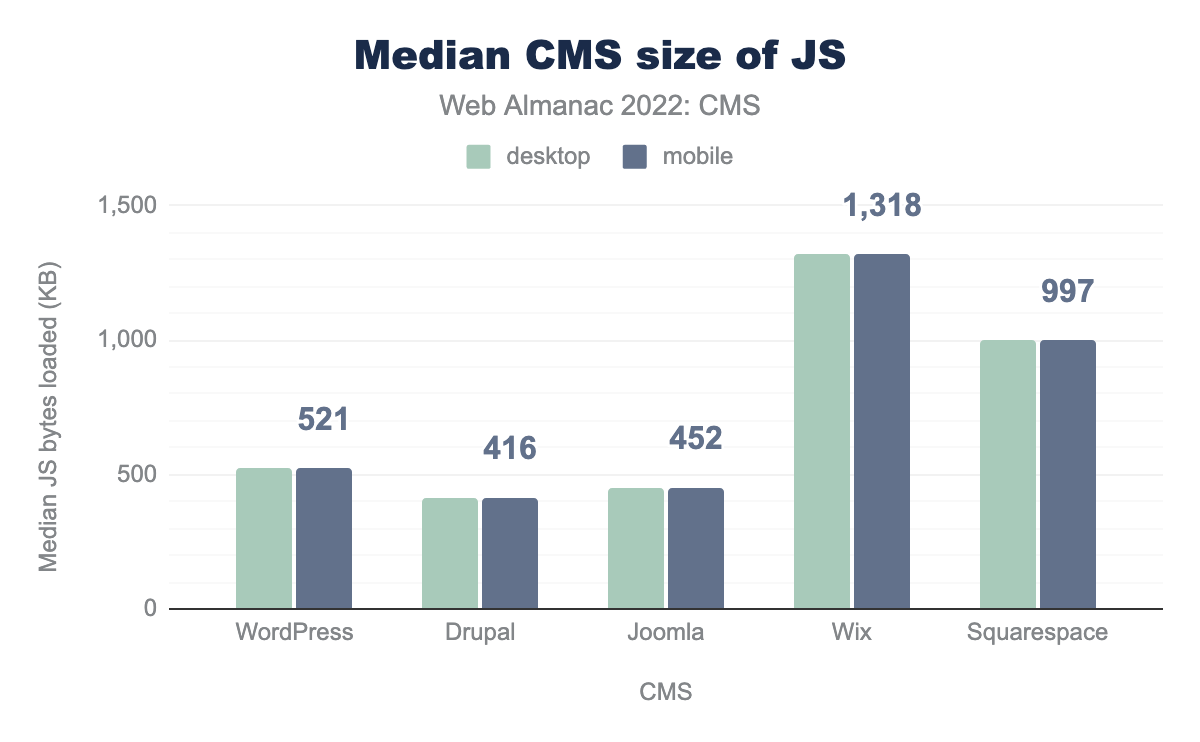
The top five CMSs all deliver pages that rely on JavaScript, with Drupal delivering the fewest JavaScript bytes: 416 KB on mobile. Wix delivers the most JavaScript bytes—over 1.3 MB.
HTML document
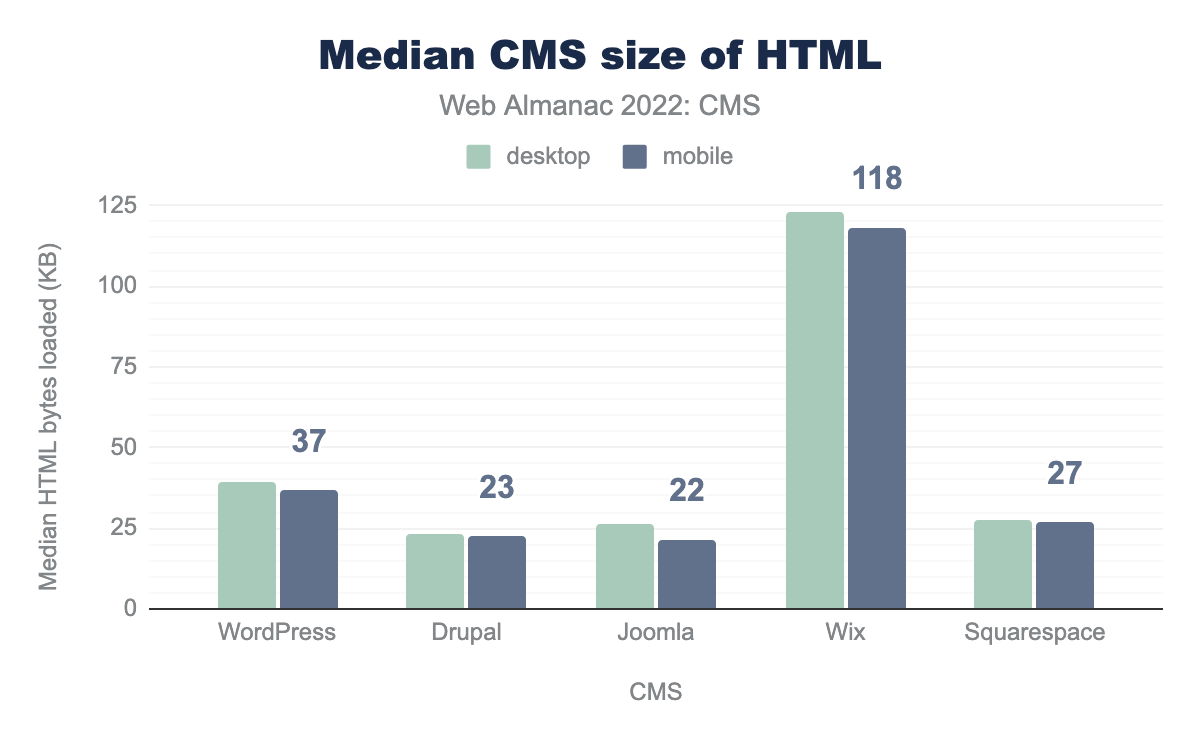
Examining the HTML document sizes, we can see that most of the top CMSs deliver a median HTML size of ~22 KB–37 KB. The only exception is Wix which delivers ~118 KB, a minor improvement over 2021’s results. This may suggest extensive use of inlined resources and shows an area that can be further improved.
CSS
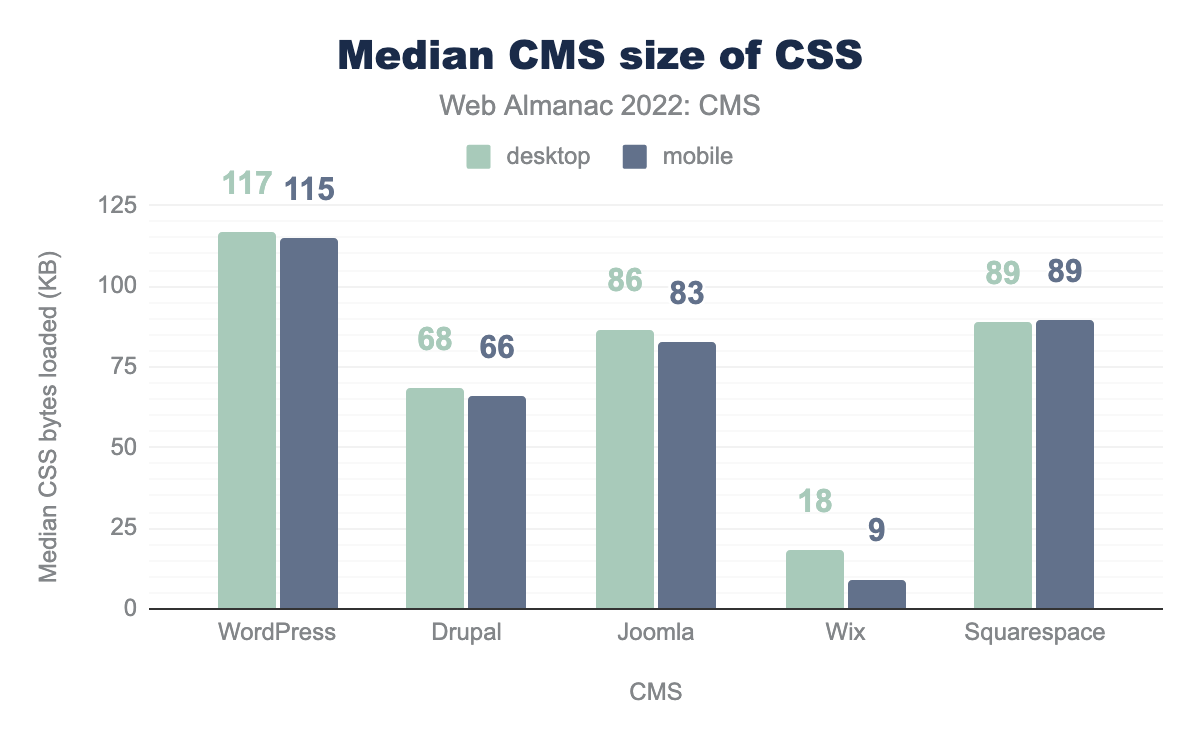
Next, we examine the use of explicit CSS resources that are downloaded. Here we can see a different distribution between platforms that strengthens the case for inlining CSS. Wix delivers the fewest CSS resources, with only ~9 KB sent on mobile views. WordPress delivers the most with ~115 KB.
Fonts
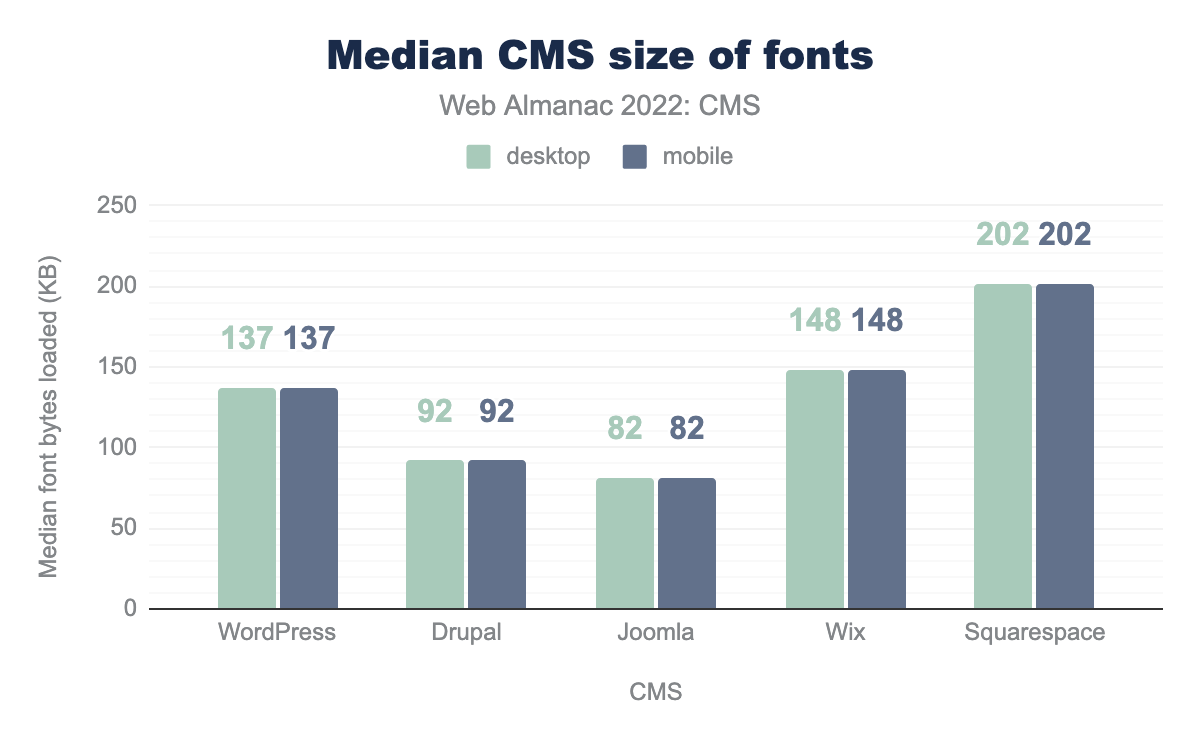
To display text, web developers often choose to use a variety of fonts. Joomla delivers the fewest font bytes, with 82 KB on mobile views. Squarespace delivers the most with 202 KB.
WordPress in 2022
WordPress is the most commonly used CMS today. Almost three out of four sites built with a CMS are using WordPress, which merits further discussion.
WordPress is an open-source project, which has been around since 2003. Many sites built on WordPress use a variety of themes and plugins, sometimes through page builders such as Elementor, WP Bakery, or Divi.
The WordPress ecosystem maintains the CMS and services required for additional functionality through custom services and products (themes and plugins). This community has an outsized impact, with a relatively small number of people maintaining both the CMS itself and providing the additional functionality which makes WordPress sufficiently powerful and flexible that it can serve most kinds of websites. This flexibility is important when explaining the market share, but it also complicates the discussion around WordPress-based site performance.
In 2021, contributors from the WordPress community acknowledged the current state of performance, in this proposal to create a performance-dedicated core team, which we hope will improve the performance of the average WordPress site.
This year, we compared our results against last year, focusing on adoption by geography and passing Core Web Vitals by geography along with a look at average resource usage.
Adoption by geography
First, we examined WordPress adoption by geography across all sites in our dataset in comparison to our 2021 results.
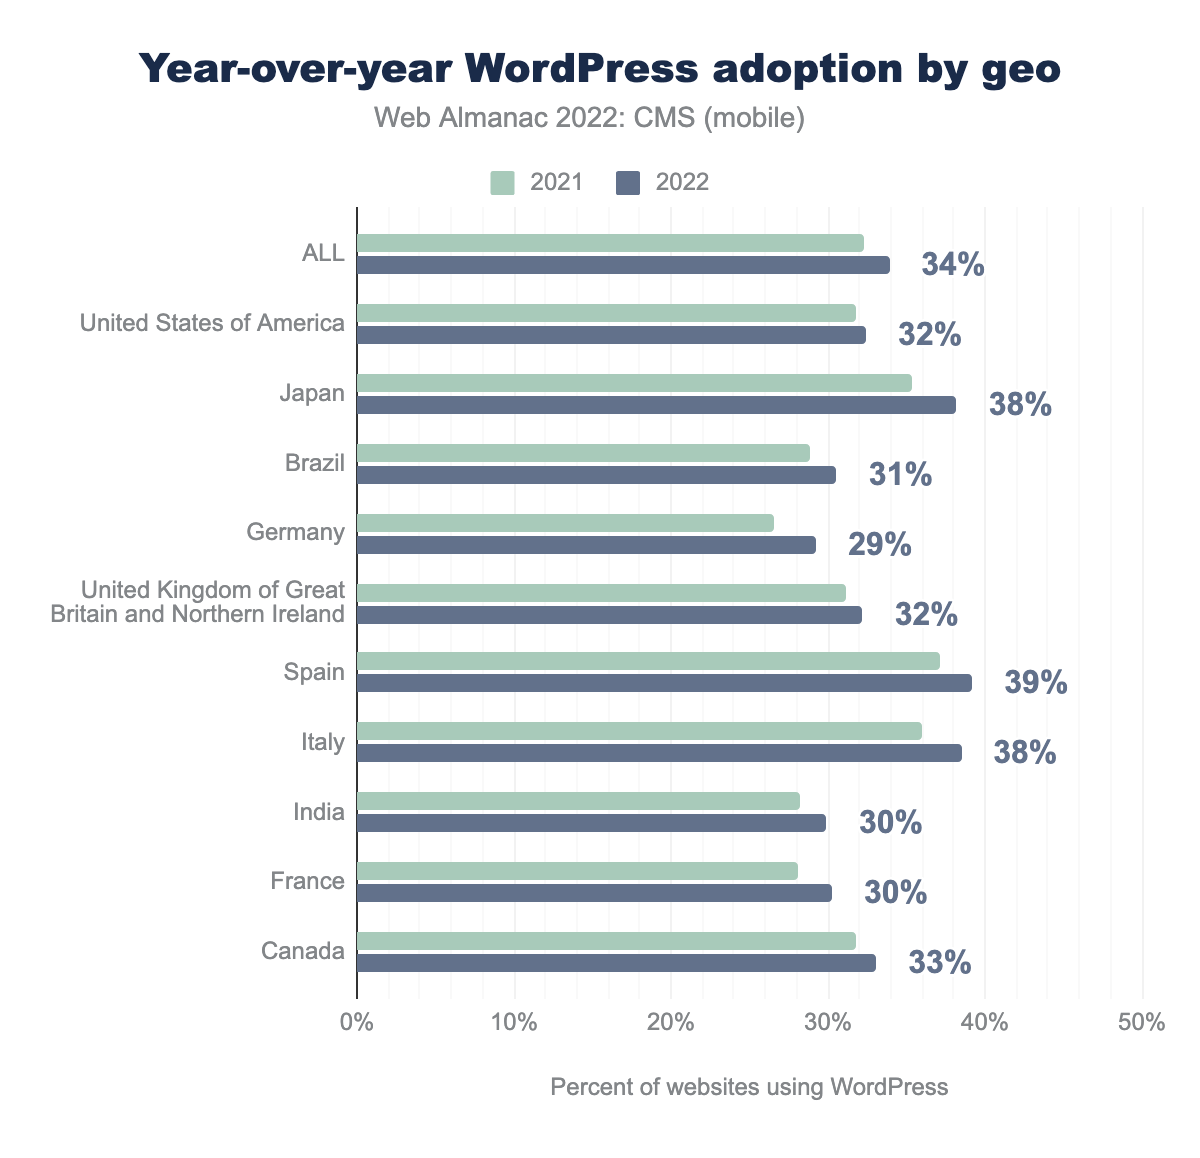
According to our dataset, WordPress adoption is growing significantly in all the top geographies.
Passing CWVs by geography
Next, we looked at the number of WordPress origins with passing scores for Core Web Vitals, but this time we broke them down by geography, mobile device usage, and in comparison with our 2021 results.
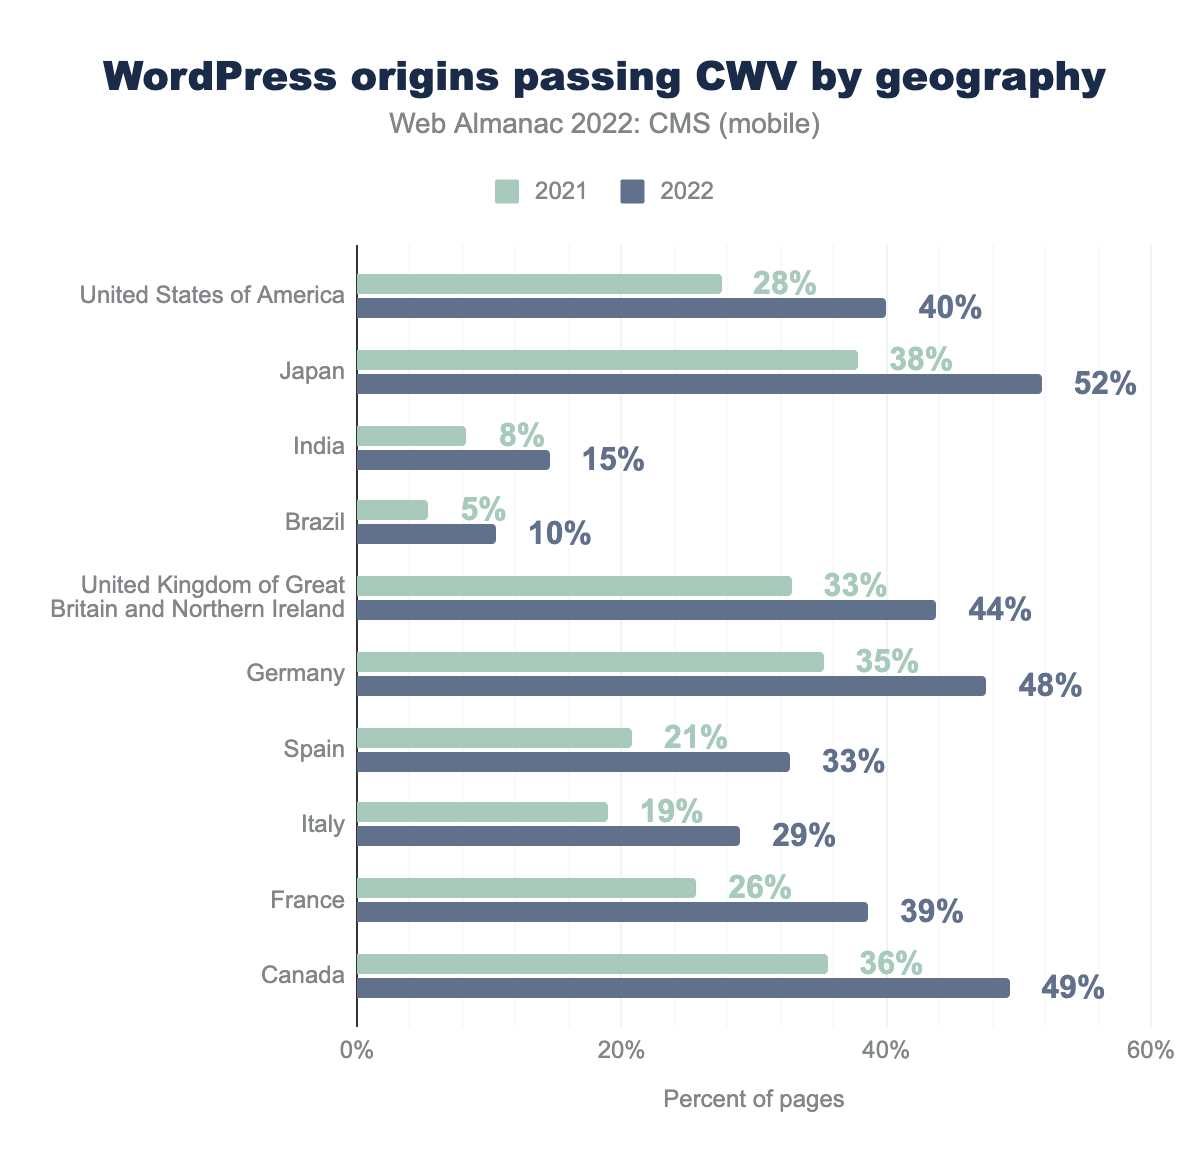
All geographies showed improvements, ranging from a 5% overall gain in Brazil to 14% in Japan. Also worth noting is the large disparity across geographies, with Brazil at 10% total compared to Japan at 52%. Brazil on the low end is growing, though, improving 100% year-over-year. As we evaluate next year’s dataset, it may be worth investigating the low end performers further to identify potential causes and opportunities for improvement.
Plugins
We explored how WordPress sites use external resources and separated them into resources that are included in plugins, themes, and shipped in WordPress core (wp-includes) with comparison to our 2021 results.
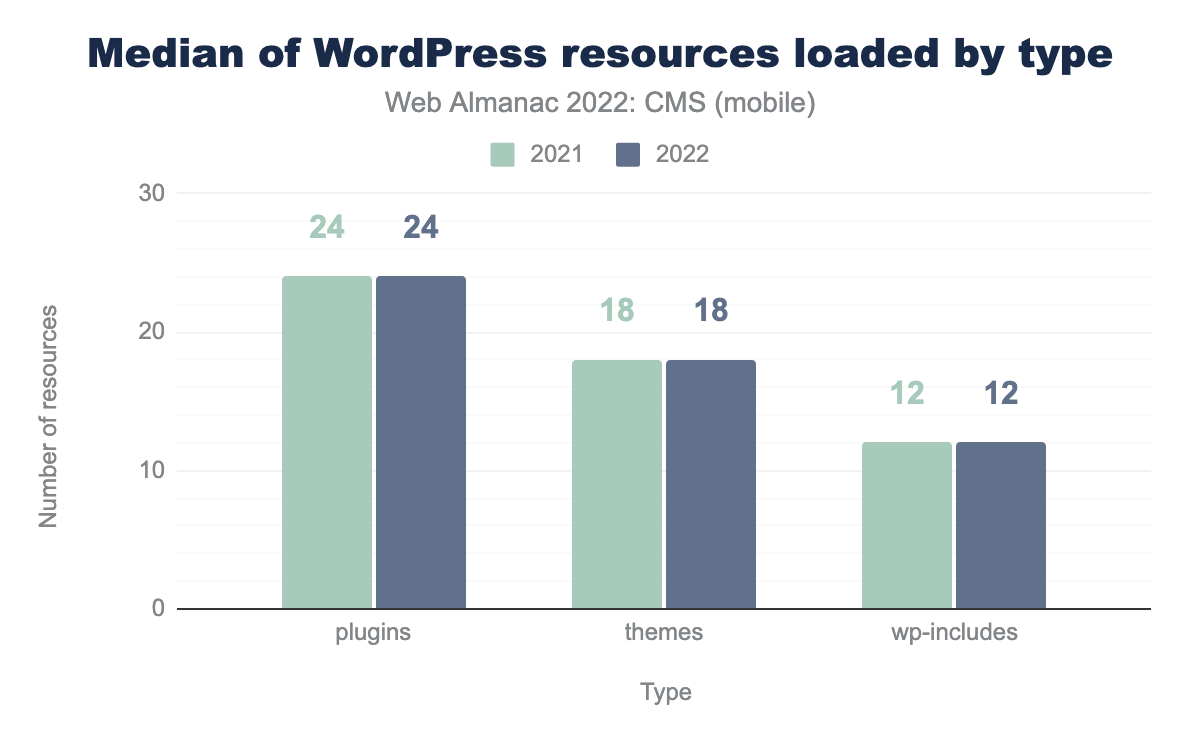
We can see no noticeable change in the number of resources used year on year. We’ll revisit again next year, perhaps looking more closely at the implied performance impact of popular themes and plugins.
Conclusion
CMS platforms continue to grow and are becoming more ubiquitous year by year. They are essential for creating and consuming content on the internet, especially as more people and businesses establish an online presence.
The introduction of Core Web Vitals, along with the advancements in performance data visibility, has made web performance a priority everywhere CMSs are used. We hope the insights in this chapter will help us all form a better understanding of the current state of the web, ultimately making the web a better place.
CMSs are doing great work and have opportunity to further improve user experiences on the web at scale by striving to enhance their infrastructure, experiment and integrate with new standards as they evolve, and follow best practices.
On the other hand, Core Web Vitals as standards still have some evolving to do. We mentioned some ideas for a better responsiveness metric above. In addition, navigation between pages in a site should be better tracked and take into account the architectural differences between Single-Page Applications (SPAs) and Multi-Page Applications (MPAs) architectures.
We look forward to next year’s results and hope to both expand our datasets and improve our methodologies. In the meantime, onward and upward, let’s keep making the web better.
