JavaScript
Introduction
The speed and consistency at which the JavaScript language has evolved over the past years is tremendous. While in the past it was used primarily on the client side, it has taken a very important and respected place in the world of building services and server-side tools. JavaScript has evolved to a point where it is not only possible to create faster applications but also to run servers within browsers.
There is a lot that happens in the browser when rendering the application, from downloading JavaScript to parsing, compiling, and executing it. Let’s start with that first step and try to understand how much JavaScript is actually requested by pages.
How much JavaScript do we load?
They say, “to measure is the key towards improvement”. To improve the usage of JavaScript in our applications, we need to measure how much of the JavaScript being shipped is actually required. Let’s dig in to understand the distribution of JavaScript bytes per page, considering what a major role it plays in the web setup.
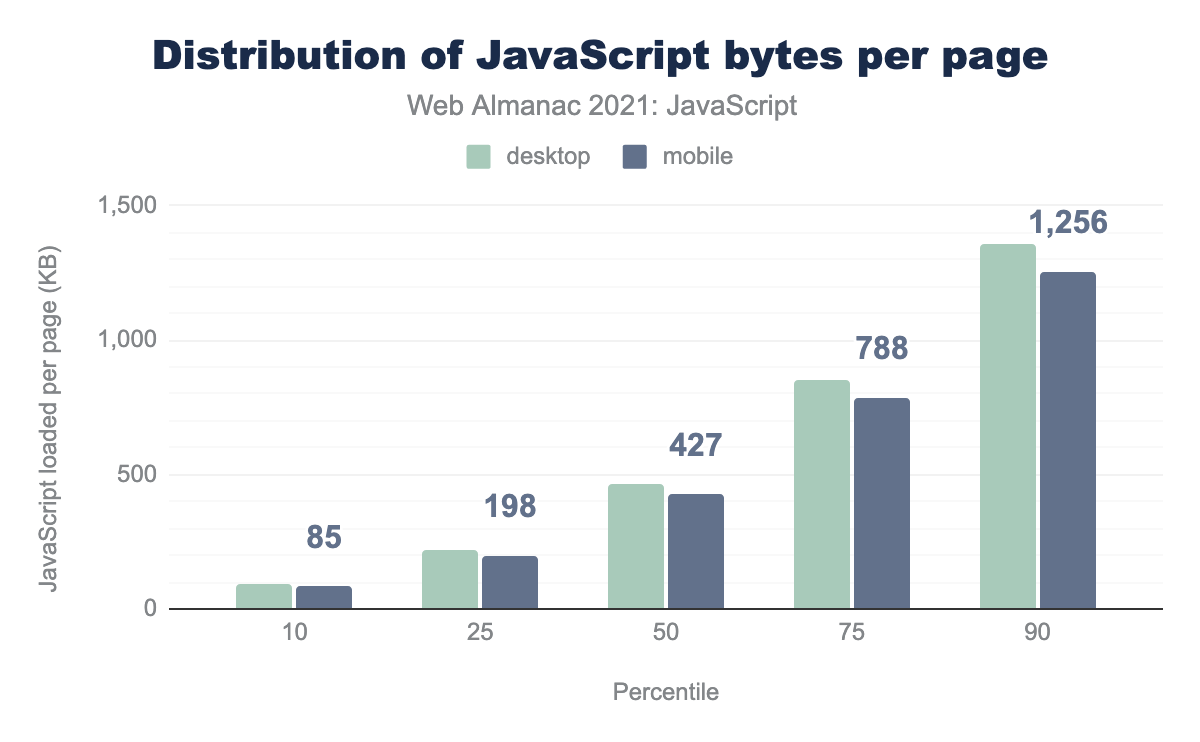
The 50th percentile (median) mobile page loads 427 KB of JavaScript, whereas the median page loaded on a desktop device sends 463 KB.
Compared to 2019’s results, this shows an increase of 18.4% in the usage of JavaScript for desktop devices and an increase of 18.9% on mobile devices. The trend over time is moving towards using more JavaScript, which could slow down the rendering of an application given the additional CPU work. It’s worth noting that these statistics represent the transferred bytes which could be compressed responses and thus, the actual cost to the CPU could be significantly higher.
Let’s have a look at how much JavaScript is actually required to be loaded on the page.
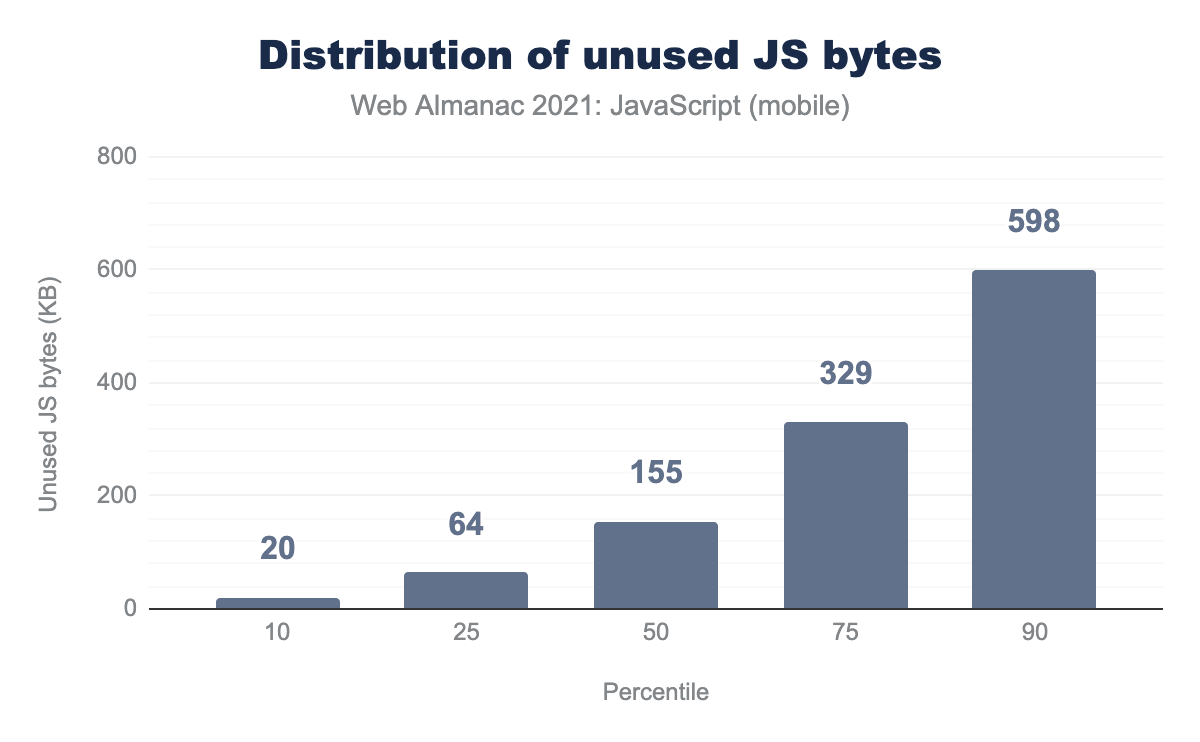
According to Lighthouse, the median mobile page loads 155 KB of unused JavaScript. And at the 90th percentile, 598 KB of JavaScript are unused.
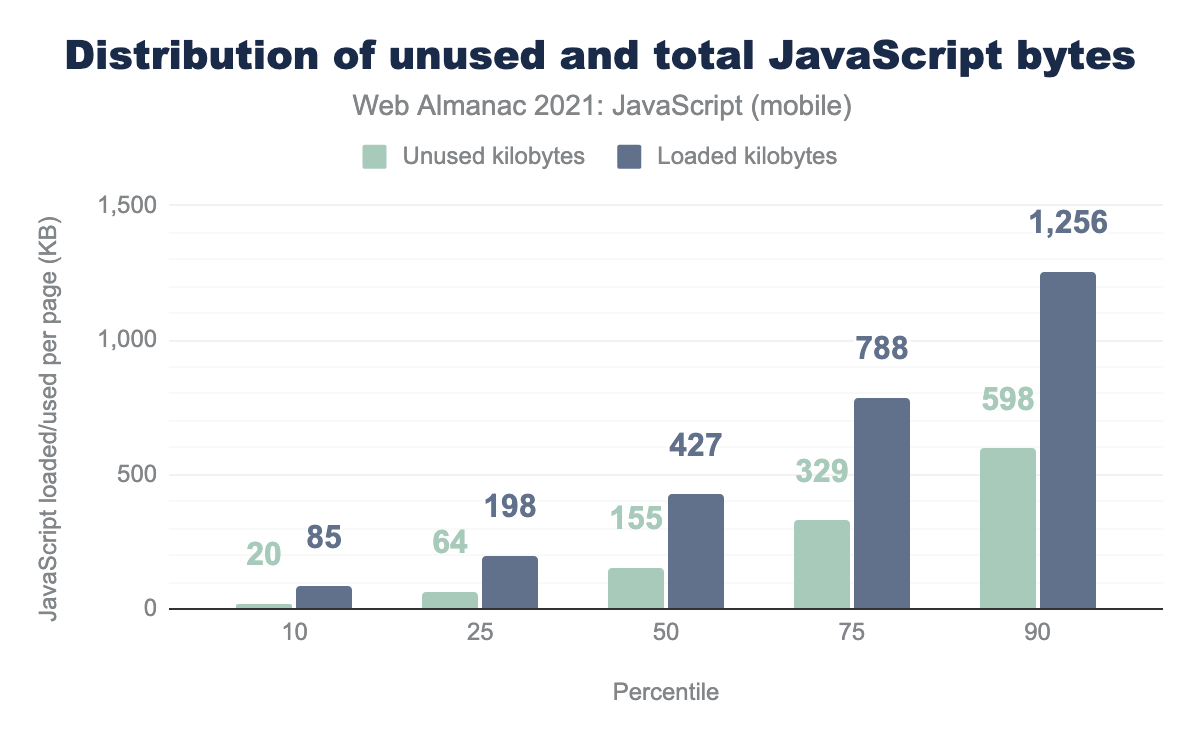
To put it another way, 36.2% of JavaScript bytes on the median mobile page go unused. Given the impact JavaScript can have on the Largest Contentful Paint (LCP) of the page, especially for mobile users with limited device capabilities and data plans, this is such a significant figure to be consuming CPU cycles with other important resources just to go to waste. Such wastefulness could be the result of a lot of unused boilerplate code that gets shipped with large frameworks or libraries.
Site owners could reduce the percentage of wasted JavaScript bytes by using Lighthouse to check for unused JavaScript and follow best practices to remove unused code.
JavaScript requests per page
One of the contributing factors towards slow rendering of the web page could be the requests made on the page, especially when they are blocking requests. It’s therefore of interest to look at the number of JavaScript requests made per page on both desktop and mobile devices.
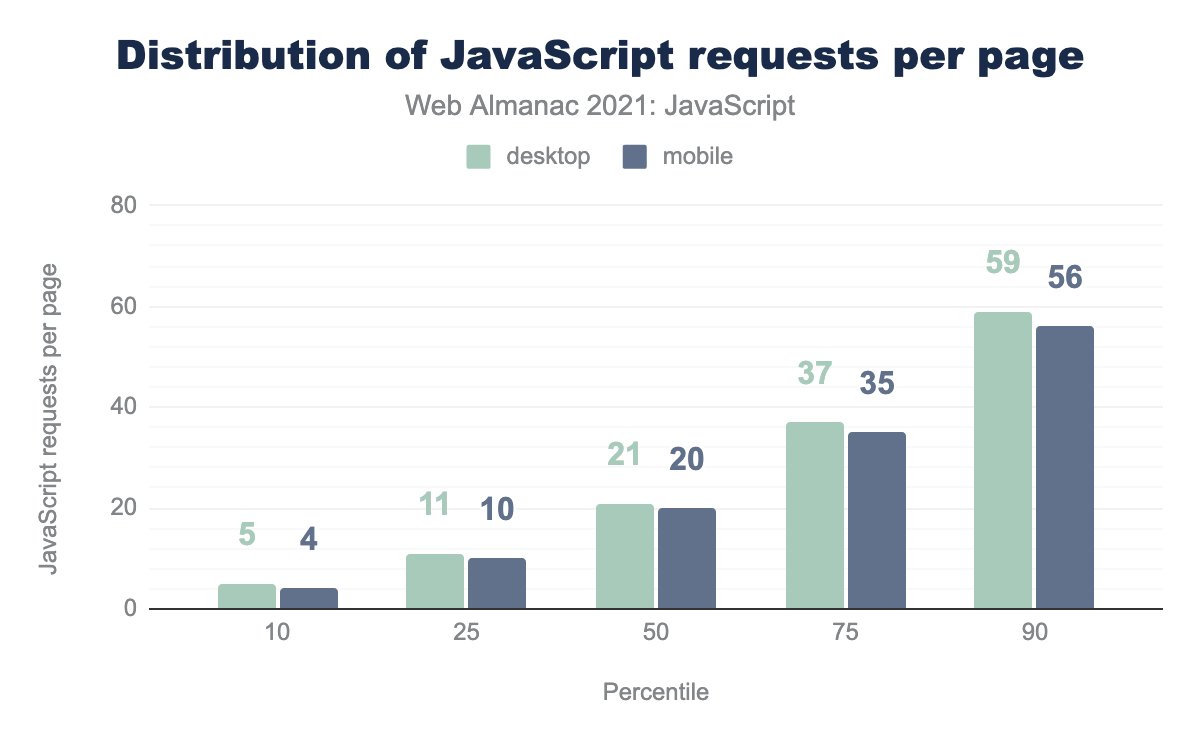
The median desktop page loads 21 JavaScript resources (.js and .mjs requests), going up to 59 resources at the 90th percentile.
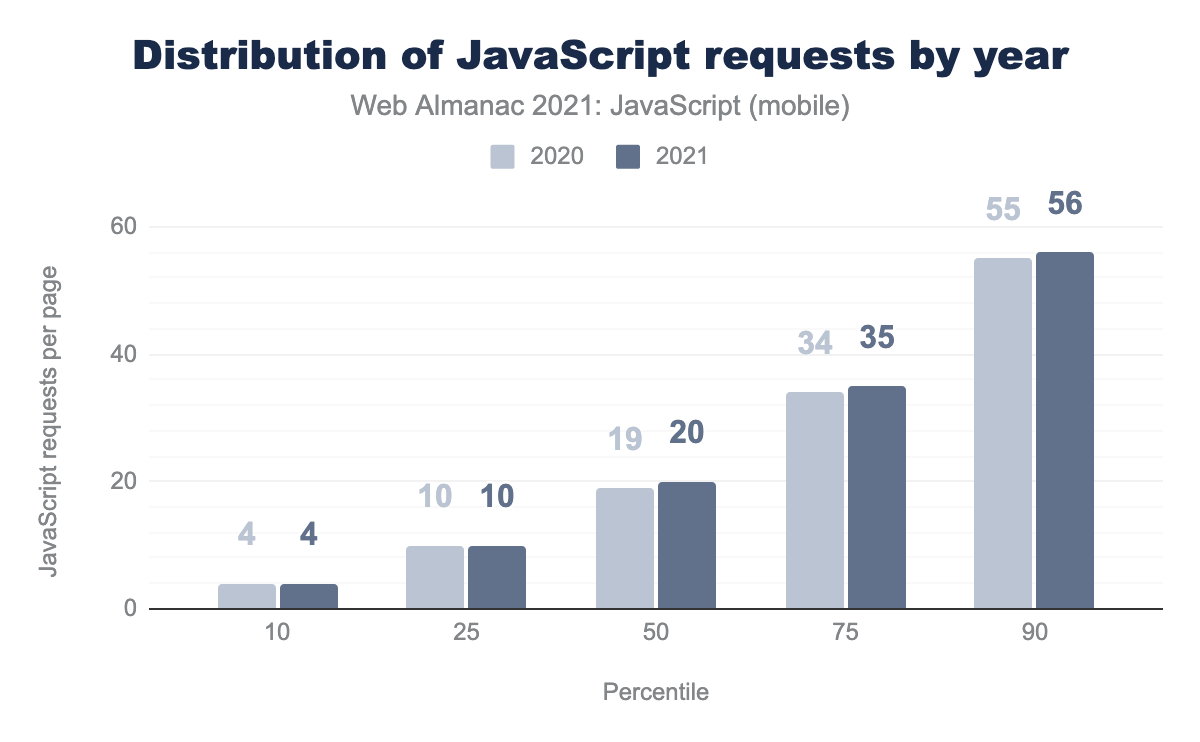
As compared with last year’s results, there has been a marginal increase in the number of JavaScript resources requested in 2021, with the median number of JavaScript resources loaded being 20 for desktop pages and 19 for mobile.
The trend is gradually increasing in the number of JavaScript resources loaded on a page. This would make one wonder if the number should actually increase or decrease considering that fewer JavaScript requests might lead to better performance in some cases but not in others.
This is where the recent advances in the HTTP protocol come in and the idea of reducing the number of JavaScript requests for better performance gets inaccurate. With the introduction of HTTP/2 and HTTP/3, the overhead of HTTP requests has been significantly reduced, so requesting the same resources over more requests is not necessarily a bad thing anymore. To learn more about these protocols, see the HTTP chapter.
How is JavaScript requested?
JavaScript can be loaded into a page in a number of different ways, and how it is requested can influence the performance of the page.
module and nomodule
When loading a website, the browser renders the HTML and requests the appropriate resources. It consumes the polyfills referenced in the code for the effective rendering and functioning of the page. Modern browsers that support newer syntax like arrow functions and async functions do not need loads of polyfills to make things work and therefore, should not have to.
This is when differential loading takes care of things. Specifying the type="module" attribute would serve the modern browsers the bundle with modern syntax and fewer polyfills, if any. Similarly, older browsers that lack support for modules will be served the bundle with required polyfills and transpiled code syntax with the type="nomodule" attribute. Read more about the usage of module/nomodule.
Let’s look at the data to understand the adoption of these attributes.
| Attribute | Desktop | Mobile |
|---|---|---|
module |
4.6% | 4.3% |
nomodule |
3.9% | 3.9% |
4.6% of desktop pages use the type="module" attribute, whereas only 3.9% of mobile pages use type="nomodule". This could be due to the fact that the mobile dataset being much larger contains more “long-tail” websites that might not be using the latest features.
It is important to note that with the end of support for IE 11 browser, differential loading is less applicable because evergreen browsers support modern JavaScript syntax. The Angular framework, for example, removed support for legacy browsers in Angular v13, which was released November 2021.
async and defer
JavaScript loading could be render-blocking unless it is specified as asynchronous or deferred. This is one of the contributing factors to slow performance, as oftentimes JavaScript (or at least some of it) is needed for the initial render.
However, loading the JavaScript asynchronously or deferred helps in some ways to improve this experience. Both the async and defer attributes load the scripts asynchronously. The scripts with the async attribute are executed irrespective of the order in which they are defined, however, defer executes the scripts only after the document is completely parsed, ensuring that their execution will take place in the specified order. Let’s look at how many pages actually specify these attributes for the JavaScript requested in the browser.
| Attribute | Desktop | Mobile |
|---|---|---|
async |
89.3% | 89.1% |
defer |
48.1% | 47.8% |
| Both | 35.7% | 35.6% |
| Neither | 10.3% | 10.4% |
async and defer.
There was an anti-pattern observed in last year’s results that some websites use both async and defer attributes on the same script, which falls back to async if the browser supports it and using defer for IE 8 and IE 9 browsers. This is, however, unnecessary now for most of the sites since async takes precedence on all supported browsers and. In turn, this pattern interrupts HTML parsing instead of deferring until the page has loaded. The usage was so frequent that 11.4% of mobile pages were seen with at least one script with async and defer attributes used together. The root causes were found and an action item was also taken down to remove such usage going forward.
async and defer attributes are set on the same script.
This year, we found that 35.6% of mobile pages use the async and defer attributes together. The large discrepancy from last year is due to a methodological improvement to measure attribute usage at runtime, rather than parsing the static contents of the initial HTML. This difference shows that many pages update these attributes dynamically after the document has already been loaded. For example, one website was found to include the following script:
<!-- Piwik -->
<script type="text/javascript">
  (function() {
      var d=document, g=d.createElement('script'), s=d.getElementsByTagName('script')[0];
      g.type='text/javascript'; g.async=true; g.defer=true; g.src=u+'piwik.js'; s.parentNode.insertBefore(g,s);
  })();
</script>
<!-- End Piwik Code -->
So, what is Piwik? According to its Wikipedia entry:
Matomo, formerly Piwik, is a free and open source web analytics application developed by a team of international developers, that runs on a PHP/MySQL web server. It tracks online visits to one or more websites and displays reports on these visits for analysis. As of June 2018, Matomo was used by over 1,455,000 websites, or 1.3% of all websites with known traffic analysis tools…
This information strongly suggests that much of the increase we observed may be due to similar marketing and analytics providers that dynamically inject these async and defer scripts into the page later than had been previously detected.
async and defer attribute together.
Even though a large percentage of pages use this anti-pattern, it turns out that only 2.6% of all scripts use both async and defer on the same script element.
First-party vs third-party
Recall from the How much JavaScript do we load section that the median number of JavaScript requests on mobile pages is 20. In this section, we’ll take a look at the breakdown of first and third-party JavaScript requests.
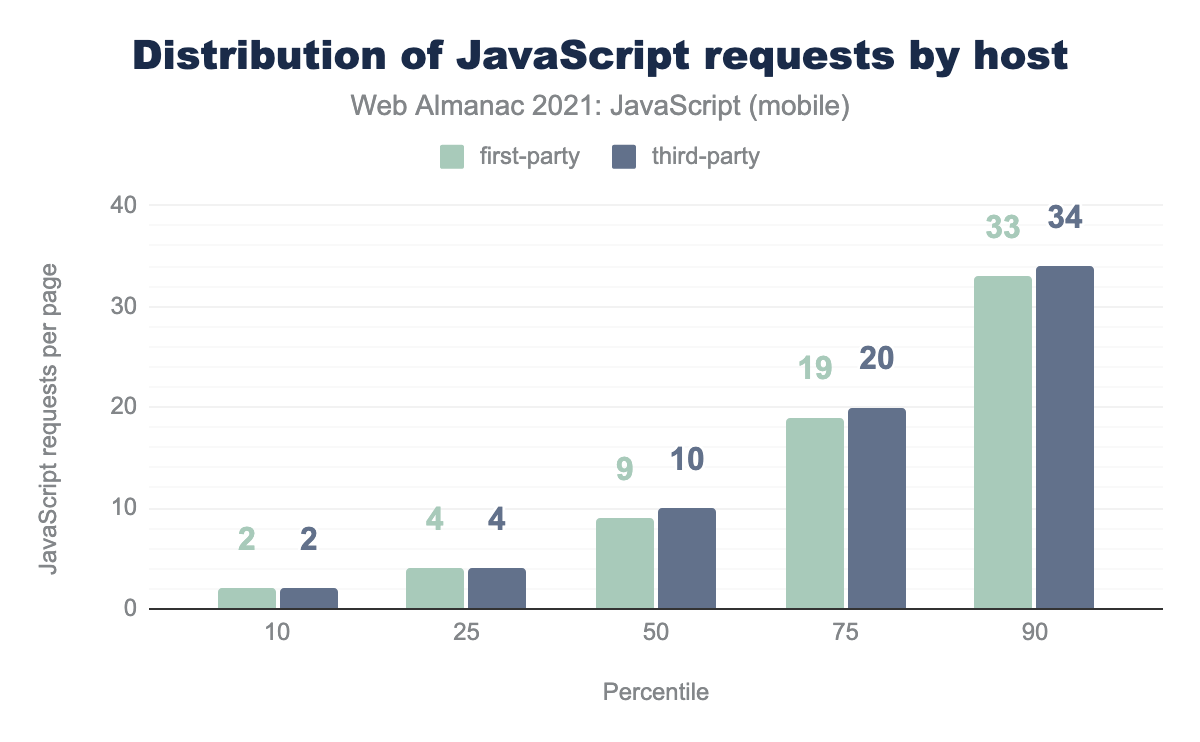
The median mobile page requests 10 third-party resources and 9 first-party requests. This difference increases as we move up to the 90th percentile as 33 requests on mobile pages are first-party but the number goes up to 34 for third-party requests for the mobile pages. Clearly, the number of third-party resources requested is always one step ahead of the first-party ones.
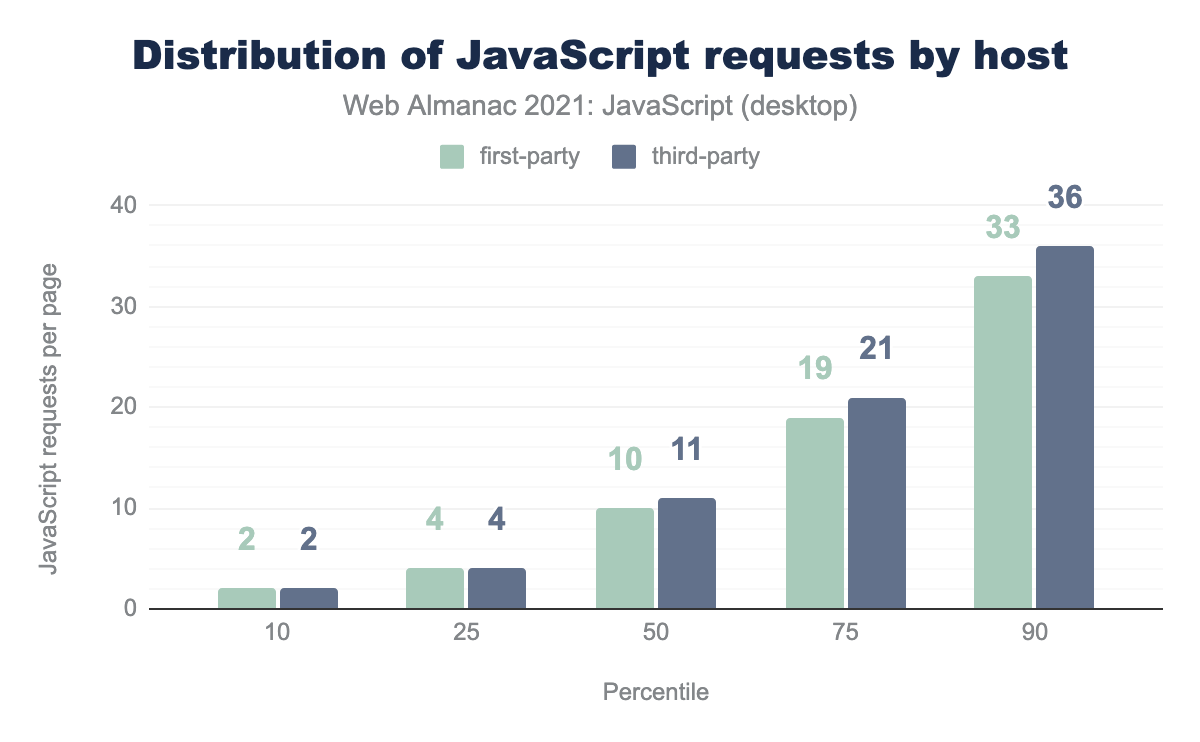
The median desktop page requests 11 third-party resources, compared to 10 first-party requests. Irrespective of the performance and reliability risks that third-party resources may bring, both desktop and mobile pages consistently seem to favor third-party scripts. This effect could be due to the useful interactivity features that third-party scripts give to the web.
Nevertheless, site owners must ensure that their third-party scripts are loaded performantly. Harry Roberts advocates for going a step further and stress testing third-parties for performance and resilience.
preload and prefetch
As a page is rendered, the browser downloads the given resources and prioritizes the download of some resources the browser uses over others using resource hints. The preload hint tells the browser to download the resource with a higher priority as it will be required on the current page. The prefetch hint, however, tells the browser that the resource could be required after some time (useful for future navigation) and it’d better to fetch it when the browser has the capacity to do so and make it available as soon as it is required. Learn more about how these features are used in the Resource Hints chapter.
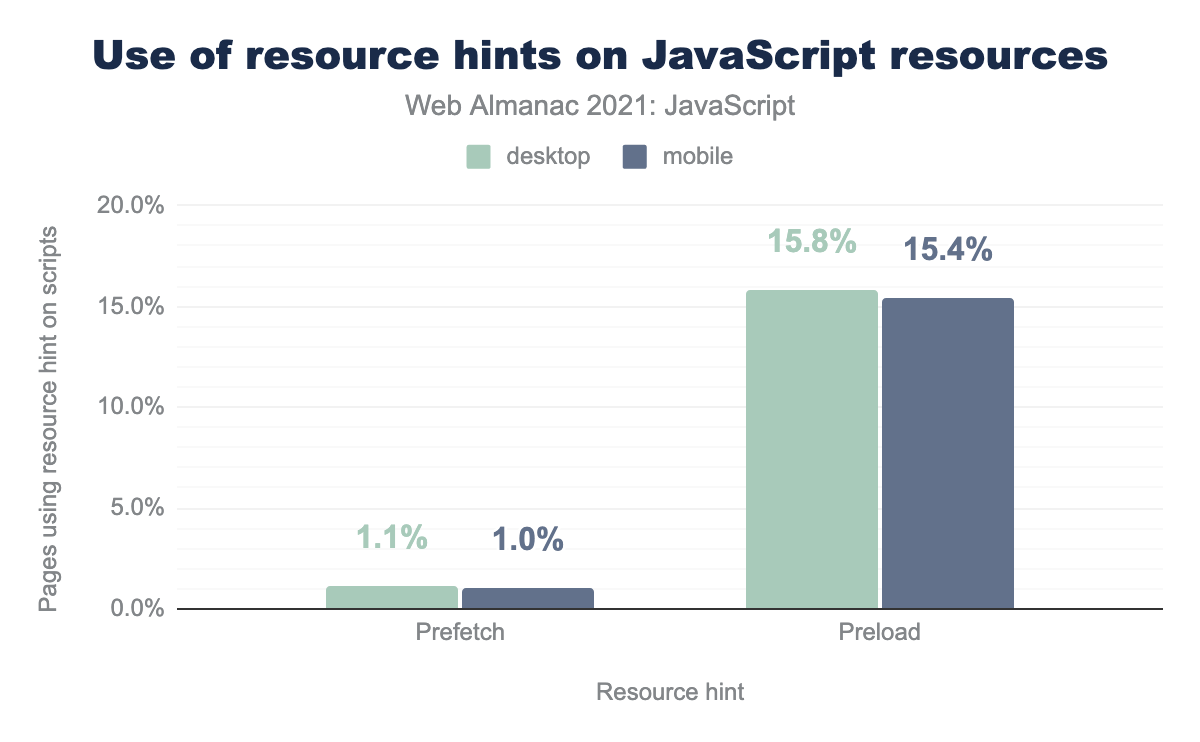
prefetch resource hint on one or more JavaScript resources, and 15.8% of desktop resources and 15.4% of mobile pages use preload on one or more JavaScript resources.preload hints are used to load JavaScript on 15.4% of mobile pages, whereas only 1.0% of mobile pages use the prefetch hint. 15.8% and 1.1% of desktop pages use these resource hints to load JavaScript resources, respectively.
It would also be useful to see how many preload and prefetch hints are used per page, as that affects the impact of these hints. For example, if there are five resources to be loaded on the render and all five use the preload hint, the browser would try to prioritize every resource, which would effectively work as if no preload hint was used at all.
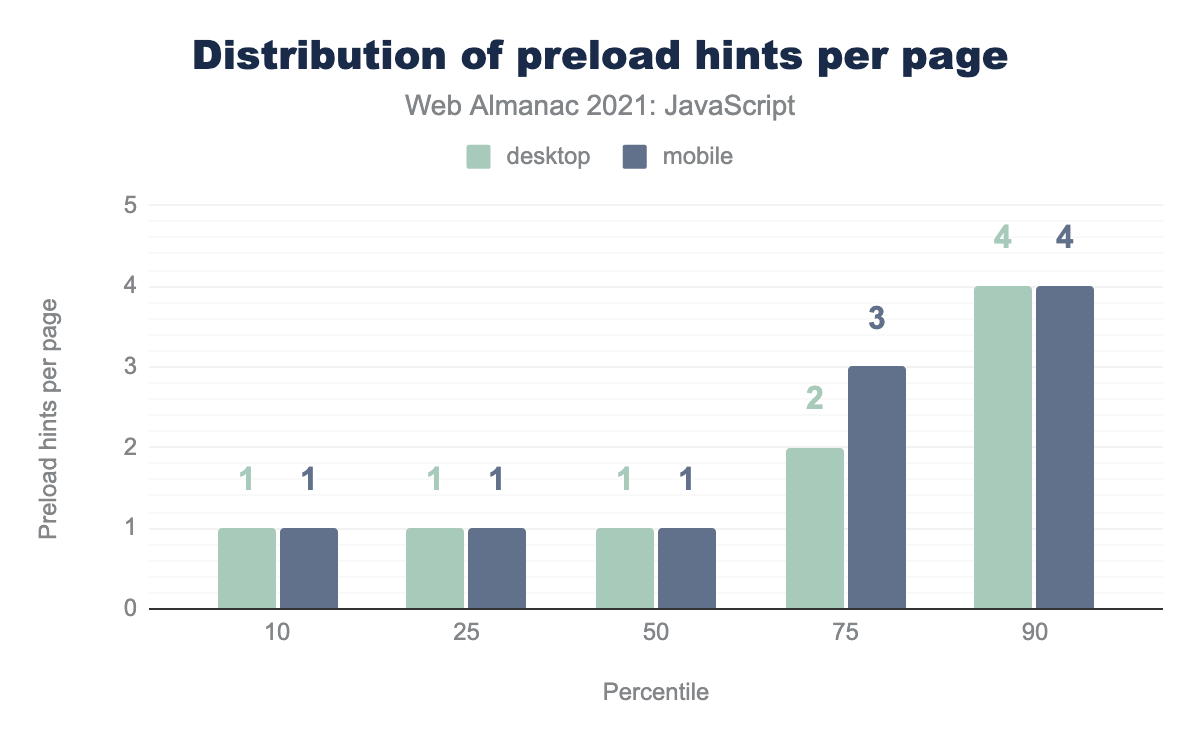
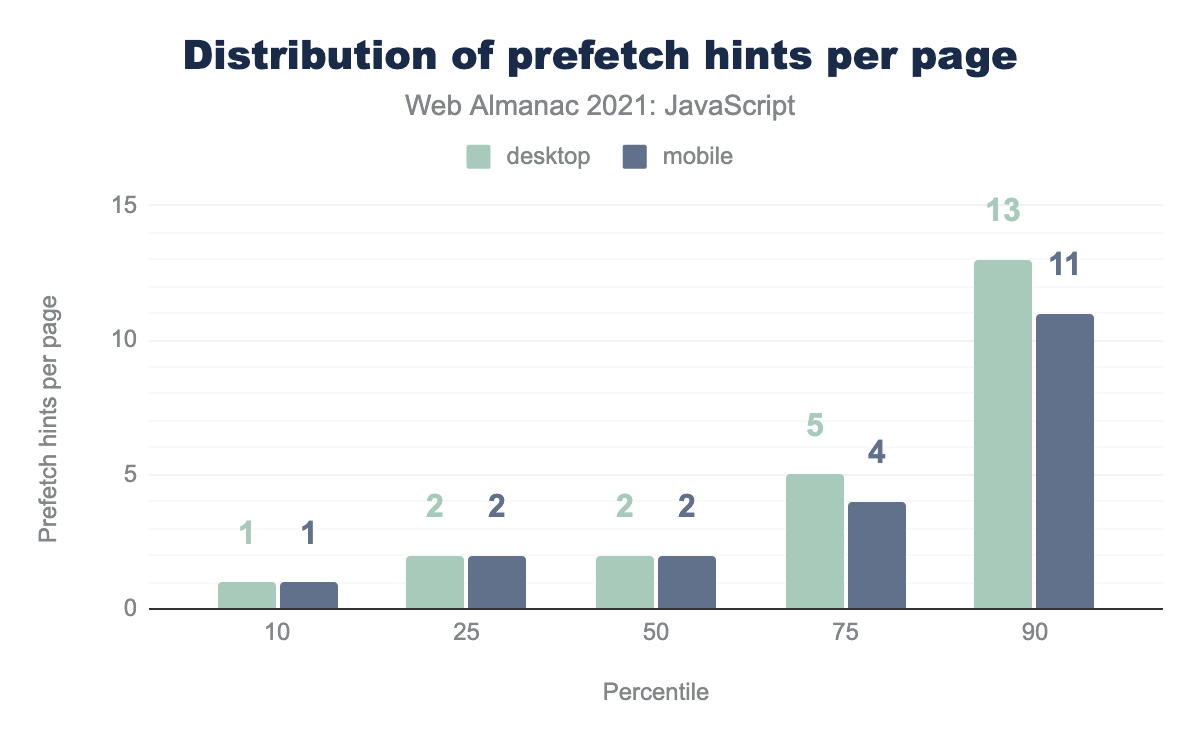
The median desktop page loads one JavaScript resource with the preload hint and two JavaScript resources with the prefetch hint.
| Hint | 2020 | 2021 |
|---|---|---|
preload |
1 | 1 |
prefetch |
3 | 2 |
preload and prefetch hints for JavaScript resources per mobile page.
While the median number of preload hints per mobile page has stayed the same, the number of prefetch hints has decreased from three to two per page. Note that at the median, these results are identical for both mobile and desktop pages.
How is JavaScript delivered?
JavaScript resources can be loaded more efficiently over the network with compression and minification. In this section, we’ll explore the usage of both techniques to better understand the extent to which they’re being utilized effectively.
Compression
Compression is the process of reducing the file size of a resource as it gets transferred over the network. This can be an effective way to improve the download times of JavaScript resources, which are highly compressible. For example, the almanac.js script loaded on this page is 28 KB, but only 9 KB over the wire thanks to compression. You can learn more about the ways resources are compressed across the web in the Compression chapter.
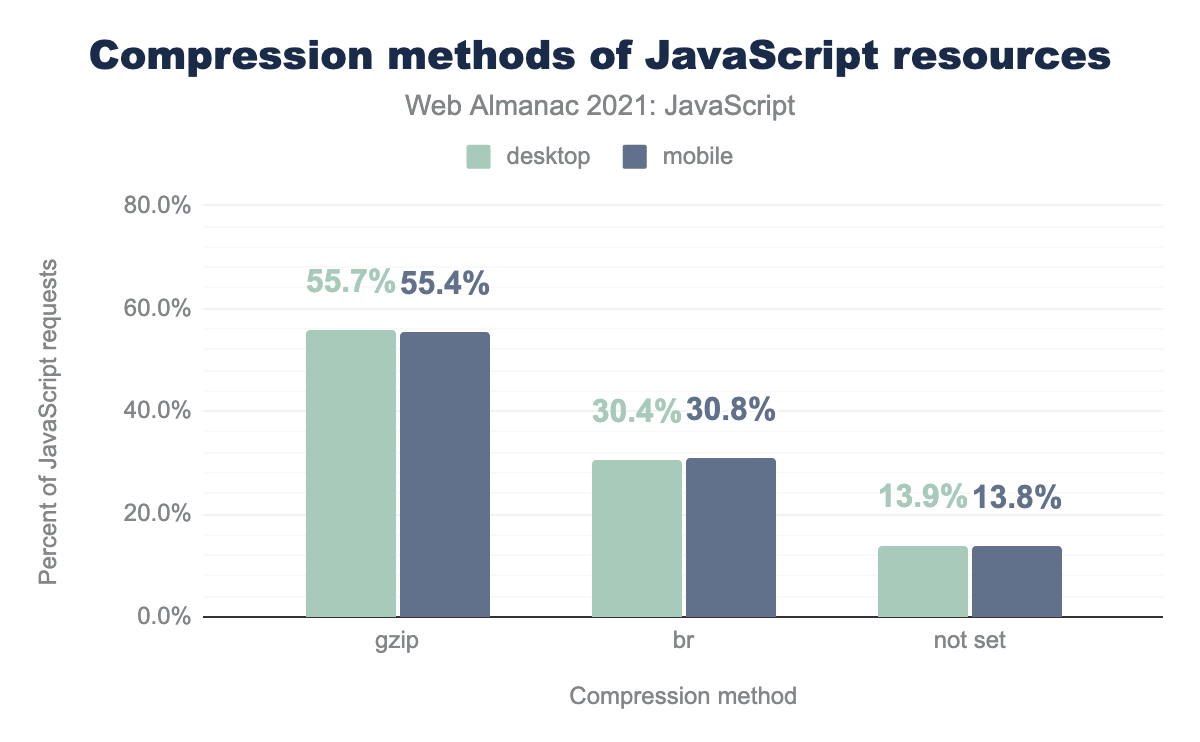
Most JavaScript resources are either compressed using Gzip, Brotli (br), or not compressed at all (not set). 55.4% of mobile JavaScript resources use Gzip, whereas 30.8% of resources are compressed with Brotli.
Interestingly, compared to the state of JavaScript compression in 2019, Gzip has gone down by almost 10 percentage points and Brotli has increased by 16 percentage points. The trend illustrates the shift to focus on smaller size files with higher levels of compression that Brotli provides as compared to Gzip.
To help explain this change, we analyzed the compression methods of first and third-party resources.
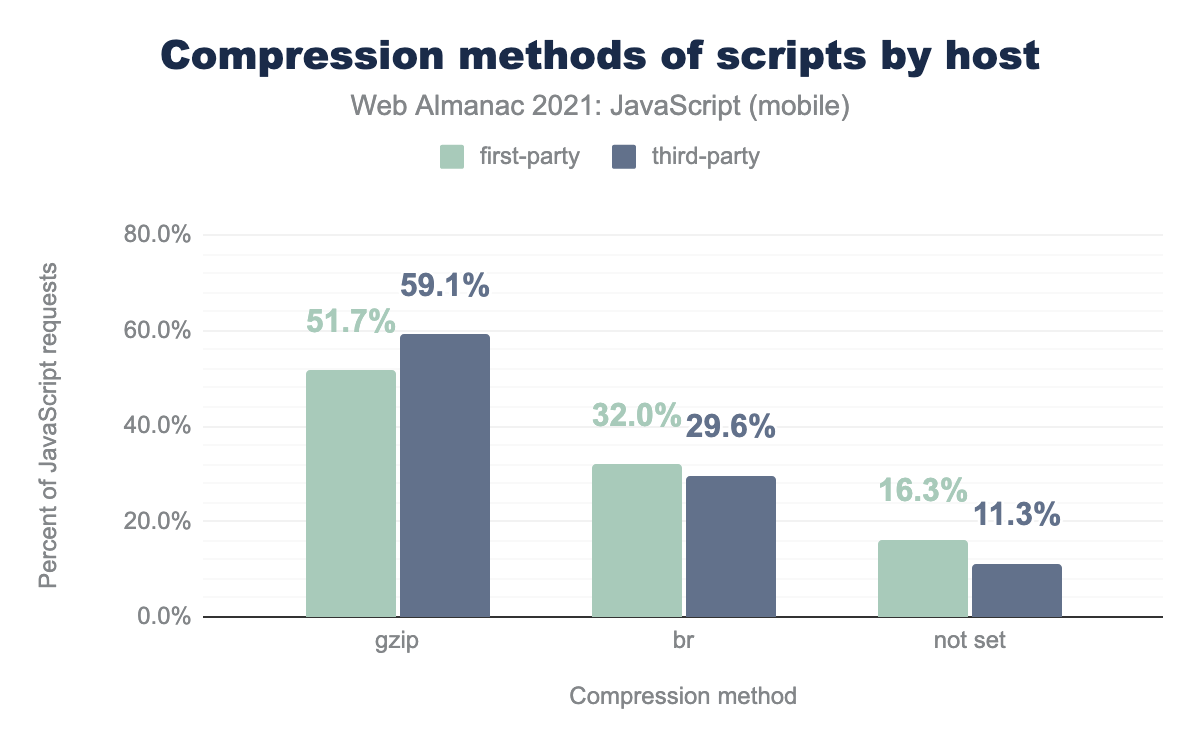
59.1% of third-party scripts on mobile pages are gzipped and 29.6% are compressed with Brotli. Looking at first-party scripts, these are 51.7% with Gzip compression but only 32.0% with Brotli. There are still 11.3% of third-party scripts that do not have any compression method defined.
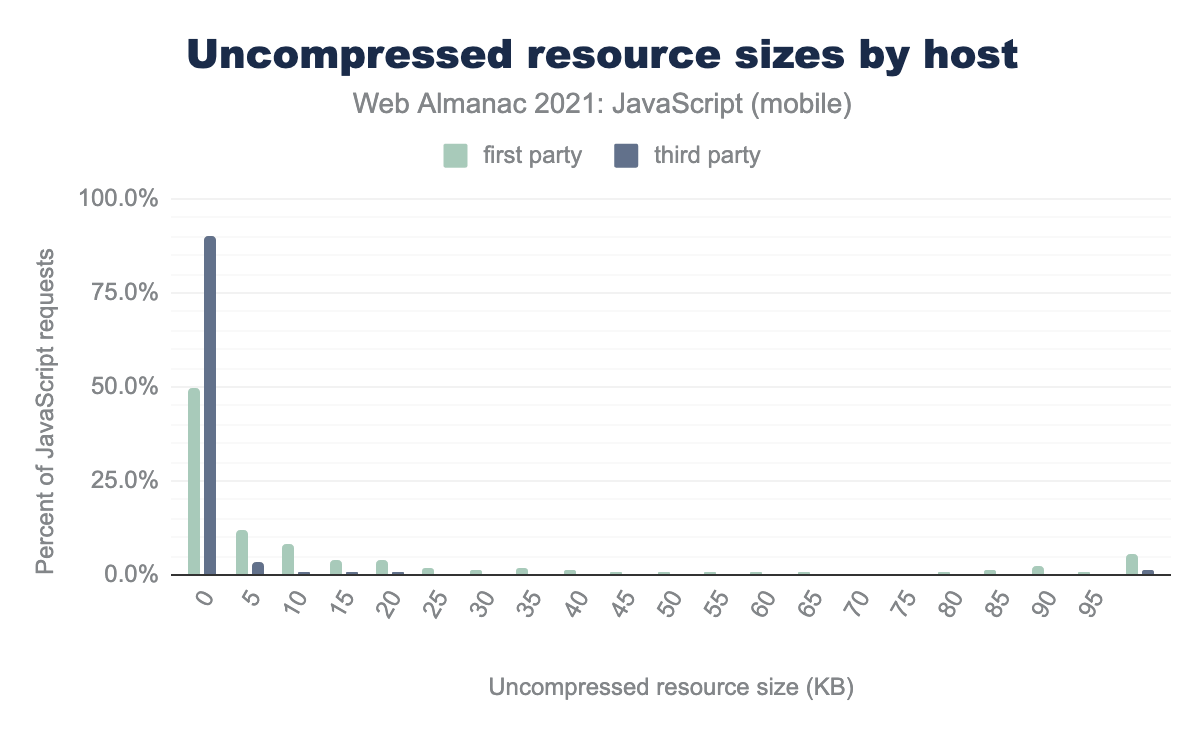
90% of uncompressed third-party JavaScript resources are less than 5 KB, though first-party requests trail a bit. This may help explain why so many JavaScript resources go uncompressed. Due to the diminishing returns of compressing small resources, a small script may cost more in terms of the resource consumption of server-side compression and client-side decompression than the performance benefits of saving a few bytes over the network.
Minification
While compression only changes the transfer size of JavaScript resources over the network, minification actually makes the code itself smaller and more efficient. This not only helps to reduce the load time of the script but also the amount of time the client spends parsing the script.
The unminified JavaScript Lighthouse audit highlights the opportunities of minification.
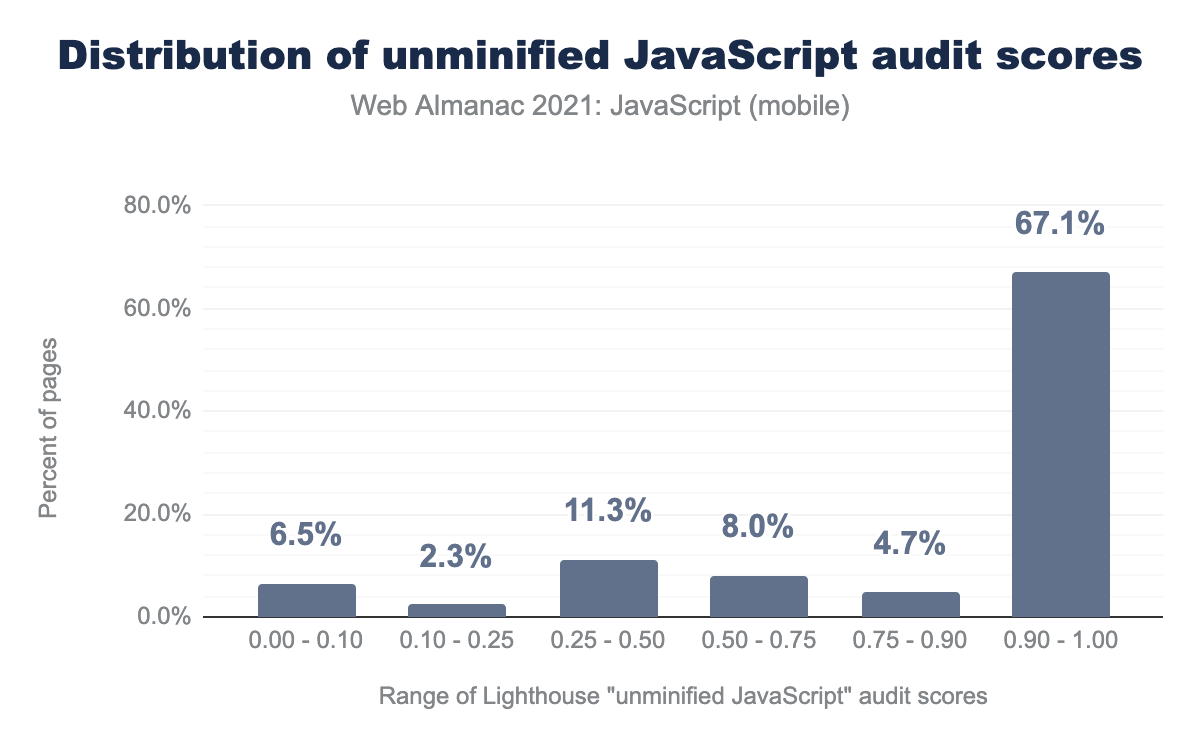
Here, 0.00 represents the worst score whereas 1.00 represents the best score. 67.1% of mobile pages have an audit score between 0.9 and 1.0. That means there are still more than 30% of pages that have an unminified JavaScript score worse than 0.9 and could make better use of code minification. Compared to the results from the 2020 edition, the percent of mobile pages with an “unminified JS” score between 0.9 and 1.0 fell by 10 points.
To understand the reason for the worse scores this year, let’s dive deeper to look at how many bytes per page are unminified.
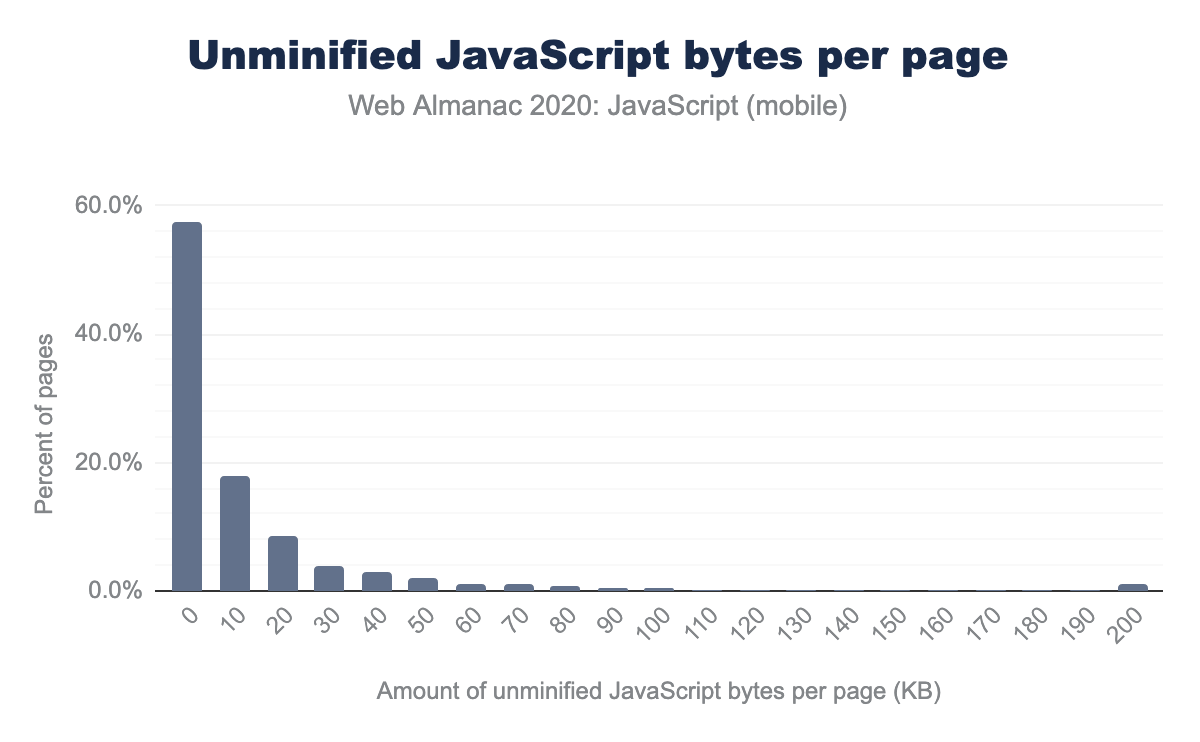
57.4% of mobile pages have 0 KB of unminified JavaScript as reported by the Lighthouse audit. 17.9% of mobile pages have between 0 and 10 KB of unminified JavaScript. The rest of the pages have an increasing number of unminified JavaScript bytes and correspond to those having poor “unminified JavaScript” audit scores in the previous chart.
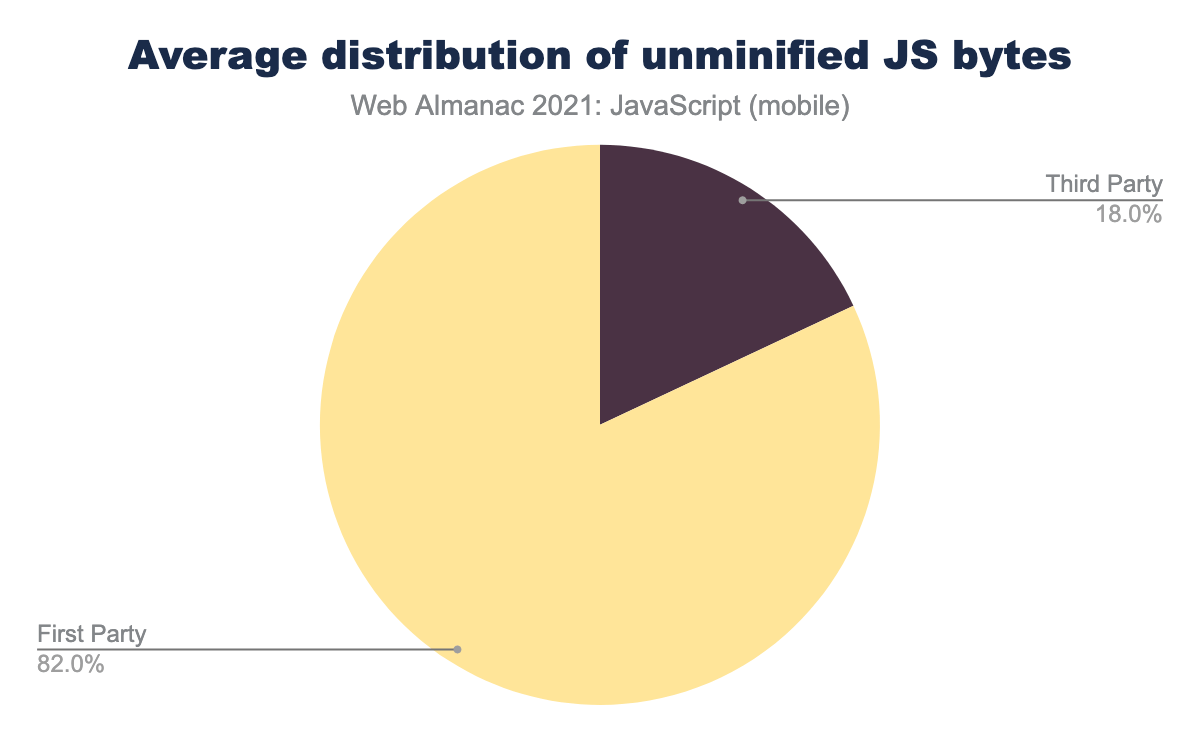
When we segmented the unminified JavaScript resources by host, we found that 82.0% of the average mobile page’s unminified JavaScript bytes actually come from first-party scripts.
Source maps
Source maps are hints sent along with JavaScript resources that allow the browser to map the minified resource back to their source code. This is especially helpful to web developers for debugging in a production environment.
SourceMap header.
Only 0.1% of mobile pages use the SourceMap response header on script resources. One reason for this extremely small percentage could be that not many sites choose to put their original source code in production through the source map.
SourceMap header that are first-party resources.
98.0% of the SourceMap usage on JavaScript resources can be attributed to first-parties. Only 2.0% of scripts with the header on mobile pages are third-party resources.
Libraries and frameworks
The usage of JavaScript seems to have increased tremendously over the years, with the adoption of many new libraries and frameworks all promising their own unique improvements to the developer and user experiences. They have become so prevalent that the term framework fatigue was coined to describe developers’ struggle just to keep up. In this section, we’ll look at the popularity of the JavaScript libraries and frameworks in use on the web today.
Libraries usage
To understand the usage of libraries and frameworks, HTTP Archive uses Wappalyzer to detect the technologies used on a page.
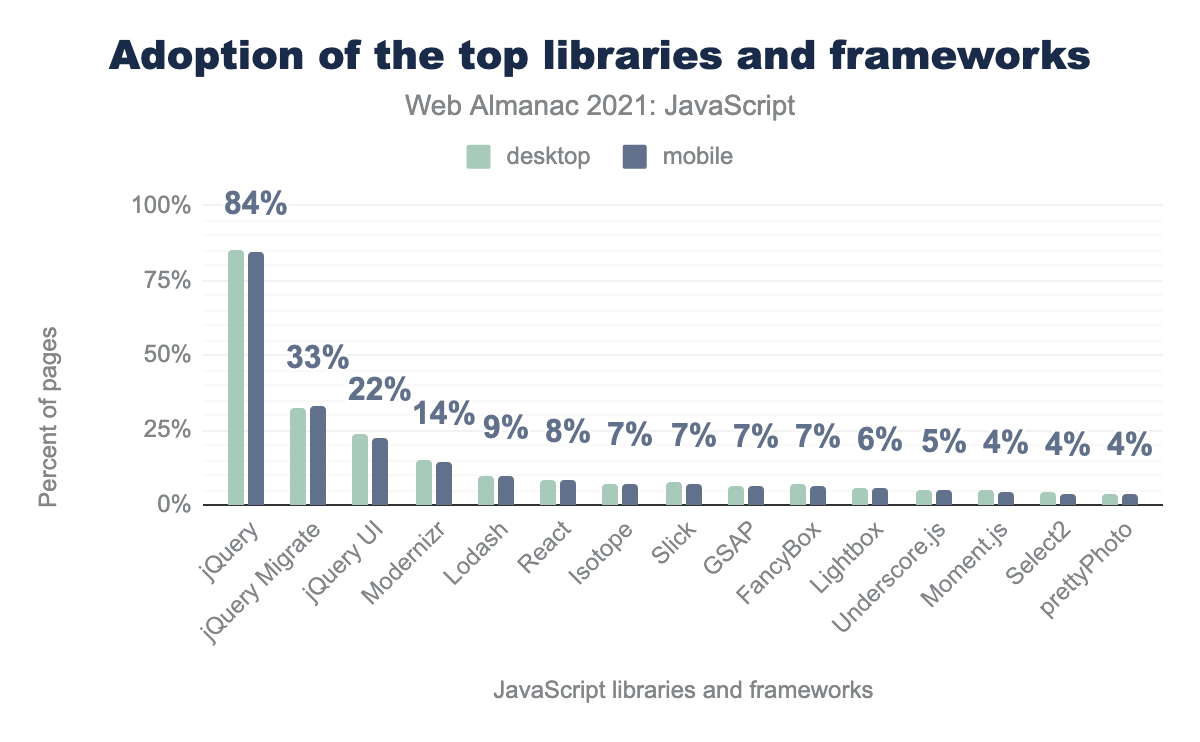
jQuery remains the most popular library, used by a staggering 84% of mobile pages. React usage has jumped from 4% to 8% since last year, which is a significant increase. React’s increase may be partially due to recent detection improvements to Wappalyzer, and may not necessarily reflect the actual change in adoption. It’s also worth noting that Isotope, which uses jQuery, is found on 7% of pages, leading to RequireJS falling out of the top spots on just 2% of pages.
You might wonder why jQuery is still so dominant in 2021. There are two main reasons for this. First, as highlighted over the previous years, most WordPress sites use jQuery. Given that WordPress is used on nearly a third of all websites, according to the CMS chapter, this accounts for a huge proportion of jQuery adoption. Second, several of the other top-used JavaScript libraries still rely on jQuery in some way under the hood, contributing to indirect adoption of the library.
The most popular version of jQuery is 3.5.1, which is used by 21.3% of mobile pages. The next most popular version of jQuery is 1.12.4, at 14.4% of mobile pages. The leap to version 3.0 can be explained by a change to WordPress core in 2020, which upgraded the default version of jQuery from 1.12.4 to 3.5.1.
Libraries used together
Now let’s look at how the popular frameworks and libraries are used together on the same page.
| Frameworks and libraries | Desktop | Mobile |
|---|---|---|
| jQuery | 16.8% | 17.4% |
| jQuery, jQuery Migrate | 8.4% | 8.7% |
| jQuery, jQuery UI | 4.0% | 3.7% |
| jQuery, jQuery Migrate, jQuery UI | 2.6% | 2.5% |
| Modernizr, jQuery | 1.6% | 1.6% |
| FancyBox, jQuery | 1.1% | 1.1% |
| Slick, jQuery | 1.2% | 1.1% |
| Lightbox, jQuery | 1.1% | 0.8% |
| React, jQuery, jQuery Migrate | 0.9% | 0.9% |
| Modernizr, jQuery, jQuery Migrate | 0.8% | 0.9% |
The most widely-used combination of JavaScript libraries and frameworks doesn’t actually consist of multiple libraries at all! When used by itself, jQuery is found on 17.4% of mobile pages. The next most popular combination is jQuery and jQuery Migrate, which is used on 8.7% of mobile pages. In fact, all of the top 10 library and framework combinations include jQuery.
Security vulnerabilities
Using JavaScript libraries can come with its own benefits and drawbacks. When using these libraries, one drawback is that older versions may include security risks like Cross Site Scripting (XSS). Lighthouse detects the JavaScript libraries used on a page and fails the audit if their version has any known vulnerabilities in the open-source Snyk vulnerability database.
63.9% of mobile pages use a JavaScript library or framework with a known security vulnerability. For context, this number has come down from 83.5% since last year.
| Library or framework | Percent of pages |
|---|---|
| jQuery | 57.6% |
| Bootstrap | 12.2% |
| jQuery UI | 10.5% |
| Underscore | 6.4% |
| Lo-Dash | 3.1% |
| Moment.js | 2.3% |
| GreenSock JS | 1.8% |
| Handlebars | 1.3% |
| AngularJS | 1.0% |
| Mustache | 0.7% |
| jQuery Mobile | 0.5% |
| Dojo | 0.5% |
| Angular | 0.4% |
| Vue | 0.2% |
| Knockout | 0.2% |
| Highcharts | 0.1% |
| Next.js | 0.0% |
| React | 0.0% |
When we segment the percent of mobile pages by library and framework, we can see that jQuery is largely responsible for the decrease in vulnerabilities. This year JavaScript vulnerabilities were found on 57.6% of pages with jQuery, compared to 80.9% last year. As predicted by Tim Kadlec in the 2020 edition of this chapter, “if we can get folks to migrate away from those outdated, vulnerable versions of jQuery, we would see the number of sites with known vulnerabilities plummet”. And that’s exactly what happened; WordPress migrated from jQuery version 1.12.4 to the more secure version 3.5.1, contributing to a 20 point drop in the percent of pages with known JavaScript vulnerabilities.
How do we use JavaScript?
Now that we’ve looked at how we get the JavaScript, what are we using it for?
AJAX
One way that JavaScript is used is to communicate with servers to asynchronously receive information in various formats. Asynchronous JavaScript and XML (AJAX) is typically used to send and receive data, and it supports more than just XML, including JSON, HTML, and text formats.
With multiple ways to send and receive data on the web, let’s look at how many asynchronous requests are sent per page.
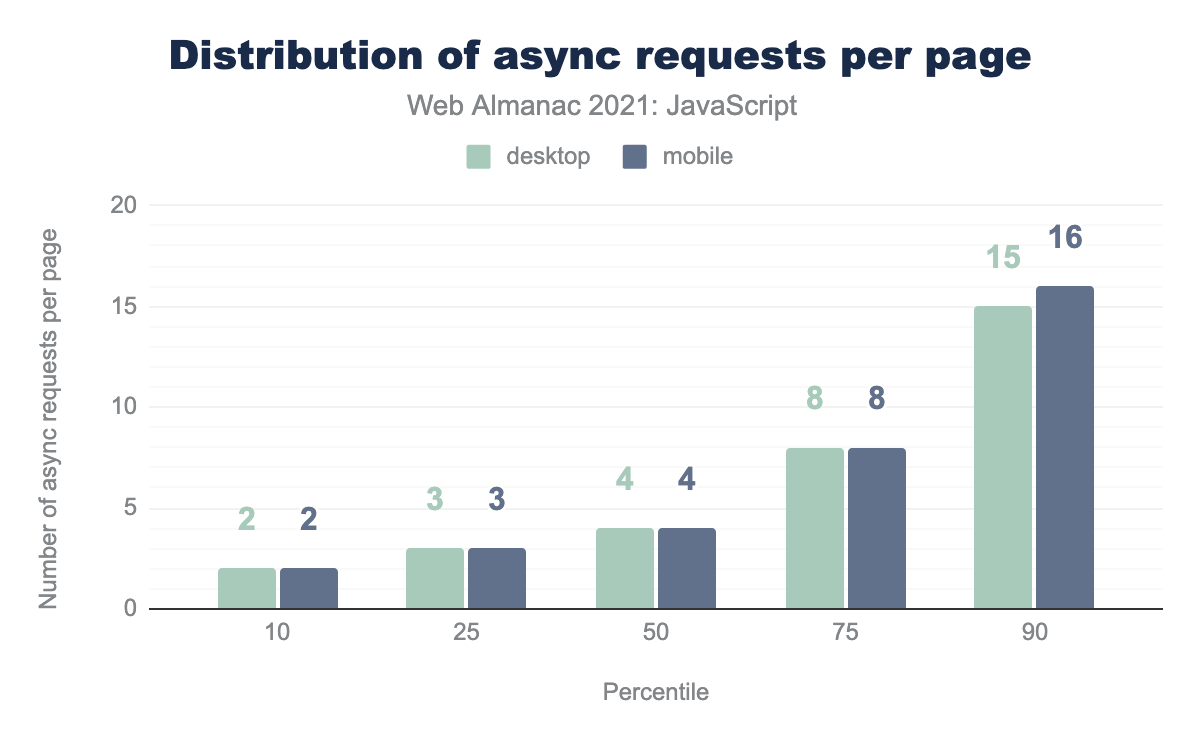
The median mobile page makes 4 asynchronous requests. If we look at the long tail, the largest number of asynchronous requests on desktop pages is 623, which is eclipsed by the biggest mobile page, which makes 867 asynchronous requests!
An alternative to the asynchronous AJAX requests are the synchronous requests. Rather than passing a request to a callback, they block the main thread until the request completes.
However, this practice is discouraged due to the potential for poor performance and user experiences, and many browsers already warn about such usage. It would be intriguing to see how many pages still use synchronous AJAX requests.
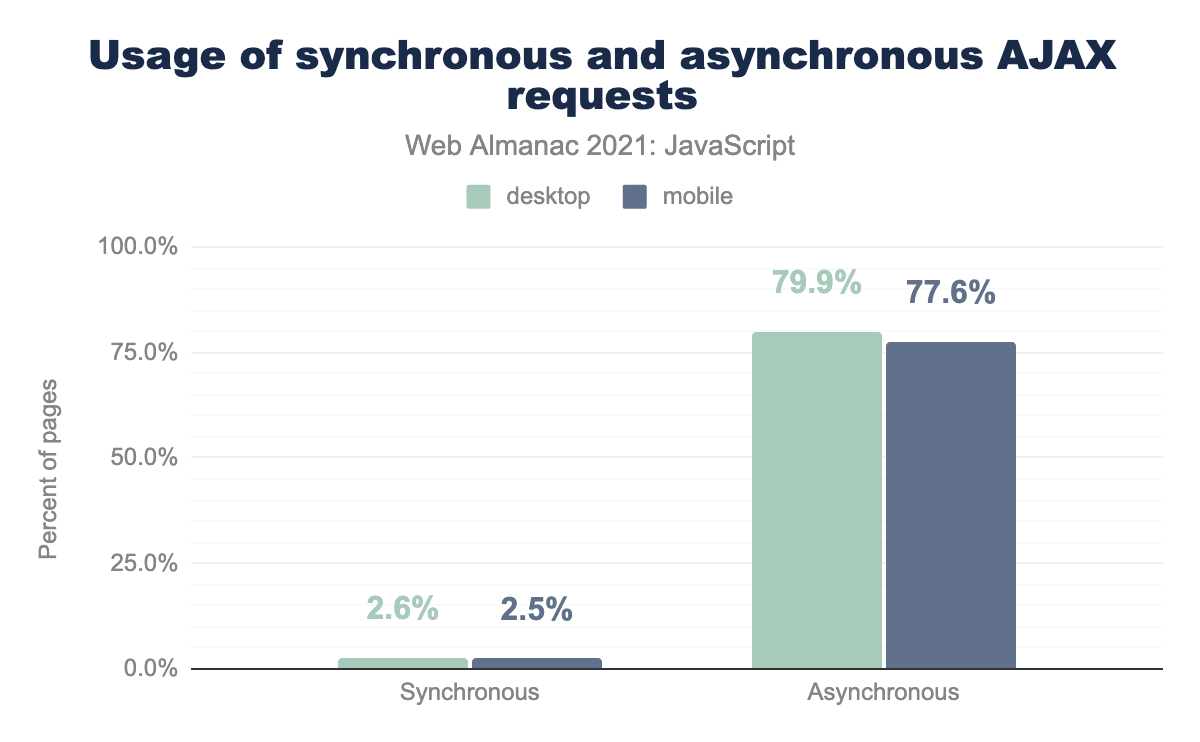
2.5% of mobile pages use the deprecated synchronous AJAX requests. To put this into perspective, let’s look at the trend by comparing the results with the last two years.
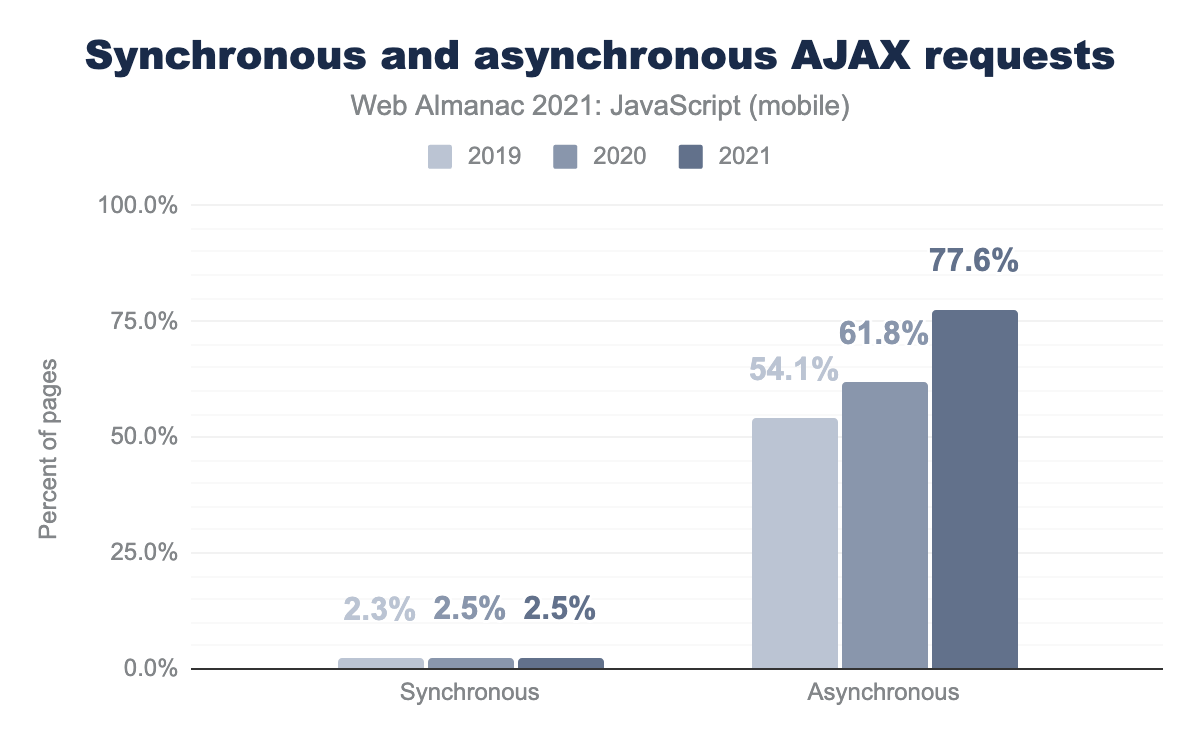
We see that there is a clear increase in the usage of asynchronous AJAX requests. However, there isn’t a significant decline in the usage of synchronous AJAX requests.
Knowing the number of AJAX requests per page now, we’d also be interested in knowing the most commonly used APIs to request the data from the server.
We can broadly classify these AJAX requests into three different APIs and dig in to see how they’re used. The core APIs XMLHttpRequest (XHR), Fetch, and Beacon are used commonly across websites with XHR being used primarily, however Fetch is gaining popularity and growing rapidly while Beacon has low usage.
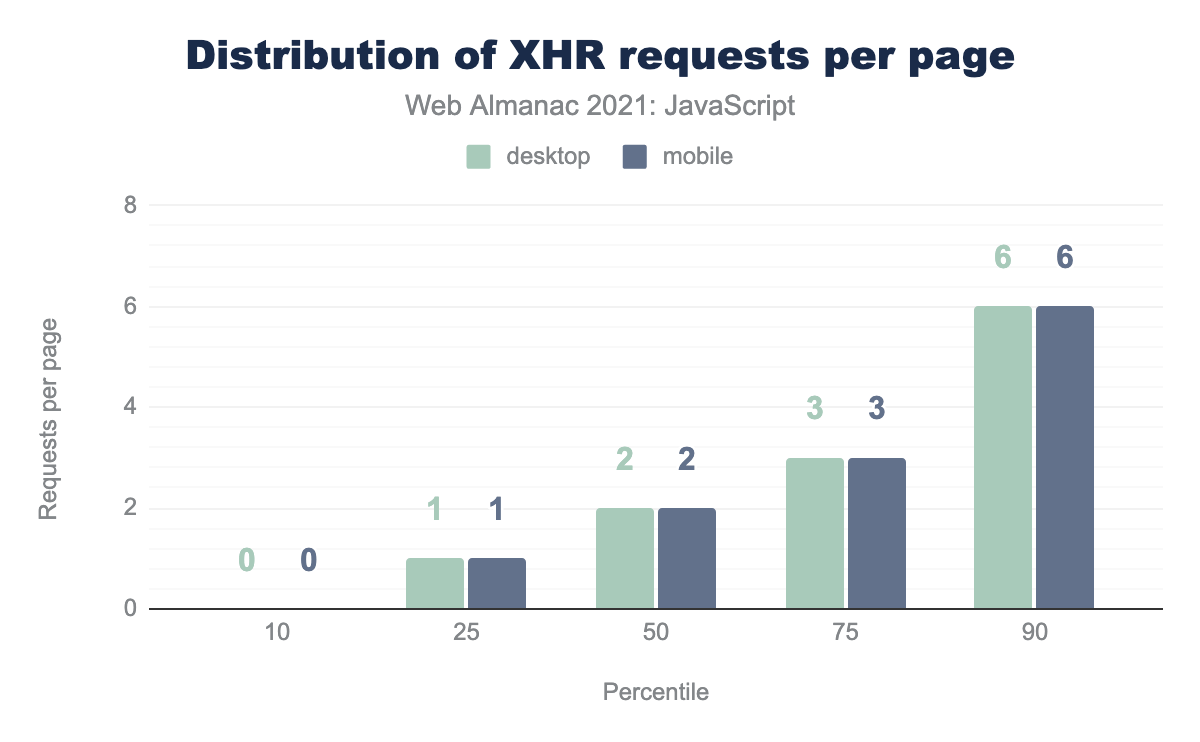
The median mobile page makes 2 XHR requests, but at 90th percentile, makes 6 XHR requests.
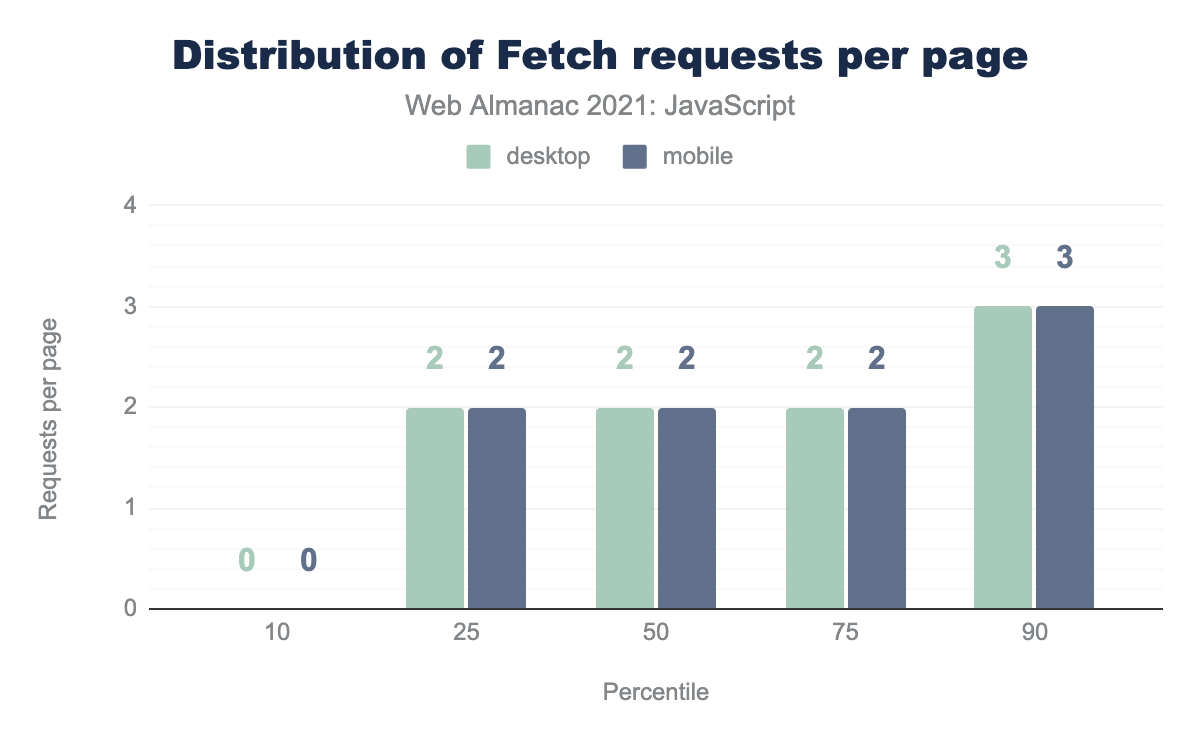
Fetch requests per page.
In the case of the usage of the Fetch API, the median mobile page makes 2 requests, and in the long tail, reaches 3 requests. This API is becoming the standard XHR way of making requests, due in part to its cleaner approach and less boilerplate code. There may also be performance benefits to Fetch over the traditional XHR approach, due to the way browsers can decode large JSON payloads off the main thread.
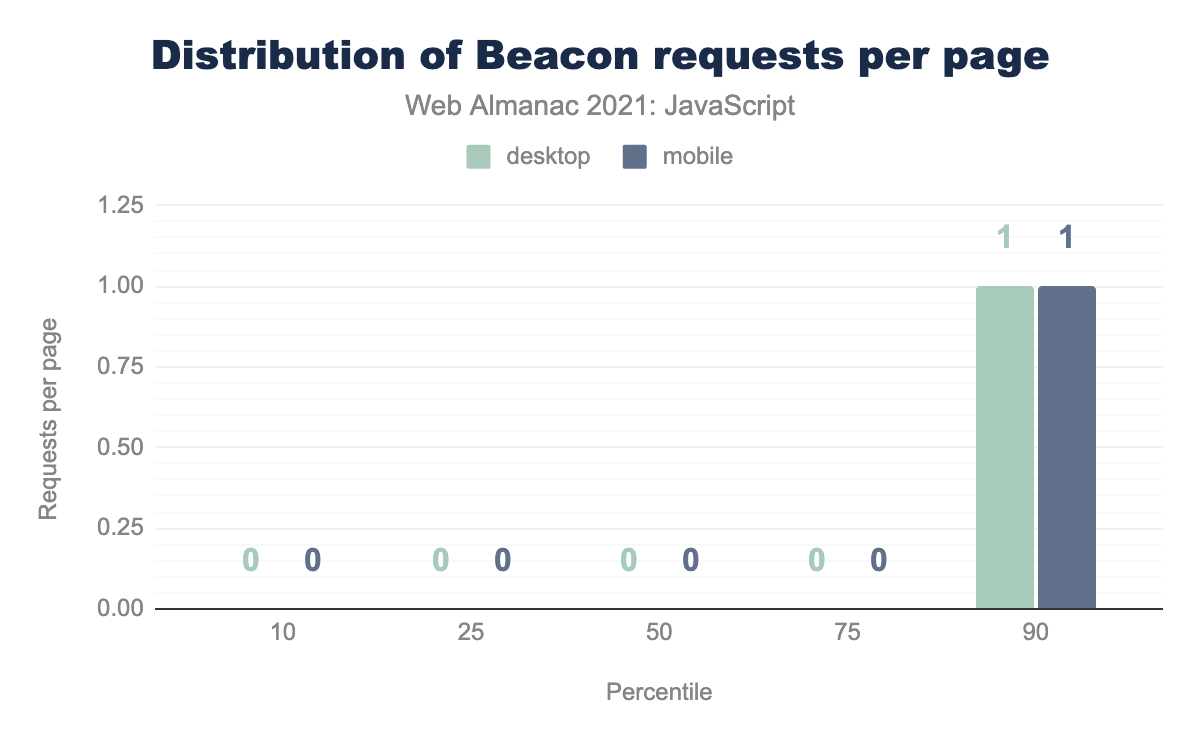
Beacon requests per page.
Beacon usage is almost non-existent, with 0 requests per page until the 90th percentile, at which there’s only one request per page. One possible explanation for this low adoption could be that Beacon is typically used for sending analytics data, especially when one wants to ensure that the request is sent even if the page might unload soon. This is, however, not guaranteed when using XHR. A good experiment for the future would be to see if some statistics could be collected around any pages using XHR for analytics data, session data, etc.
It would be interesting to also compare the adoption of XHR and Fetch over time.
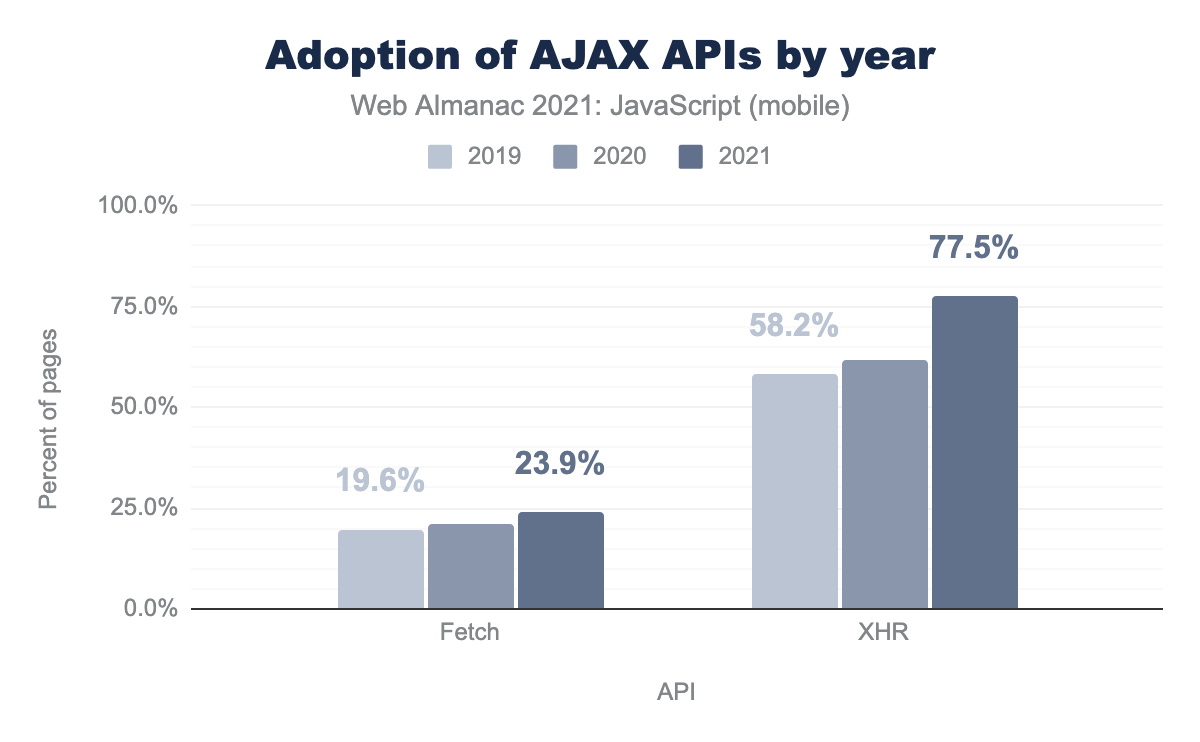
For both Fetch and XHR, the usage has increased significantly over the years. Fetch usage on mobile pages is up 4 points and XHR is up 19 points. The gradual increase of Fetch adoption seems to point towards a trend of cleaner requests and better response handling.
Web Components and the shadow DOM
With the web becoming componentized, a developer building a single page application may think about a user view as a set of components. This is not only for the sake of developers building dedicated components for each feature, but also to maximize component reusability. It could be in the same app on a different view or in a completely different application. Such use cases lead to the usage of custom elements and web components in applications.
It would be justified to say that with many JavaScript frameworks gaining popularity, the idea of reusability and building dedicated feature-based components has been adopted more widely. This feeds our curiosity to look into the adoption of custom elements, shadow DOM, template elements.
Custom Elements are customized elements built on top of the HTMLElement API. Browsers provide a customElements API that allows developers to define an element and register it with the browser as a custom element.
3.0% of mobile pages use custom elements for one or more parts of the web page.
Shadow DOM allows you to create a dedicated subtree in the DOM for the custom element introduced to the browser. It ensures the styles and nodes inside the element are not accessible outside the element.
0.4% of mobile pages use shadow DOM specification of web components to ensure a scoped subtree for the element.
template elements.
A template element is very useful when there is a pattern in the markup which could be reused. The contents of template elements render only when referenced by JavaScript.
Templates work well when dealing with web components, as the content that is not yet referenced by JavaScript is then appended to a shadow root using the shadow DOM.
Fewer than 0.1% of web pages have adopted the use of templates. Although templates are well supported in browsers, there is still a very low percentage of pages using them.
Conclusion
The numbers that we have seen throughout the chapter have brought us to an understanding of how vast the JavaScript usage is and how it’s evolving over time. The JavaScript ecosystem has been growing with the focus towards making the web more performant and secure for users, with newer features and APIs that make the developer experience easier and more productive.
We saw how so many features that improve rendering and resource loading performance could be more widely utilized to provide users with faster experiences. As a developer, you can start by adopting these new web platform features. However, make sure to use them wisely and ensure that they actually improve performance, as some APIs can cause harm through misuse, as we saw with async and defer attributes on the same script.
Making appropriate use of the powerful APIs that we now have access to is what it will take to see these numbers improve further in the coming years. Let’s continue to do so.
