Ecommerce

Introduction
Nearly 10% of the home pages in this study were found to be on an ecommerce platform. An “ecommerce platform” is a set of software or services that enables you to create and operate an online store. There are several types of ecommerce platforms, for example:
- Paid-for services such as Shopify that host your store and help you get started. They provide website hosting, site and page templates, product-data management, shopping carts and payments.
- Software platforms such as Magento Open Source which you set up, host and manage yourself. These platforms can be powerful and flexible, but may be more complex to set up and run than services such as Shopify.
- Hosted platforms such as Magento Commerce that offer the same features as their self-hosted counterparts, except that hosting is managed as a service by a third-party.
This analysis could only detect sites built on an ecommerce platform. This means that most large online stores and marketplaces—such as Amazon, JD, and eBay—are not included here. Also note that the data here is for home pages only: not category, product or other pages. Learn more about our methodology.
Platform detection
How do we check if a page is on an ecommerce platform?
Detection is done through Wappalyzer. Wappalyzer is a cross-platform utility that uncovers the technologies used on websites. It detects content management systems, ecommerce platforms, web servers, JavaScript frameworks, analytics tools, and many more.
Page detection is not always reliable, and some sites explicitly block detection to protect against automated attacks. We might not be able to catch all websites that use a particular ecommerce platform, but we’re confident that the ones we do detect are actually on that platform.
| Mobile | Desktop | |
|---|---|---|
| Ecommerce pages | 500,595 | 424,441 |
| Total pages | 5,297,442 | 4,371,973 |
| Adoption rate | 9.45% | 9.70% |
Ecommerce platforms
| Platform | Mobile | Desktop |
|---|---|---|
| WooCommerce | 3.98 | 3.90 |
| Shopify | 1.59 | 1.72 |
| Magento | 1.10 | 1.24 |
| PrestaShop | 0.91 | 0.87 |
| Bigcommerce | 0.19 | 0.22 |
| Shopware | 0.12 | 0.11 |
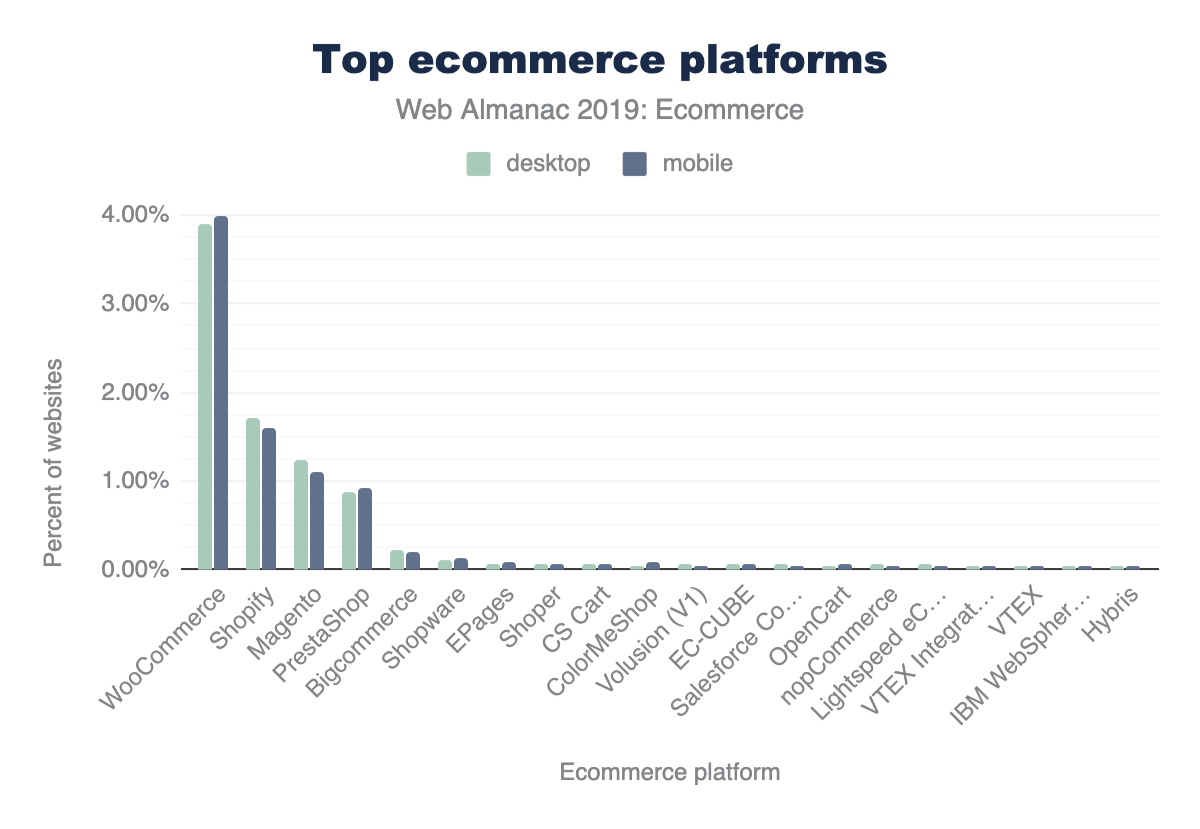
Out of the 116 ecommerce platforms that were detected, only six are found on more than 0.1% of desktop or mobile websites. Note that these results do not show variation by country, by size of site, or other similar metrics.
Figure 13.3 above shows that WooCommerce has the largest adoption at around 4% of desktop and mobile websites. Shopify is second with about 1.6% adoption. Magento, PrestaShop, Bigcommerce, and Shopware follow with smaller and smaller adoption, approaching 0.1%.
Long tail
There are 110 ecommerce platforms that each have fewer than 0.1% of desktop or mobile websites. Around 60 of these have fewer than 0.01% of mobile or desktop websites.
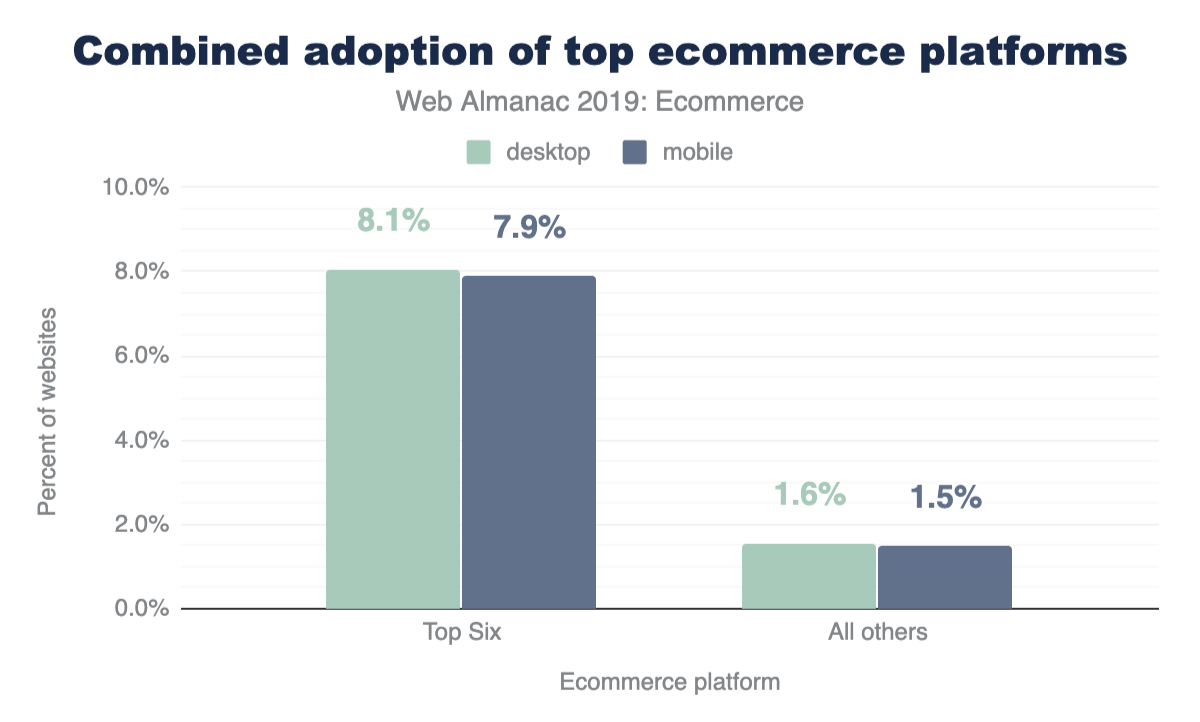
7.87% of all requests on mobile and 8.06% on desktop are for home pages on one of the top six ecommerce platforms. A further 1.52% of requests on mobile and 1.59% on desktop are for home pages on the 110 other ecommerce platforms.
Ecommerce (all platforms)
In total, 9.7% of desktop pages and 9.5% of mobile pages used an ecommerce platform.
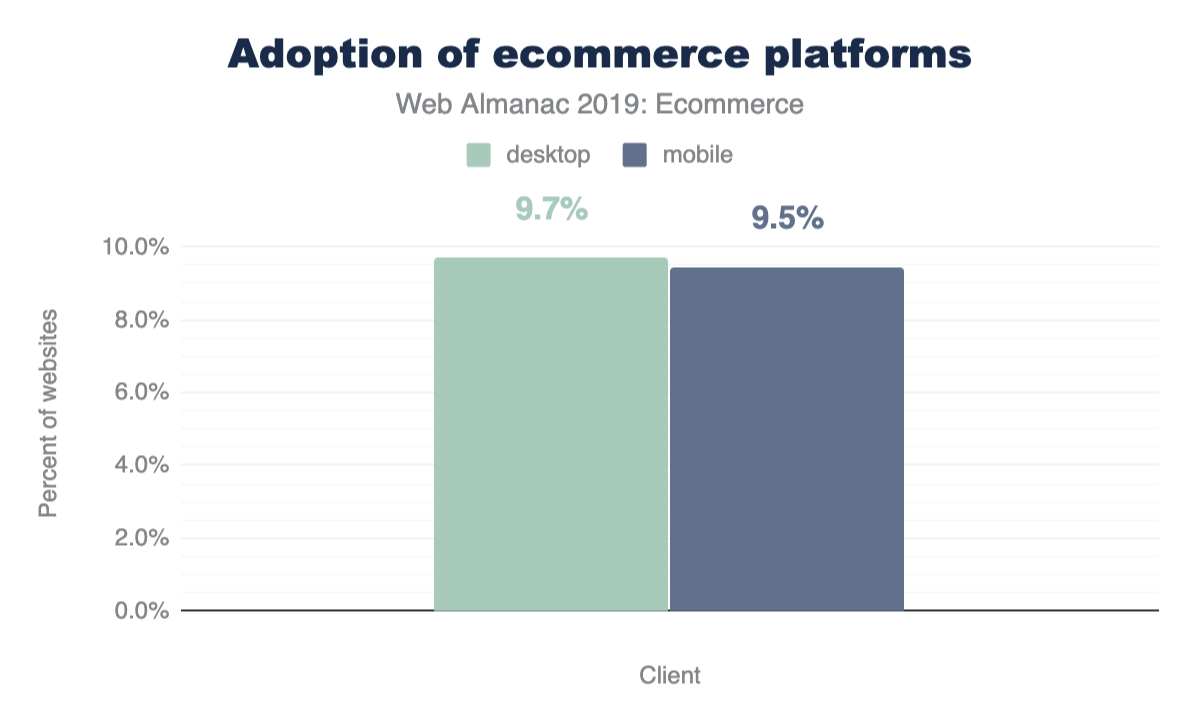
Although the desktop proportion of websites was slightly higher overall, some popular platforms (including WooCommerce, PrestaShop and Shopware) actually have more mobile than desktop websites.
Page weight and requests
The page weight of an ecommerce platform includes all HTML, CSS, JavaScript, JSON, XML, images, audio, and video.
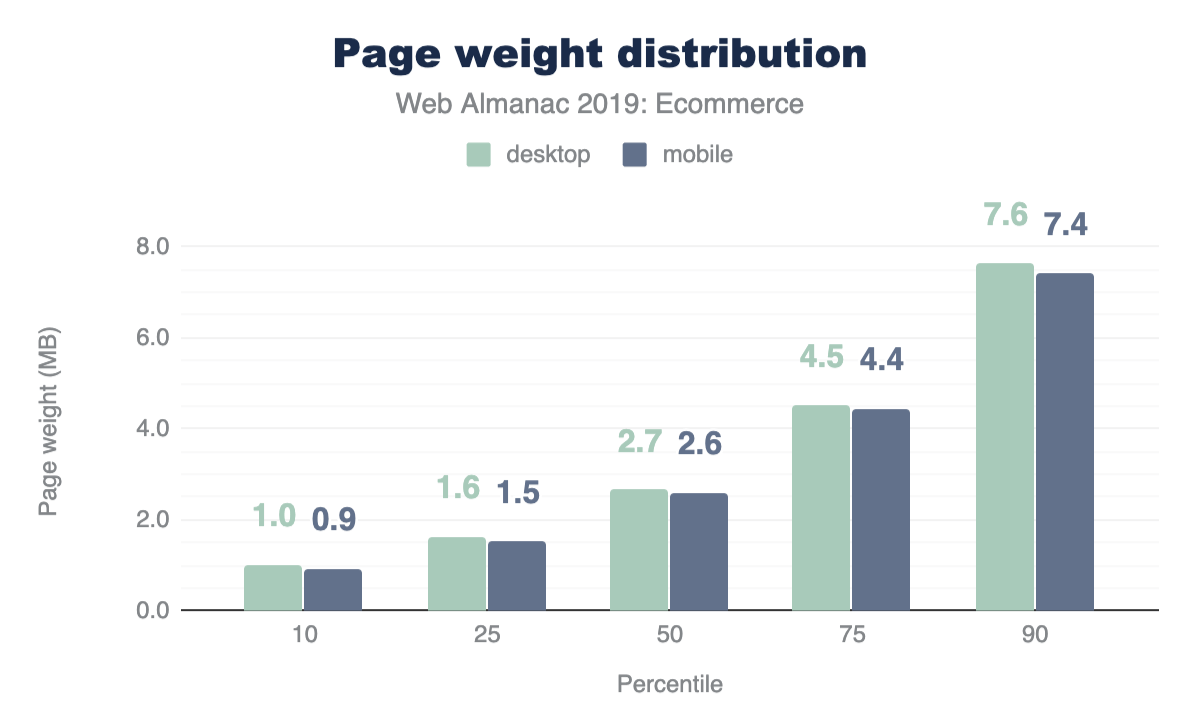
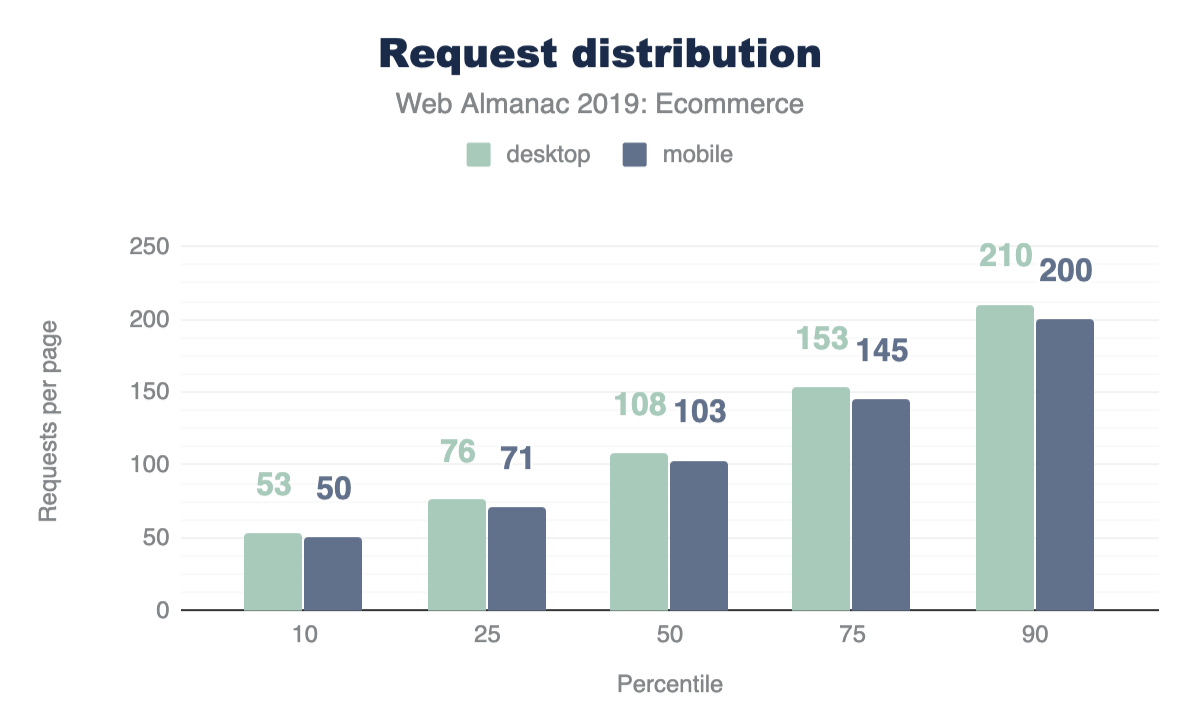
The median desktop ecommerce platform page loads 108 requests and 2.7 MB. The median weight for all desktop pages is 74 requests and 1.9 MB. In other words, ecommerce pages make nearly 50% more requests than other web pages, with payloads around 35% larger. By comparison, the amazon.com home page makes around 300 requests on first load, for a page weight of around 5 MB, and ebay.com makes around 150 requests for a page weight of approximately 3 MB. The page weight and number of requests for home pages on ecommerce platforms is slightly smaller on mobile at every percentile, but around 10% of all ecommerce home pages load more than 7 MB and make over 200 requests.
This data accounts for home page payload and requests without scrolling. Clearly there are a significant proportion of sites that appear to be retrieving more files (the median is over 100), with a larger total payload, than should be necessary for first load. See also: Third-party requests and bytes below.
We need to do further research to better understand why so many home pages on ecommerce platforms make so many requests and have such large payloads. The authors regularly see home pages on ecommerce platforms that make hundreds of requests on first load, with multi-megabyte payloads. If the number of requests and payload are a problem for performance, then how can they be reduced?
Requests and payload by type
The charts below are for desktop requests:
| Type | 10 | 25 | 50 | 75 | 90 |
|---|---|---|---|---|---|
| image | 353 | 728 | 1,514 | 3,104 | 6,010 |
| video | 156 | 453 | 1,325 | 2,935 | 5,965 |
| script | 199 | 330 | 572 | 915 | 1,331 |
| font | 47 | 85 | 144 | 226 | 339 |
| css | 36 | 59 | 102 | 180 | 306 |
| html | 12 | 20 | 36 | 66 | 119 |
| audio | 7 | 7 | 11 | 17 | 140 |
| xml | 0 | 0 | 0 | 1 | 3 |
| other | 0 | 0 | 0 | 0 | 3 |
| text | 0 | 0 | 0 | 0 | 0 |
| Type | 10 | 25 | 50 | 75 | 90 |
|---|---|---|---|---|---|
| image | 16 | 25 | 39 | 62 | 97 |
| script | 11 | 21 | 35 | 53 | 75 |
| css | 3 | 6 | 11 | 22 | 32 |
| font | 2 | 3 | 5 | 8 | 11 |
| html | 1 | 2 | 4 | 7 | 12 |
| video | 1 | 1 | 2 | 5 | 9 |
| other | 1 | 1 | 2 | 4 | 9 |
| text | 1 | 1 | 1 | 2 | 3 |
| xml | 1 | 1 | 1 | 2 | 2 |
| audio | 1 | 1 | 1 | 1 | 3 |
Images constitute the largest number of requests and the highest proportion of bytes for ecommerce pages. The median desktop ecommerce page includes 39 images weighing 1,514 KB (1.5 MB).
The number of JavaScript requests indicates that better bundling (and/or HTTP/2 multiplexing) could improve performance. JavaScript files are not significantly large in terms of total bytes, but many separate requests are made. According to the HTTP/2 chapter, more than 40% of requests are not via HTTP/2. Similarly, CSS files have the third highest number of requests but are generally small. Merging CSS files (and/or HTTP/2) could improve performance of such sites. In the authors’ experience, many ecommerce pages have a high proportion of unused CSS and JavaScript. Videos may require a small number of requests, but (not surprisingly) consume a high proportion of the page weight, particularly on sites with heavy payloads.
HTML payload size
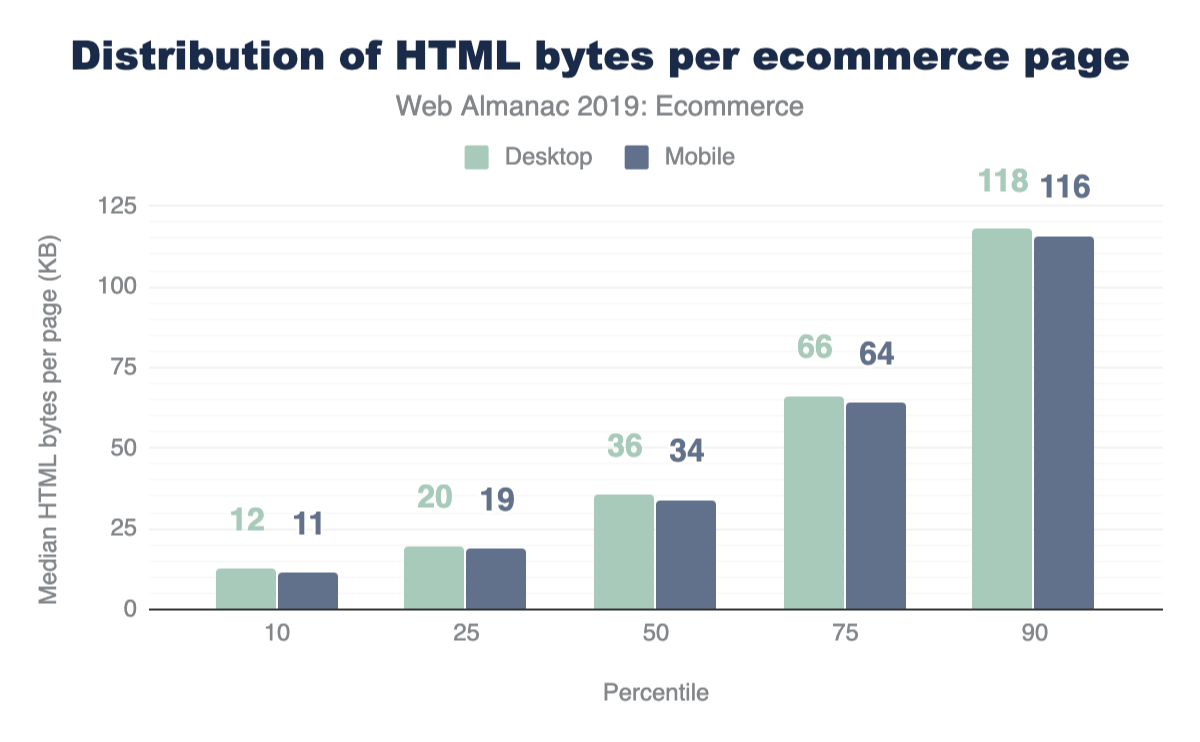
Note that HTML payloads may include other code such as inline JSON, JavaScript, or CSS directly in the markup itself, rather than referenced as external links. The median HTML payload size for ecommerce pages is 34 KB on mobile and 36 KB on desktop. However, 10% of ecommerce pages have an HTML payload of more than 115 KB.
Mobile HTML payload sizes are not very different from desktop. In other words, it appears that sites are not delivering significantly different HTML files for different devices or viewport sizes. On many ecommerce sites, home page HTML payloads are large. We don’t know whether this is because of bloated HTML, or from other code (such as JSON) within HTML files.
Image stats
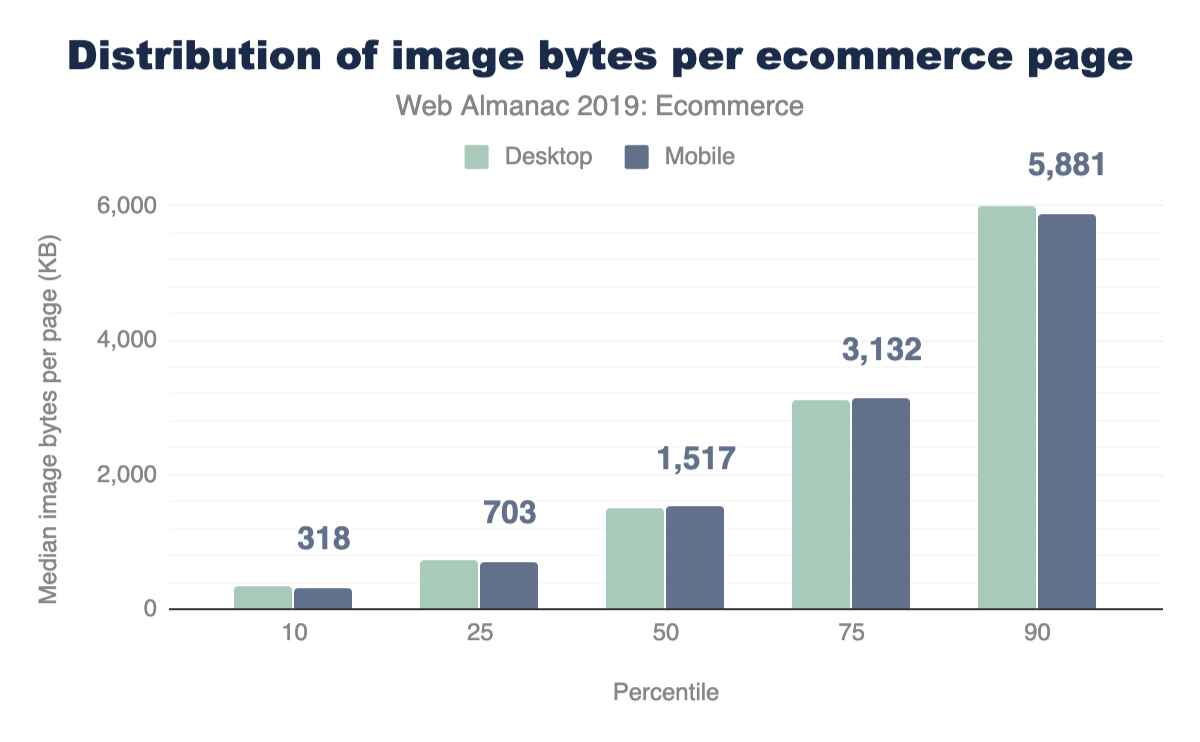
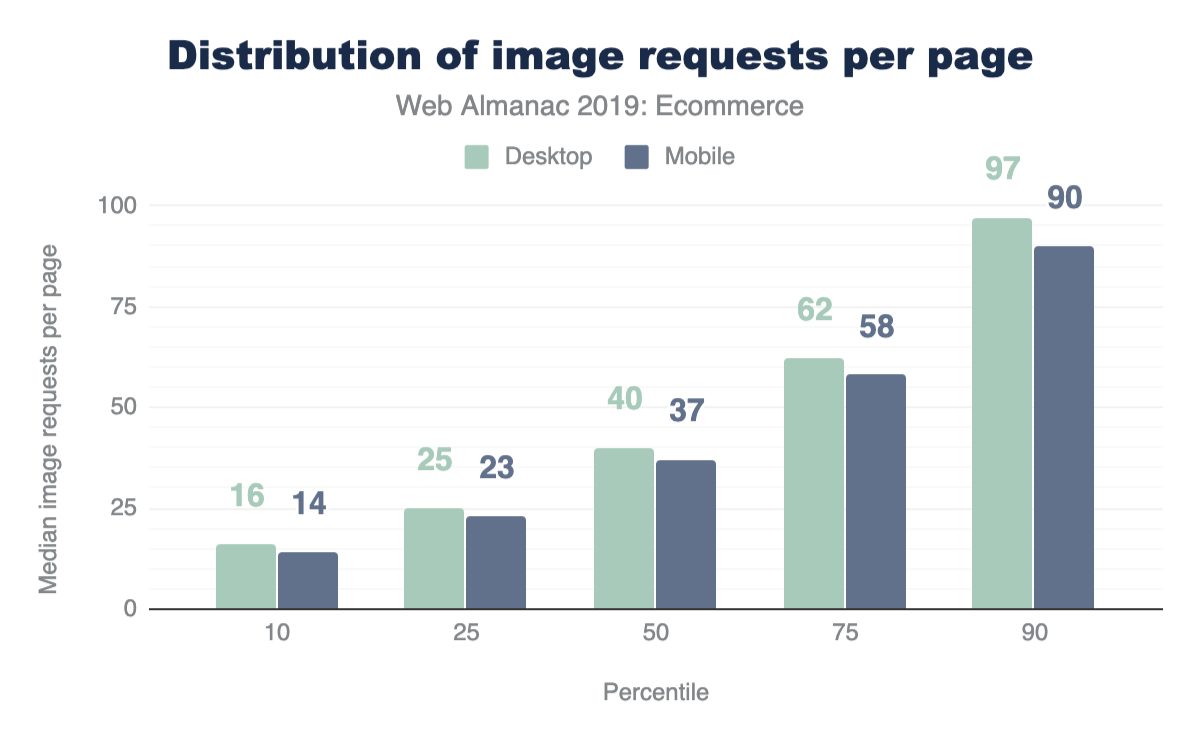
Figures 13.12 and 13.13 above show that the median ecommerce page has 37 images and an image payload of 1,517 KB on mobile, 40 images and 1,524 KB on desktop. 10% of home pages have 90 or more images and an image payload of nearly 6 MB!
A significant proportion of ecommerce pages have sizable image payloads and make a large number of image requests on first load. See HTTP Archive’s State of Images report and the media and page weight chapters for more context.
Website owners want their sites to look good on modern devices. As a result, many sites deliver the same high resolution product images to every user without regard for screen resolution or size. Developers may not be aware of (or not want to use) responsive techniques that enable efficient delivery of the best possible image to different users. It’s worth remembering that high-resolution images may not necessarily increase conversion rates. Conversely, overuse of heavy images is likely to impact page speed and can thereby reduce conversion rates. In the authors’ experience from site reviews and events, some developers and other stakeholders have SEO or other concerns about using lazy loading for images.
We need to do more analysis to better understand why some sites are not using responsive image techniques or lazy loading. We also need to provide guidance that helps ecommerce platforms to reliably deliver beautiful images to those with high end devices and good connectivity, while simultaneously providing a best-possible experience to lower-end devices and those with poor connectivity.
Popular image formats
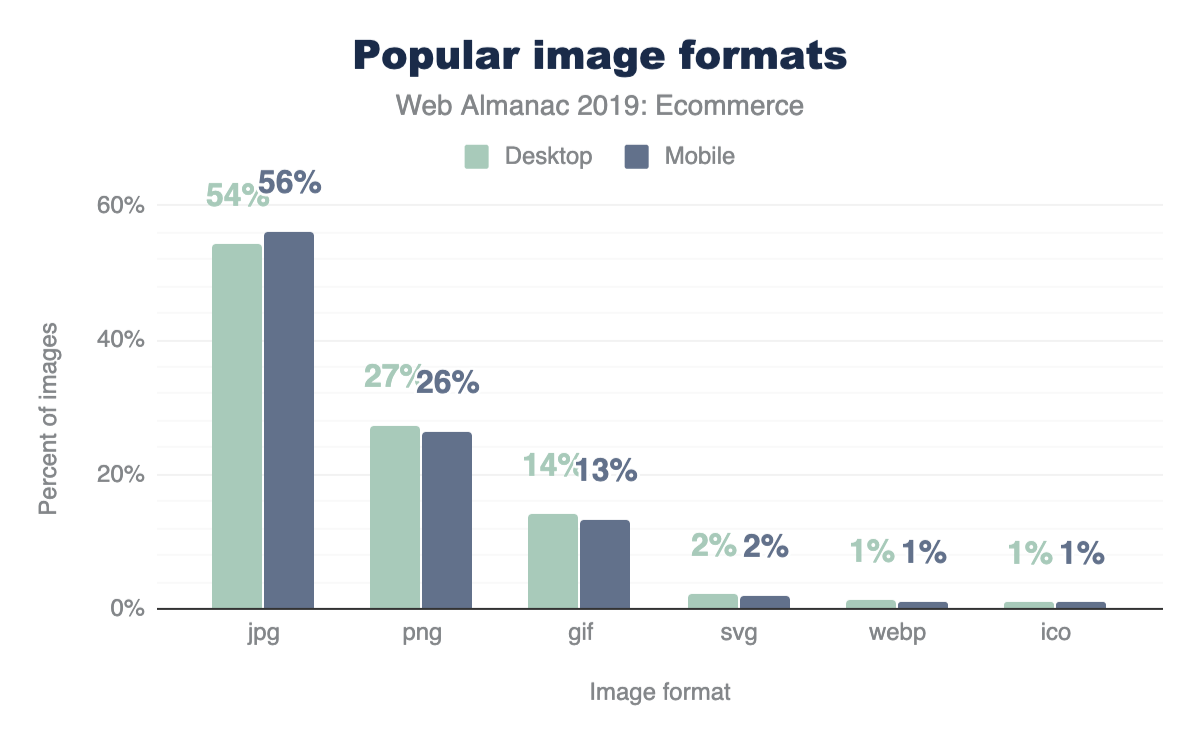
PNG
One in four images on ecommerce pages are PNG. The high number of PNG requests from pages on ecommerce platforms is probably for product images. Many commerce sites use PNG with photographic images to enable transparency.
Using WebP with a PNG fallback can be a far more efficient alternative, either via a picture element or by using user agent capability detection via an image service such as Cloudinary.
WebP
Only 1% of images on ecommerce platforms are WebP, which tallies with the authors’ experience of site reviews and partner work. WebP is supported by all modern browsers other than Safari and has good fallback mechanisms available. WebP supports transparency and is a far more efficient format than PNG for photographic images (see PNG section above).
We as a web community can provide better guidance/advocacy for enabling transparency using WebP with a PNG fallback and/or using WebP/JPEG with a solid color background. WebP appears to be rarely used on ecommerce platforms, despite the availability of guides and tools (e.g. Squoosh and cwebp). We need to do further research into why there hasn’t been more take-up of WebP, which is now nearly 10 years old.
Image dimensions
| Mobile | Desktop | |||
|---|---|---|---|---|
| Percentile | Width (px) | Height (px) | Width (px) | Height (px) |
| 10 | 16 | 16 | 16 | 16 |
| 25 | 100 | 64 | 100 | 60 |
| 50 | 247 | 196 | 240 | 192 |
| 75 | 364 | 320 | 400 | 331 |
| 90 | 693 | 512 | 800 | 546 |
The median (’mid-range’) dimensions for images requested by ecommerce pages is 247x196 px on mobile and 240x192 px on desktop. 10% of images requested by ecommerce pages are at least 693x512 px on mobile and 800x546 px on desktop. Note that these dimensions are the intrinsic sizes of images, not their display size.
Given that image dimensions at each percentile up to the median are similar on mobile and desktop, or even slightly larger on mobile in some cases, it would seem that many sites are not delivering different image dimensions for different viewports, or in other words, not using responsive image techniques. The delivery of larger images to mobile in some cases may (or may not!) be explained by sites using device or screen detection.
We need to do more research into why many sites are (apparently) not delivering different image sizes to different viewports.
Third-party requests and bytes
Many websites—especially online stores—load a significant amount of code and content from third-parties: for analytics, A/B testing, customer behavior tracking, advertising, and social media support. Third-party content can have a significant impact on performance. Patrick Hulce’s third-party-web tool is used to determine third-party requests for this report, and this is discussed more in the Third Parties chapter.
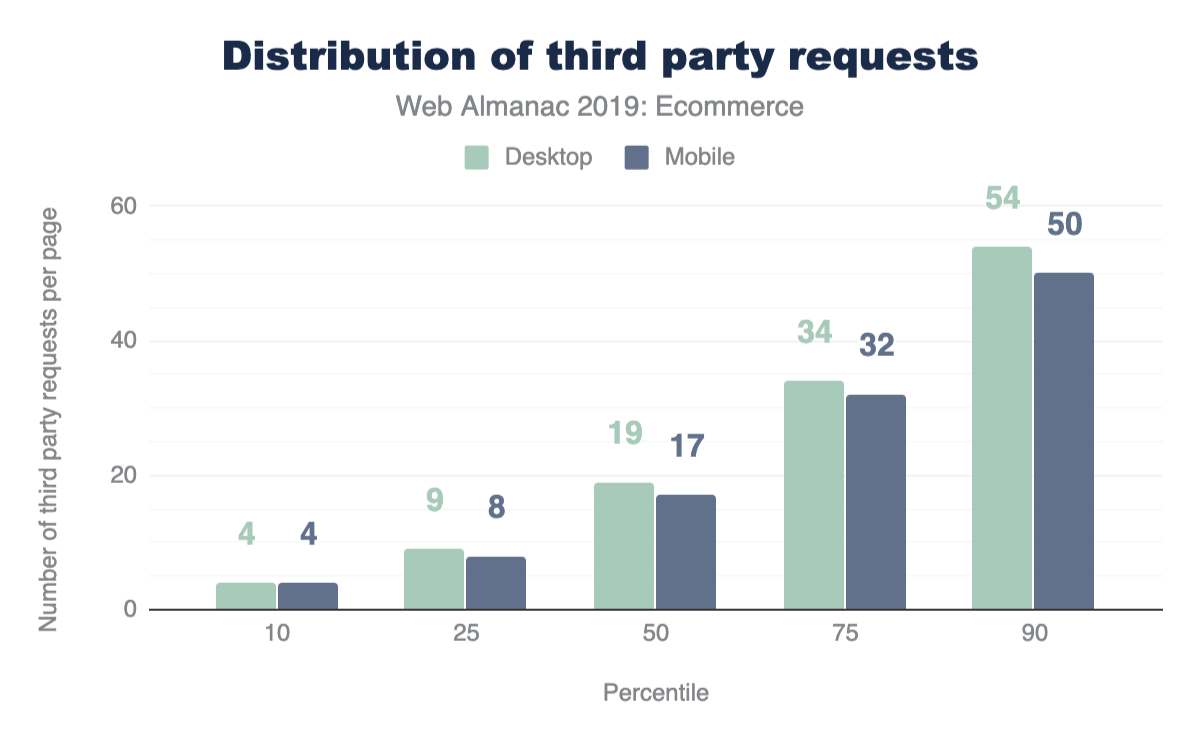
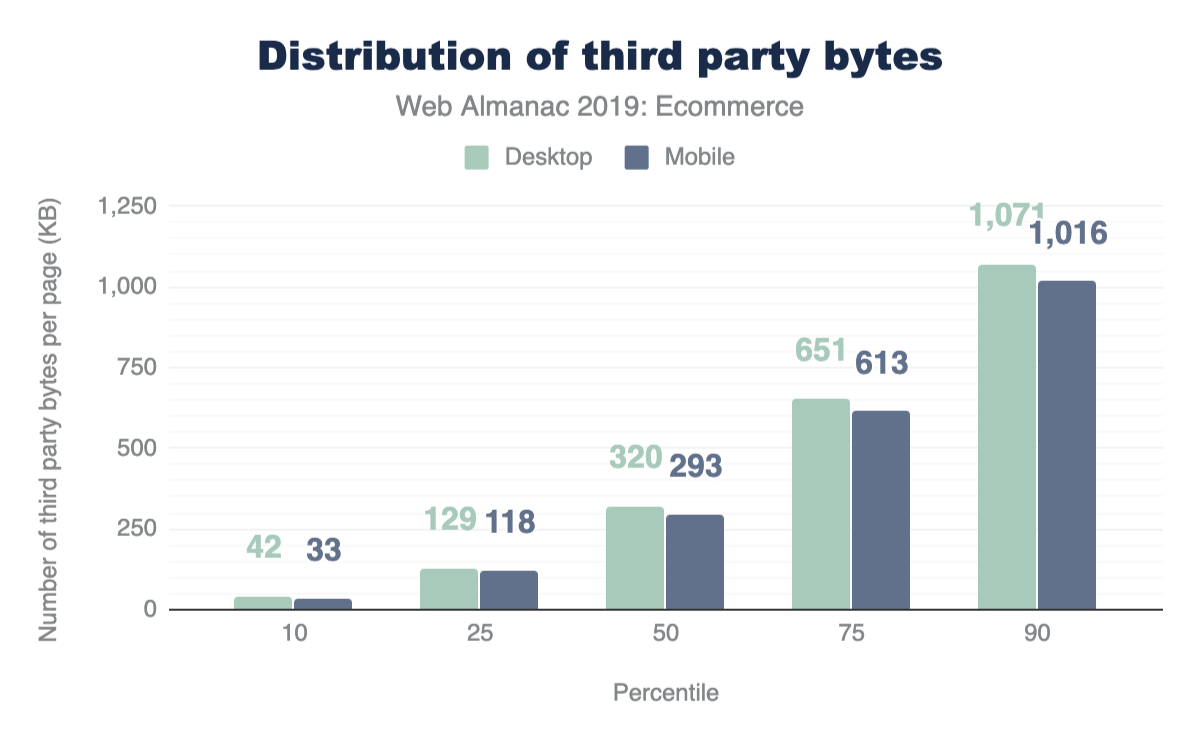
The median (’mid-range’) home page on an ecommerce platform makes 17 requests for third-party content on mobile and 19 on desktop. 10% of all home pages on ecommerce platforms make over 50 requests for third-party content, with a total payload of over 1 MB.
Other studies have indicated that third-party content can be a major performance bottleneck. This study shows that 17 or more requests (50 or more for the top 10%) is the norm for ecommerce pages.
Third-party requests and payload per platform
Note the charts and tables below show data for mobile only.
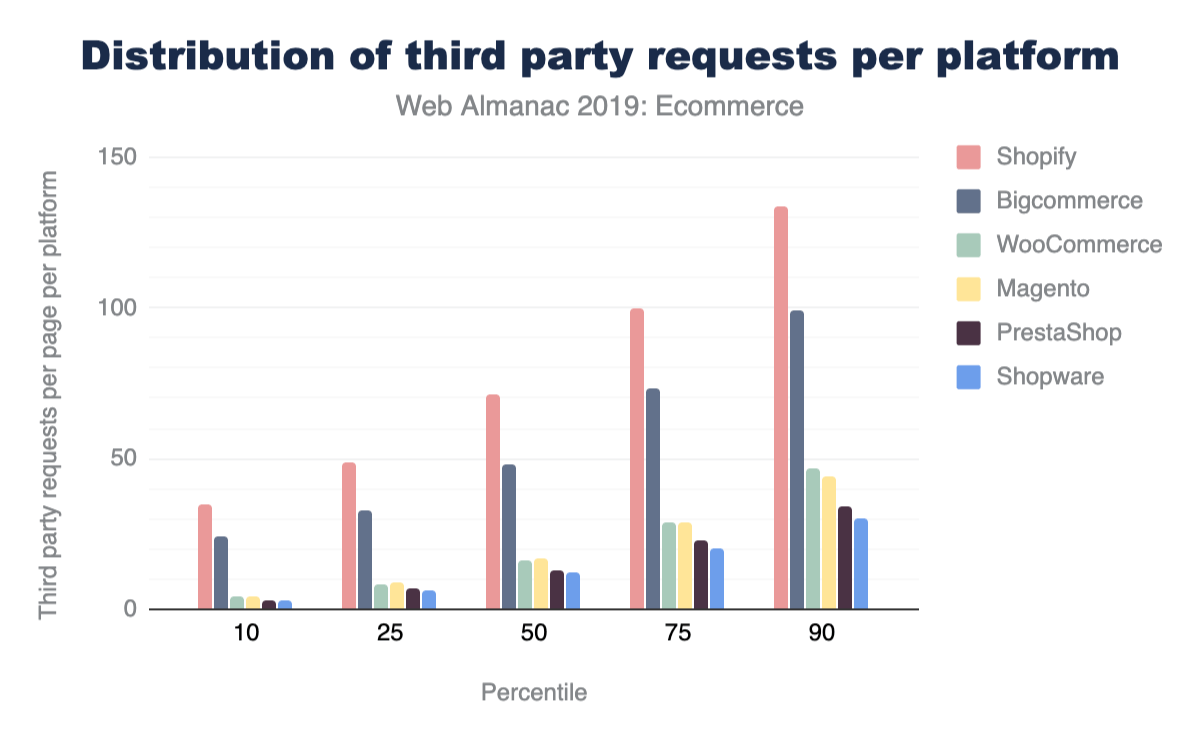
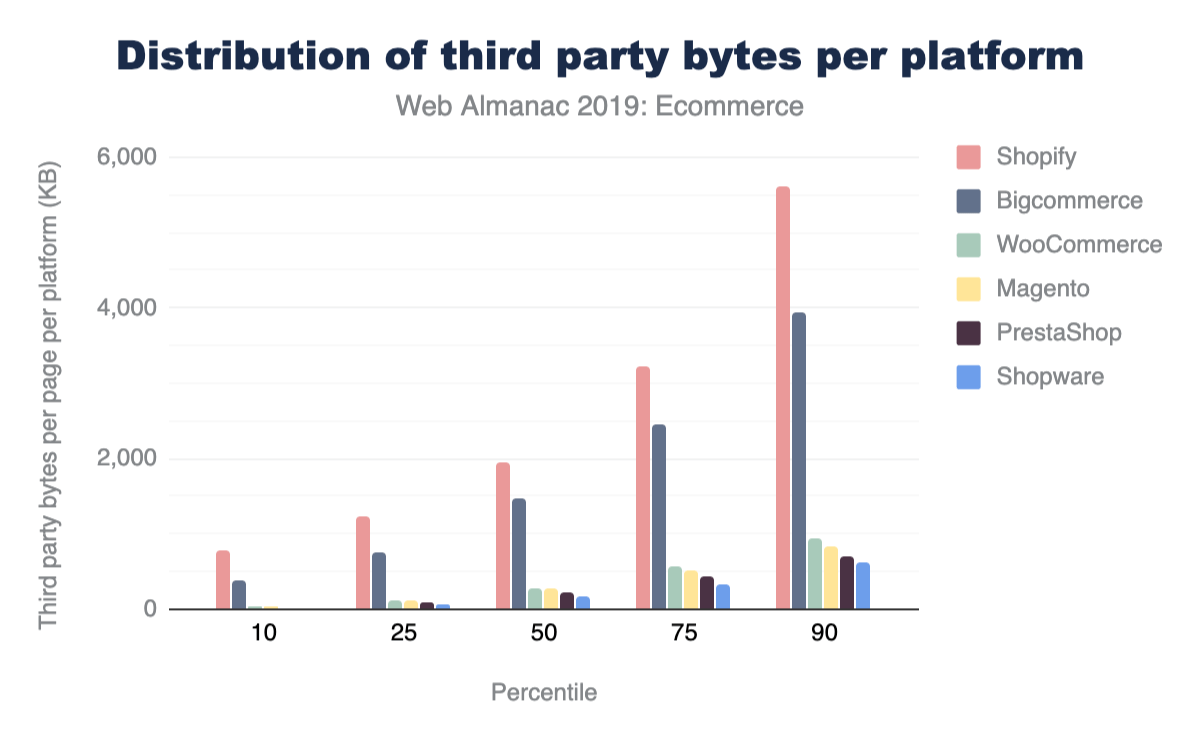
Platforms such as Shopify may extend their services using client-side JavaScript, whereas other platforms such as Magento use more server side extensions. This difference in architecture affects the figures seen here.
Clearly, pages on some ecommerce platforms make more requests for third-party content and incur a larger payload of third-party content. Further analysis could be done on why pages from some platforms make more requests and have larger third-party payloads than others.
First Contentful Paint (FCP)
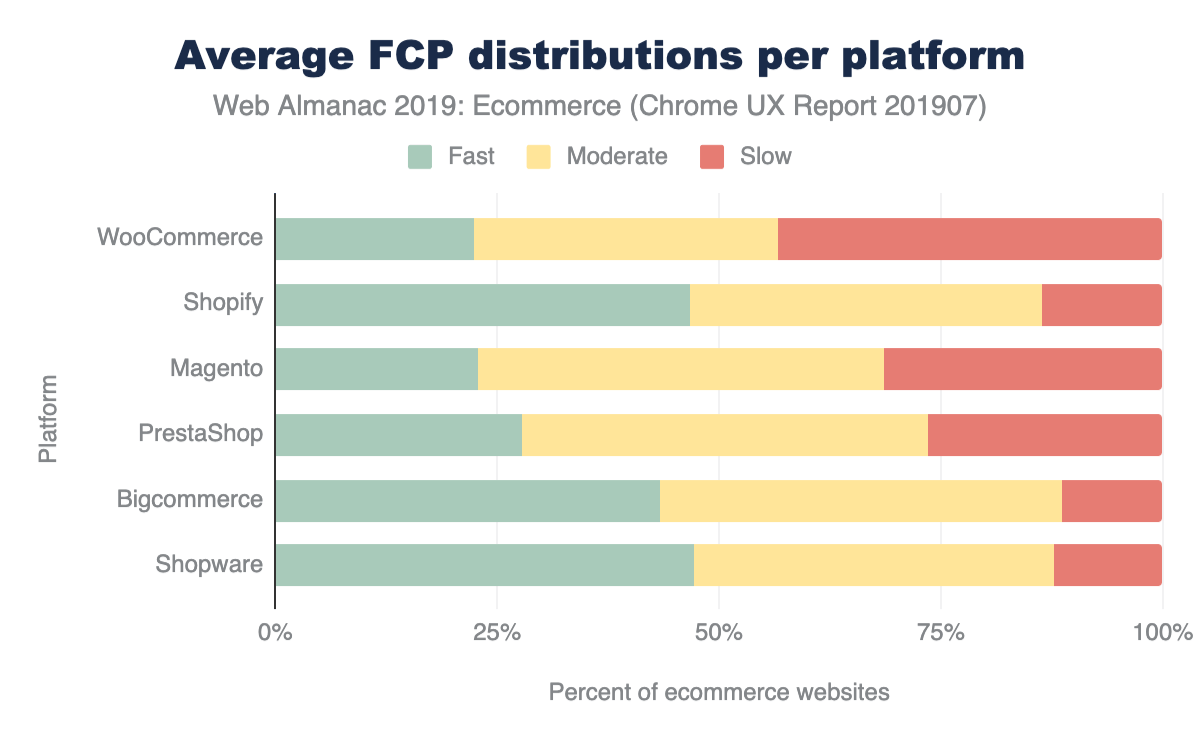
First Contentful Paint measures the time it takes from navigation until content such as text or an image is first displayed. In this context, fast means FCP in under one second, slow means FCP in 3 seconds or more, and moderate is everything in between. Note that third-party content and code may have a significant impact on FCP.
All top-six ecommerce platforms have worse FCP on mobile than desktop: less fast and more slow. Note that FCP is affected by device capability (processing power, memory, etc.) as well as connectivity.
We need to establish why FCP is worse on mobile than desktop. What are the causes: connectivity and/or device capability, or something else?
Progressive Web App (PWA) scores
See also the PWA chapter for more information on this topic beyond just ecommerce sites.
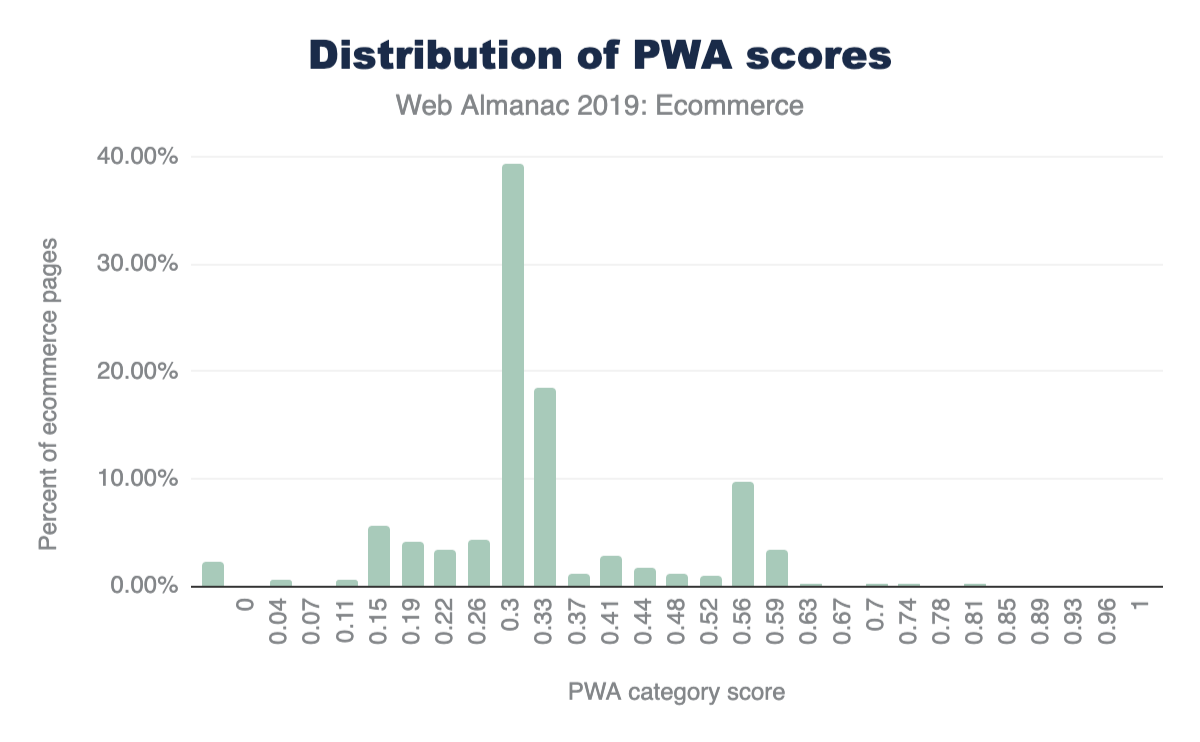
More than 60% of home pages on ecommerce platforms get a Lighthouse PWA score between 0.25 and 0.35. Less than 20% of home pages on ecommerce platforms get a score of more than 0.5 and less than 1% of home pages score more than 0.6.
Lighthouse returns a Progressive Web App (PWA) score between 0 and 1. 0 is the worst possible score, and 1 is the best. The PWA audits are based on the Baseline PWA Checklist, which lists 14 requirements. Lighthouse has automated audits for 11 of the 14 requirements. The remaining 3 can only be tested manually. Each of the 11 automated PWA audits are weighted equally, so each one contributes approximately 9 points to your PWA score.
If at least one of the PWA audits got a null score, Lighthouse nulls out the score for the entire PWA category. This was the case for 2.32% of mobile pages.
Clearly, the majority of ecommerce pages are failing most PWA checklist audits. We need to do further analysis to better understand which audits are failing and why.
Conclusion
This comprehensive study of ecommerce usage shows some interesting data and also the wide variations in ecommerce sites, even among those built on the same ecommerce platform. Even though we have gone into a lot of detail here, there is much more analysis we could do in this space. For example, we didn’t get accessibility scores this year (checkout the accessibility chapter for more on that). Likewise, it would be interesting to segment these metrics by geography. This study detected 246 ad providers on home pages on ecommerce platforms. Further studies (perhaps in next year’s Web Almanac?) could calculate what proportion of sites on ecommerce platforms shows ads. WooCommerce got very high numbers in this study so another interesting statistic we could look at next year is if some hosting providers are installing WooCommerce but not enabling it, thereby causing inflated figures.

