Markup
Introduction
In 2005, Ian “Hixie” Hickson posted some analysis of markup data building upon various previous work. Much of this work aimed to investigate class names to see if there were common informal semantics that were being adopted by developers which it might make sense to standardize upon. Some of this research helped inform new elements in HTML5.
14 years later, it’s time to take a fresh look. Since then, we’ve also had the introduction of Custom Elements and the Extensible Web Manifesto encouraging that we find better ways to pave the cowpaths by allowing developers to explore the space of elements themselves and allow standards bodies to act more like dictionary editors. Unlike CSS class names, which might be used for anything, we can be far more certain that authors who used a non-standard element really intended this to be an element.
As of July 2019, the HTTP Archive has begun collecting all used element names in the DOM for about 4.4 million desktop home pages, and about 5.3 million mobile home pages which we can now begin to research and dissect. (Learn more about our Methodology.)
This crawl encountered over 5,000 distinct non-standard element names in these pages, so we capped the total distinct number of elements that we count to the ’top’ (explained below) 5,048.
Methodology
Names of elements on each page were collected from the DOM itself, after the initial run of JavaScript.
Looking at a raw frequency count isn’t especially helpful, even for standard elements: About 25% of all elements encountered are <div>. About 17% are <a>, about 11% are <span> -- and those are the only elements that account for more than 10% of occurrences. Languages are generally like this; a small number of terms are astoundingly used by comparison. Further, when we start looking at non-standard elements for uptake, this would be very misleading as one site could use a certain element a thousand times and thus make it look artificially very popular.
Instead, as in Hixie’s original study, what we will look at is how many sites include each element at least once in their home page.
Top elements and general info
In 2005, Hixie’s survey listed the top few most commonly used elements on pages. The top 3 were html, head and body which he noted as interesting because they are optional and created by the parser if omitted. Given that we use the post-parsed DOM, they’ll show up universally in our data. Thus, we’ll begin with the 4th most used element. Below is a comparison of the data from then to now (I’ve included the frequency comparison here as well just for fun).
| 2005 (per site) | 2019 (per site) | 2019 (frequency) |
|---|---|---|
| title | title | div |
| a | meta | a |
| img | a | span |
| meta | div | li |
| br | link | img |
| table | script | script |
| td | img | p |
| tr | span | option |
Elements per page
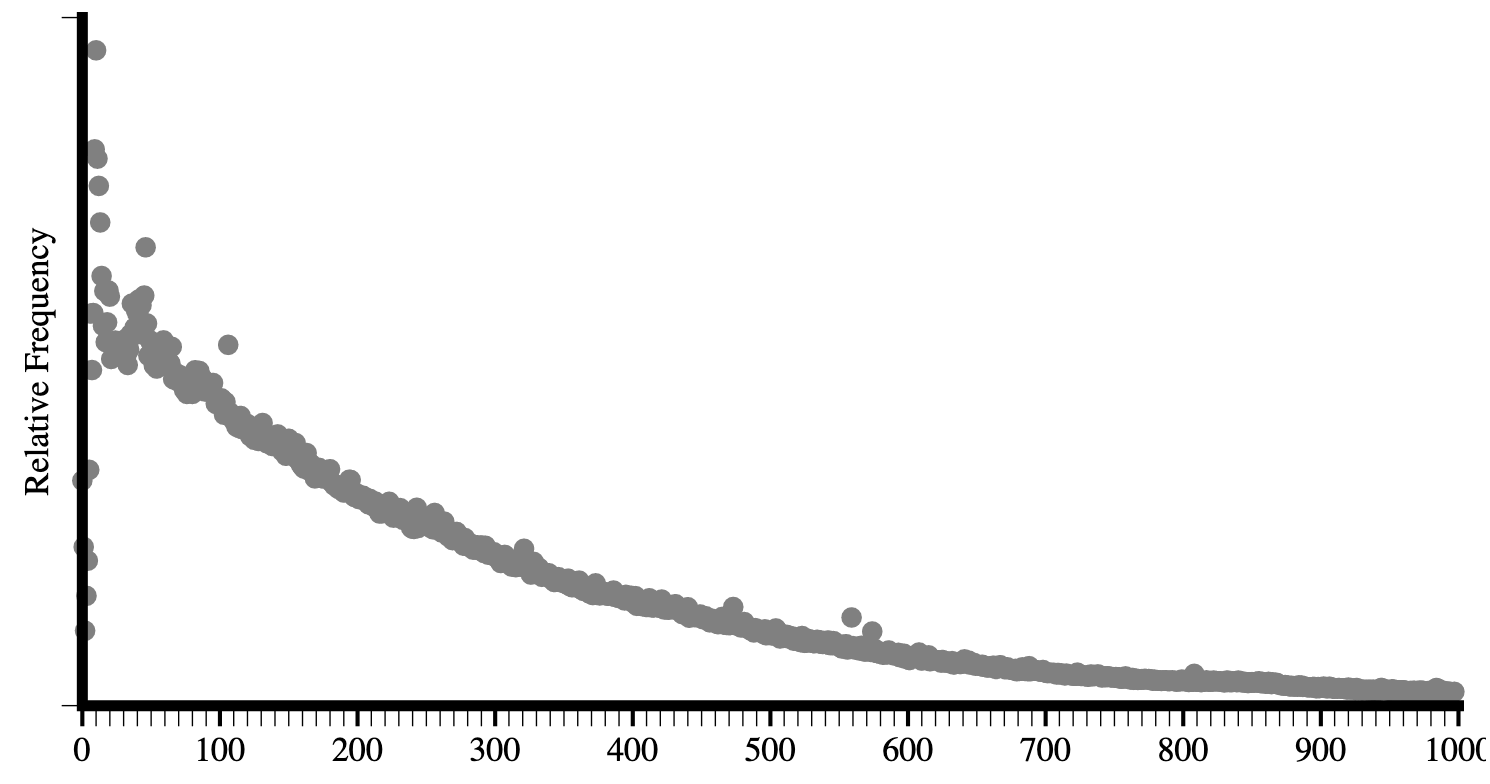
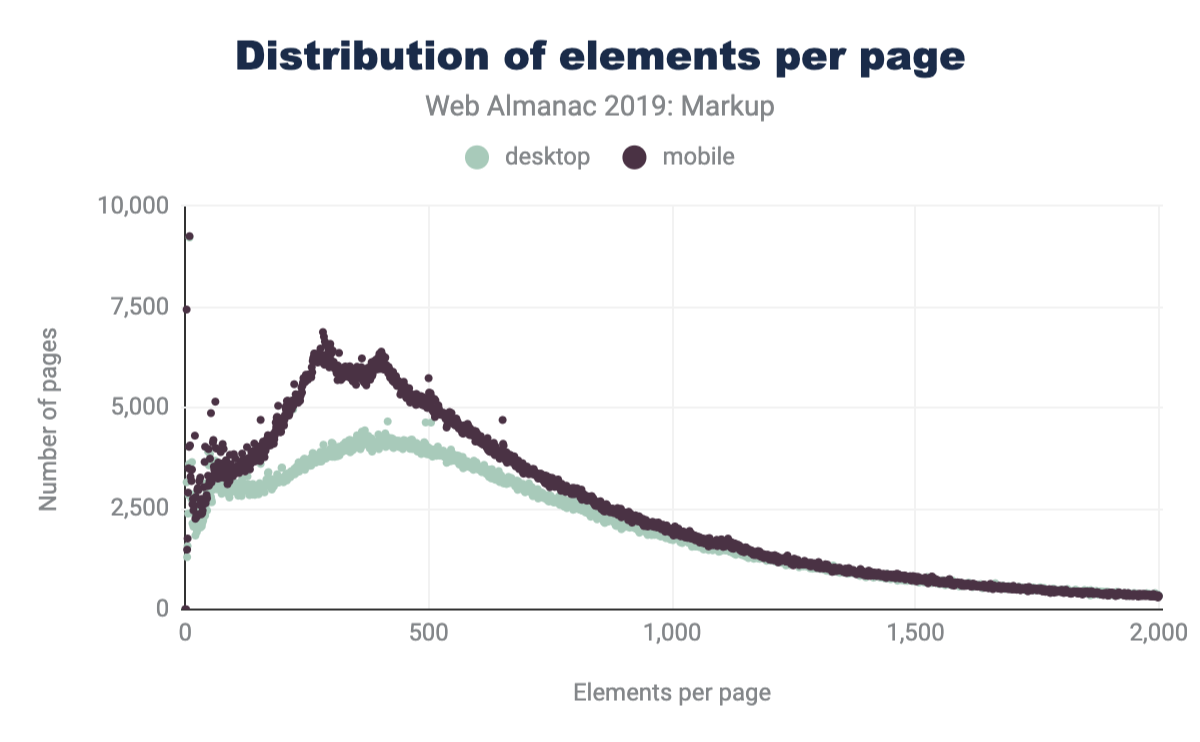
Comparing the latest data in Figure 3.3 to that of Hixie’s report from 2005 in Figure 3.2, we can see that the average size of DOM trees has gotten bigger.

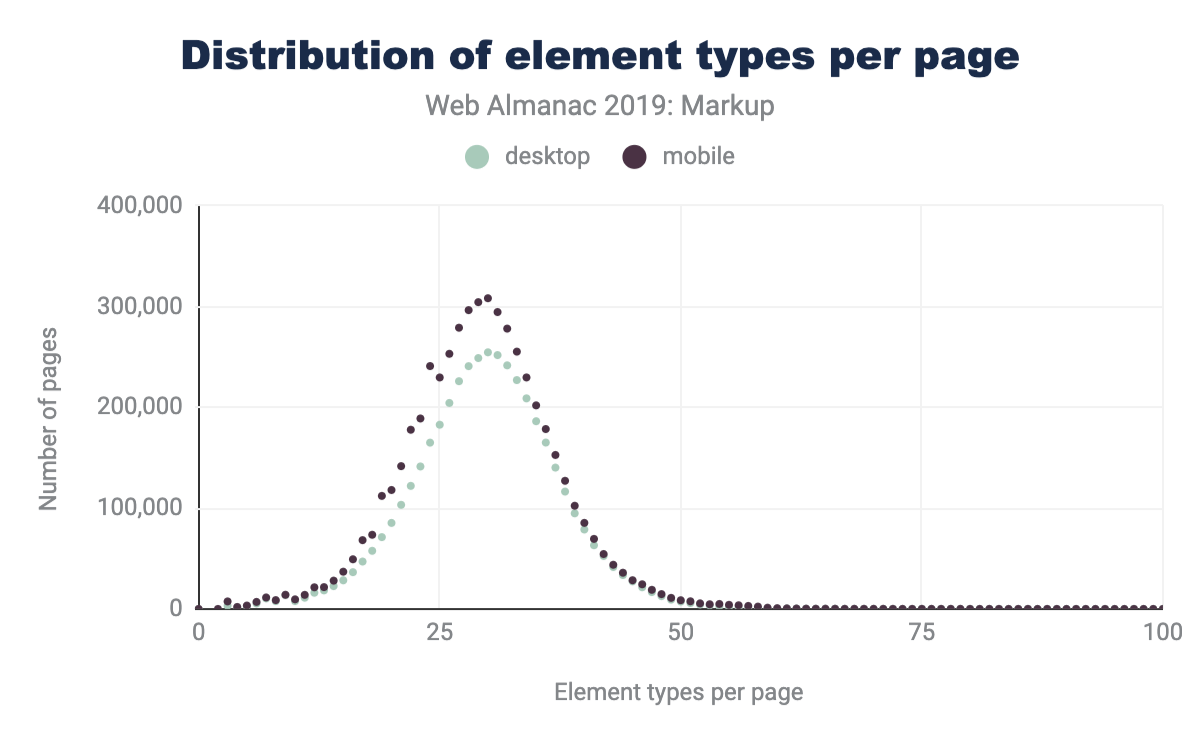
We can see that both the average number of types of elements per page has increased, as well as the maximum numbers of unique elements that we encounter.
Custom elements
Most of the elements we recorded are custom (as in simply ’not standard’), but discussing which elements are and are not custom can get a little challenging. Written down in some spec or proposal somewhere are, actually, quite a few elements. For purposes here, we considered 244 elements as standard (though, some of them are deprecated or unsupported):
- 145 Elements from HTML
- 68 Elements from SVG
- 31 Elements from MathML
In practice, we encountered only 214 of these:
- 137 from HTML
- 54 from SVG
- 23 from MathML
In the desktop dataset we collected data for the top 4,834 non-standard elements that we encountered. Of these:
- 155 (3%) are identifiable as very probable markup or escaping errors (they contain characters in the parsed tag name which imply that the markup is broken)
- 341 (7%) use XML-style colon namespacing (though, as HTML, they don’t use actual XML namespaces)
- 3,207 (66%) are valid custom element names
- 1,211 (25%) are in the global namespace (non-standard, having neither dash, nor colon)
- 216 of these we have flagged as possible typos as they are longer than 2 characters and have a Levenshtein distance of 1 from some standard element name like
<cript>,<spsn>or<artice>. Some of these (like<jdiv>), however, are certainly intentional.
Additionally, 15% of desktop pages and 16% of mobile pages contain deprecated elements.
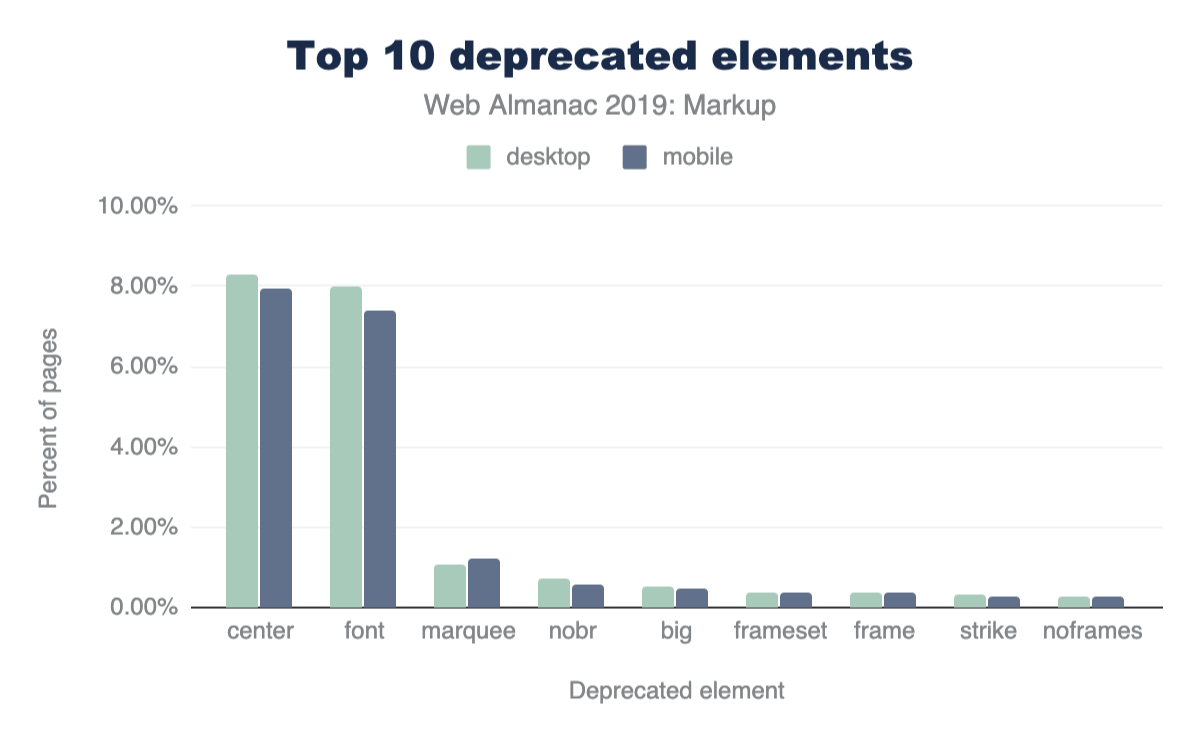
Figure 3.6 above shows the top 10 most frequently used deprecated elements. Most of these can seem like very small numbers, but perspective matters.
Perspective on value and usage
In order to discuss numbers about the use of elements (standard, deprecated or custom), we first need to establish some perspective.
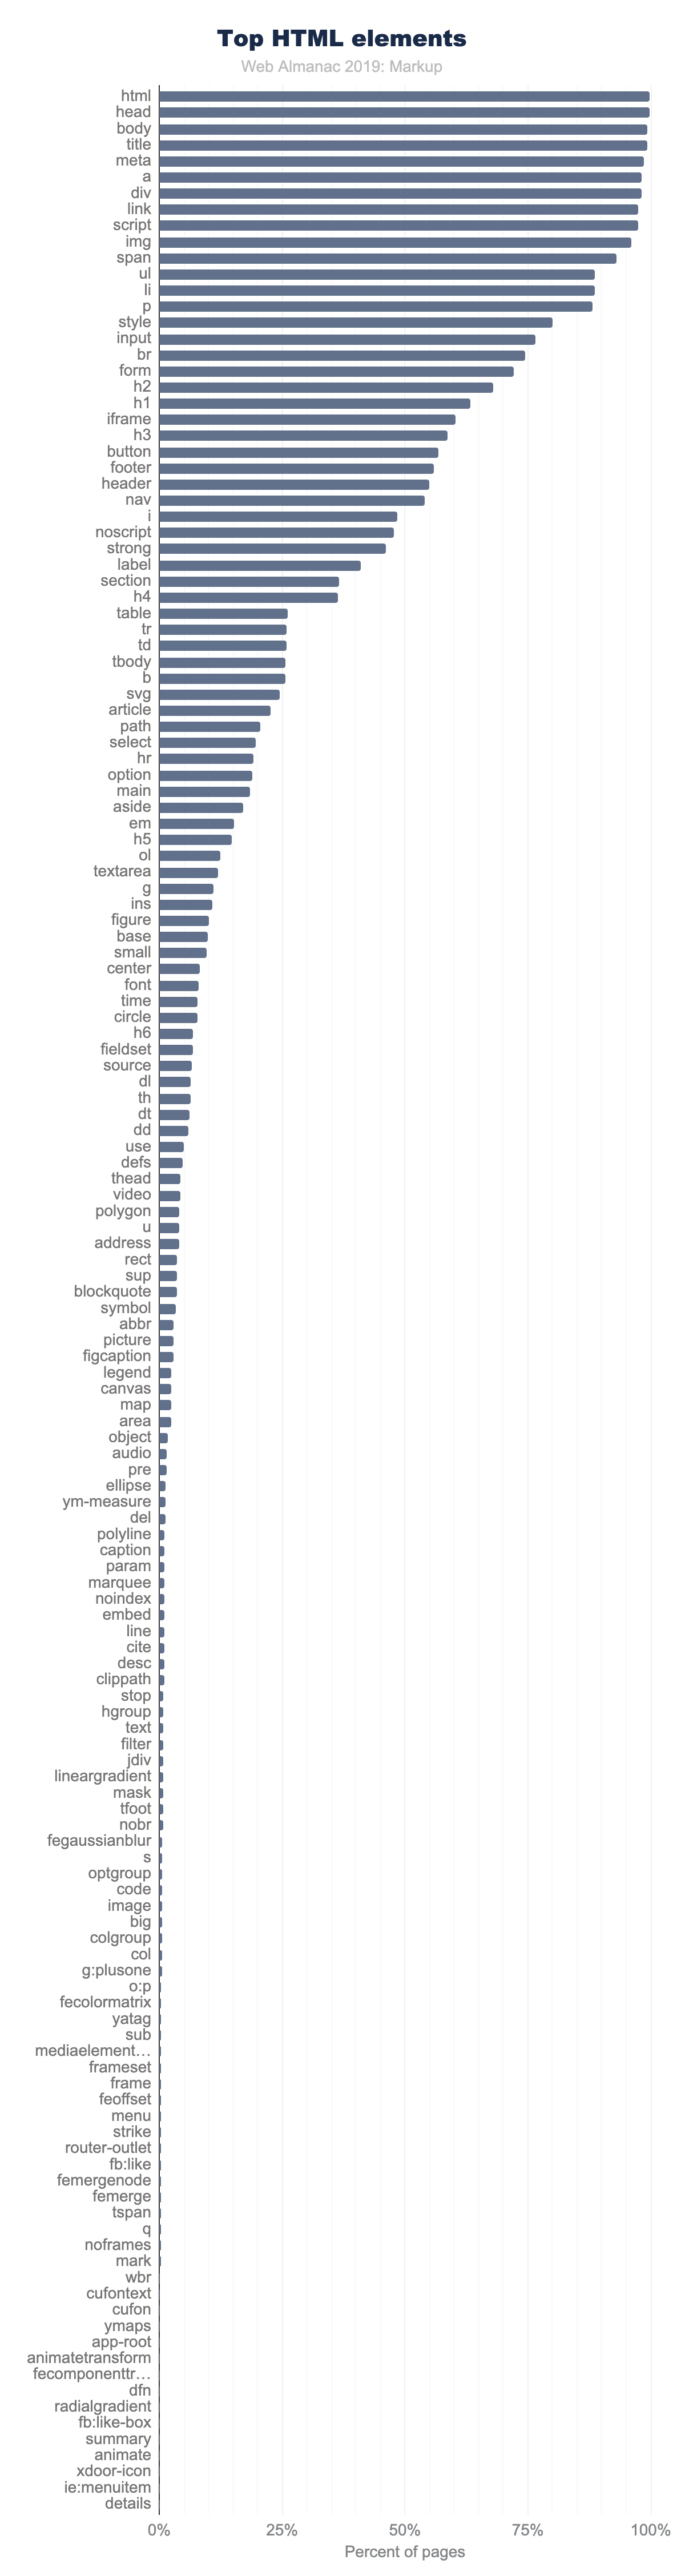
In Figure 3.7 above, the top 150 element names, counting the number of pages where they appear, are shown. Note how quickly use drops off.
Only 11 elements are used on more than 90% of pages:
<html><head><body><title><meta><a><div><link><script><img><span>
There are only 15 other elements that occur on more than 50% of pages:
<ul><li><p><style><input><br><form><h2><h1><iframe><h3><button><footer><header><nav>
And there are only 40 other elements that occur on more than 5% of pages.
Even <video>, for example, doesn’t make that cut. It appears on only 4% of desktop pages in the dataset (3% on mobile). While these numbers sound very low, 4% is actually quite popular by comparison. In fact, only 98 elements occur on more than 1% of pages.
It’s interesting, then, to see what the distribution of these elements looks like and which ones have more than 1% use.
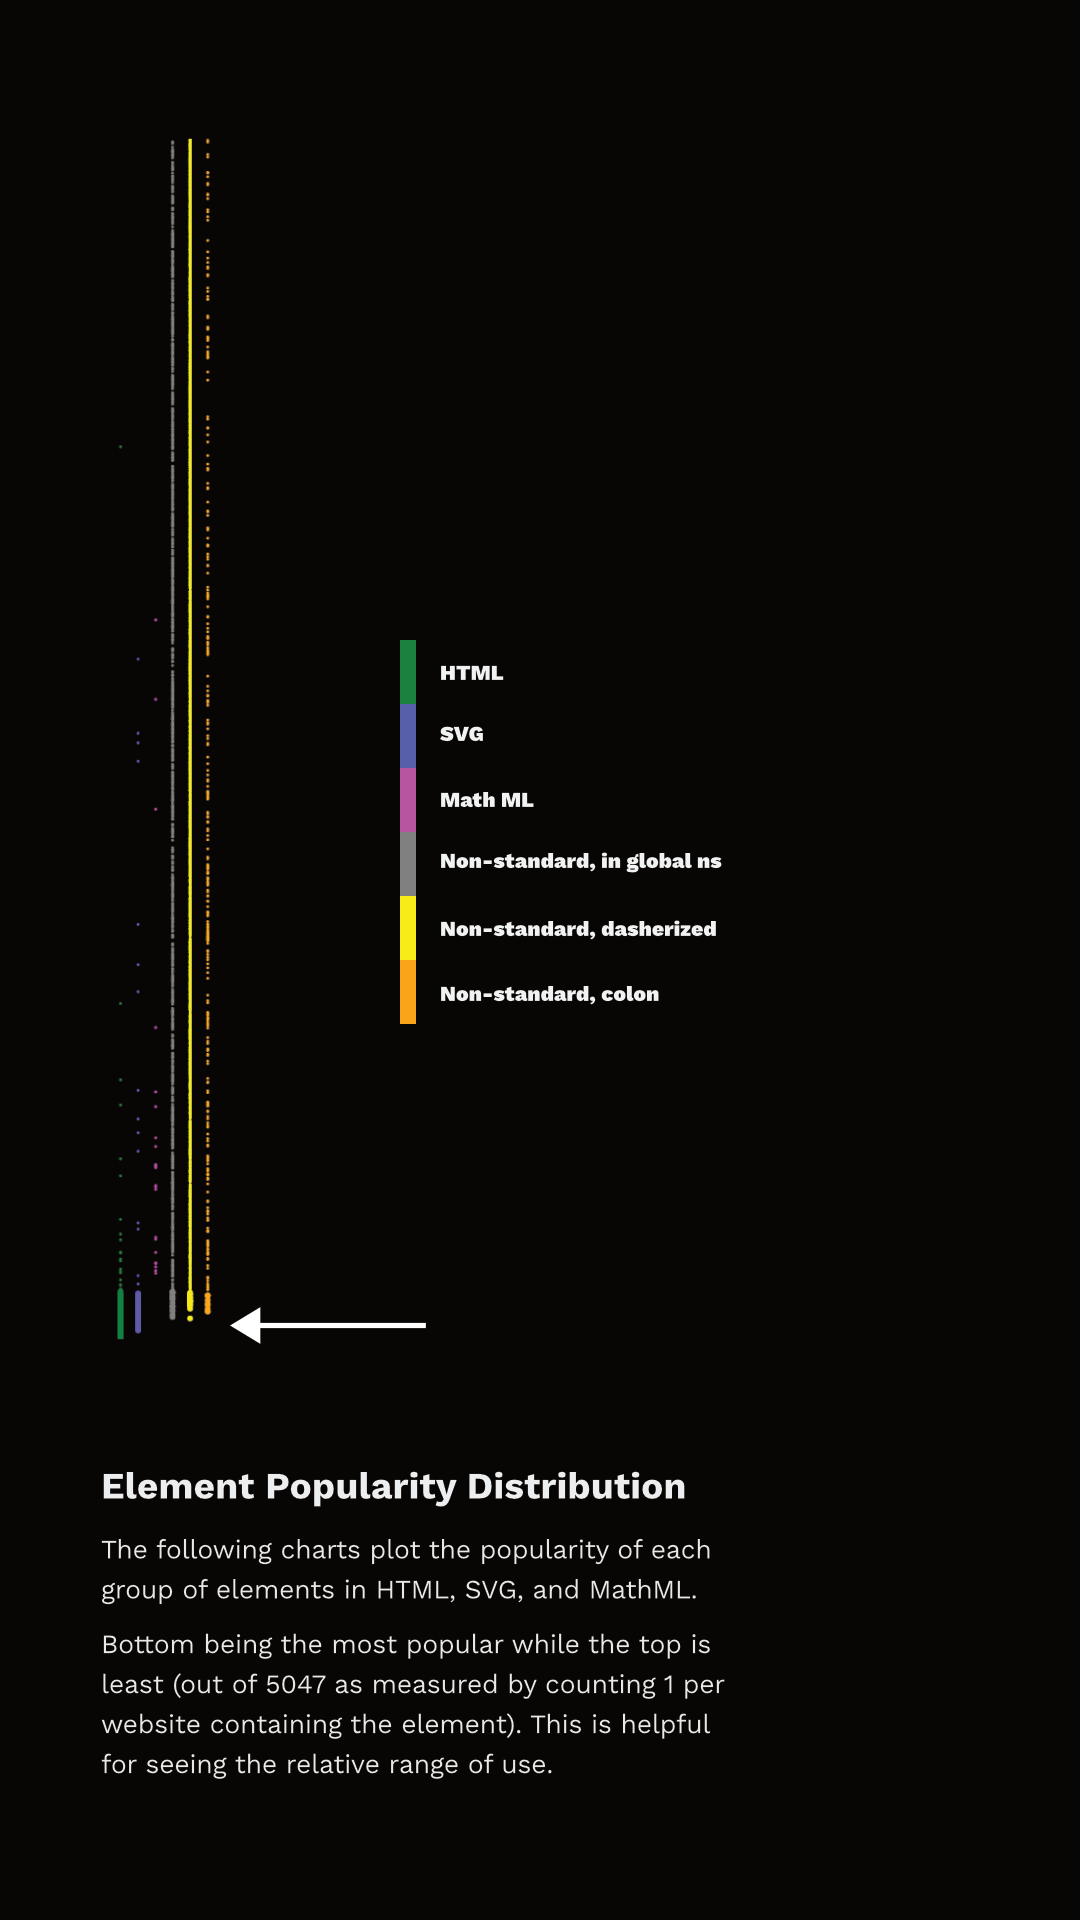
Figure 3.8 shows the rank of each element and which category they fall into. I’ve separated the data points into discrete sets simply so that they can be viewed (otherwise there just aren’t enough pixels to capture all that data), but they represent a single ’line’ of popularity; the bottom-most being the most common, the top-most being the least common. The arrow points to the end of elements that appear in more than 1% of the pages.
You can observe two things here. First, the set of elements that have more than 1% use are not exclusively HTML. In fact, 27 of the most popular 100 elements aren’t even HTML - they are SVG! And there are non-standard tags at or very near that cutoff too! Second, note that a whole lot of HTML elements are used by less than 1% of pages.
So, are all of those elements used by less than 1% of pages “useless”? Definitely not. This is why establishing perspective matters. There are around two billion web sites on the web. If something appears on 0.1% of all websites in our dataset, we can extrapolate that this represents perhaps two million web sites in the whole web. Even 0.01% extrapolates to two hundred thousand sites. This is also why removing support for elements, even very old ones which we think aren’t great ideas, is a very rare occurrence. Breaking hundreds of thousands or millions of sites just isn’t a thing that browser vendors can do lightly.
Many elements, even the native ones, appear on fewer than 1% of pages and are still very important and successful. <code>, for example, is an element that I both use and encounter a lot. It’s definitely useful and important, and yet it is used on only 0.57% of these pages. Part of this is skewed based on what we are measuring; home pages are generally less likely to include certain kinds of things (like <code> for example). Home pages serve a less general purpose than, for example, headings, paragraphs, links and lists. However, the data is generally useful.
We also collected information about which pages contained an author-defined (not native) .shadowRoot. About 0.22% of desktop pages and 0.15% of mobile pages had a shadow root. This might not sound like a lot, but it is roughly 6.5k sites in the mobile dataset and 10k sites on the desktop and is more than several HTML elements. <summary> for example, has about equivalent use on the desktop and it is the 146th most popular element. <datalist> appears on 0.04% of home pages and it’s the 201st most popular element.
In fact, over 15% of elements we’re counting as defined by HTML are outside the top 200 in the desktop dataset . <meter> is the least popular “HTML5 era” element, which we can define as 2004-2011, before HTML moved to a Living Standard model. It is around the 1,000th most popular element. <slot>, the most recently introduced element (April 2016), is only around the 1,400th most popular element.
Lots of data: real DOM on the real web
With this perspective in mind about what use of native/standard features looks like in the dataset, let’s talk about the non-standard stuff.
You might expect that many of the elements we measured are used only on a single web page, but in fact all of the 5,048 elements appear on more than one page. The fewest pages an element in our dataset appears on is 15. About a fifth of them occur on more than 100 pages. About 7% occur on more than 1,000 pages.
To help analyze the data, I hacked together a little tool with Glitch. You can use this tool yourself, and please share a permalink back with the @HTTPArchive along with your observations. (Tommy Hodgins has also built a similar CLI tool which you can use to explore.)
Let’s look at some data.
Products (and libraries) and their custom markup
For several non-standard elements, their prevalence may have more to do with their inclusion in popular third-party tools than first-party adoption. For example, the <fb:like> element is found on 0.3% of pages not because site owners are explicitly writing it out but because they include the Facebook widget. Many of the elements Hixie mentioned 14 years ago seem to have dwindled, but others are still pretty huge:
-
Popular elements created by Claris Home Page (whose last stable release was 21 years ago) still appear on over 100 pages.
<x-claris-window>, for example, appears on 130 pages. -
Some of the
<actinic:*>elements from British ecommerce provider Oxatis appear on even more pages. For example,<actinic:basehref>still shows up on 154 pages in the desktop data. -
Macromedia’s elements seem to have largely disappeared. Only one element,
<mm:endlock>, appears on our list and on only 22 pages. -
Adobe Go-Live’s
<csscriptdict>still appears on 640 pages in the desktop dataset. - Microsoft Office’s
<o:p>element still appears on 0.5% of desktop pages, over 20k pages.
But there are plenty of newcomers that weren’t in Hixie’s original report too, and with even bigger numbers.
-
<ym-measure>is a tag injected by Yandex’s Metrica analytics package. It’s used on more than 1% of desktop and mobile pages, solidifying its place in the top 100 most used elements. That’s huge! -
<g:plusone>from the now-defunct Google Plus occurs on over 21k pages. -
Facebook’s
<fb:like>occurs on 14k mobile pages. -
Similarly,
<fb:like-box>occurs on 7.8k mobile pages. -
<app-root>, which is generally included in frameworks like Angular, appears on 8.2k mobile pages.
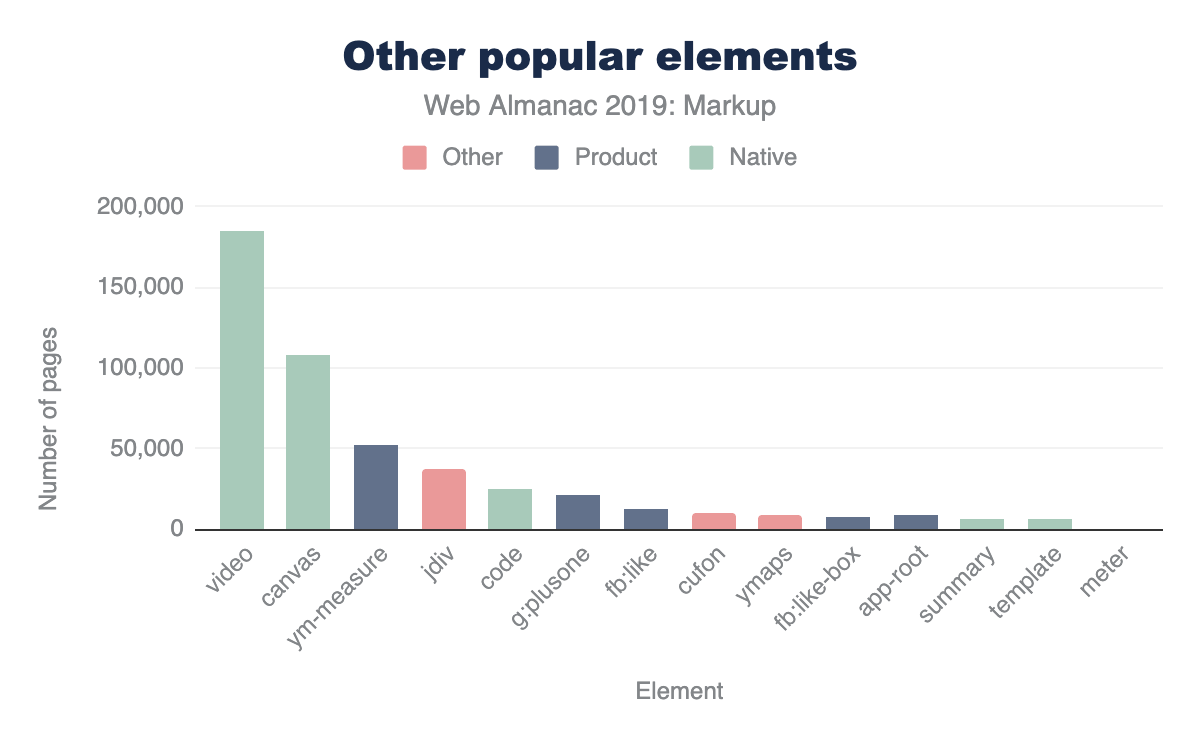
Let’s compare these to a few of the native HTML elements that are below the 5% bar, for perspective.

You could discover interesting insights like these all day long.
Here’s one that’s a little different: popular elements could be caused by outright errors in products. For example, <pclass="ddc-font-size-large"> occurs on over 1,000 sites. This was thanks to a missing space in a popular “as-a-service” kind of product. Happily, we reported this error during our research and it was quickly fixed.
In his original paper, Hixie mentions that:
The good thing, if we can be forgiven for trying to remain optimistic in the face of all this non-standard markup, is that at least these elements are all clearly using vendor-specific names. This massively reduces the likelihood that standards bodies will invent elements and attributes that clash with any of them.
However, as mentioned above, this is not universal. Over 25% of the non-standard elements that we captured don’t use any kind of namespacing strategy to avoid polluting the global namespace. For example, here is a list of 1157 elements like that from the mobile dataset. Many of those, as you can see, are likely to be non-problematic as they have obscure names, misspellings and so on. But at least a few probably present some challenges. You’ll note, for example, that <toast> (which Googlers recently tried to propose as <std-toast>) appears in this list.
There are some popular elements that are probably not so challenging:
-
<ymaps>from Yahoo Maps appears on ~12.5k mobile pages. -
<cufon>and<cufontext>from a font replacement library from 2008, appear on ~10.5k mobile pages. -
The
<jdiv>element, which appears to be injected by the Jivo chat product, appears on ~40.3k mobile pages,
Placing these into our same chart as above for perspective looks something like this (again, it varies slightly based on the dataset)
The interesting thing about these results is that they also introduce a few other ways that our tool can come in very handy. If we’re interested in exploring the space of the data, a very specific tag name is just one possible measure. It’s definitely the strongest indicator if we can find good “slang” developing. However, what if that’s not all we’re interested in?
Common use cases and solutions
What if, for example, we were interested in people solving common use cases? This could be because we’re looking for solutions to use cases that we currently have ourselves, or for researching more broadly what common use cases people are solving with an eye toward incubating some standardization effort. Let’s take a common example: tabs. Over the years there have been a lot of requests for things like tabs. We can use a fuzzy search here and find that there are many variants of tabs. It’s a little harder to count usage here since we can’t as easily distinguish if two elements appear on the same page, so the count provided there conservatively simply takes the one with the largest count. In most cases the real number of pages is probably significantly larger.
There are also lots of accordions, dialogs, at least 65 variants of carousels, lots of stuff about popups, at least 27 variants of toggles and switches, and so on.
Perhaps we could research why we need 92 variants of button related elements that aren’t a native button, for example, and try to fill the native gap.
If we notice popular things pop up (like <jdiv>, solving chat) we can take knowledge of things we know (like, that is what <jdiv> is about, or <olark>) and try to look at at least 43 things we’ve built for tackling that and follow connections to survey the space.
Conclusion
So, there’s lots of data here, but to summarize:
- Pages have more elements than they did 14 years ago, both on average and max.
- The lifetime of things on home pages is very long. Deprecating or discontinuing things doesn’t make them go away, and it might never.
- There is a lot of broken markup out there in the wild (misspelled tags, missing spaces, bad escaping, misunderstandings).
- Measuring what “useful” means is tricky. Lots of native elements don’t pass the 5% bar, or even the 1% bar, but lots of custom ones do, and for lots of reasons. Passing 1% should definitely grab our attention at least, but perhaps so should 0.5% because that is, according to the data, comparatively very successful.
- There is already a ton of custom markup out there. It comes in a lot of forms, but elements containing a dash definitely seem to have taken off.
- We need to increasingly study this data and come up with good observations to help find and pave the cowpaths.
That last one is where you come in. We’d love to tap into the creativity and curiosity of the larger community to help explore this data using some of the tools (like https://rainy-periwinkle.glitch.me/). Please share your interesting observations and help build our commons of knowledge and understanding.
