Jamstack
Introduction
Jamstack is a relatively new concept of an architecture designed to make the web faster, more secure, and easier to scale. It builds on many of the tools and workflows which developers love, and which maximizes productivity.
The core principles of Jamstack are pre-rendering your site pages and decoupling the frontend from the backend. It relies on the idea of delivering the frontend content hosted separately on a CDN provider that uses APIs (for example, a headless CMS) as its backend if any.
The HTTP Archive crawls millions of pages every month and runs them through a private instance of WebPageTest to store key information on every page crawled. You can learn more about this in our methodology page. In the context of Jamstack, HTTP Archive provides extensive information on the usage of the frameworks and CDNs for the entire web. This chapter consolidates and analyzes many of these trends.
The goals of this chapter are to estimate and analyze the growth of the Jamstack sites, the performance of popular Jamstack frameworks, as well as an analysis of real user experience using the Core Web Vitals metrics.
Adoption of Jamstack
Our analysis throughout this work looks at desktop and mobile websites. The vast majority of URLs we looked at are in both datasets, but some URLs are only accessed by desktop or mobile devices. This can cause small divergences in the data, and we thus look at desktop and mobile results separately.
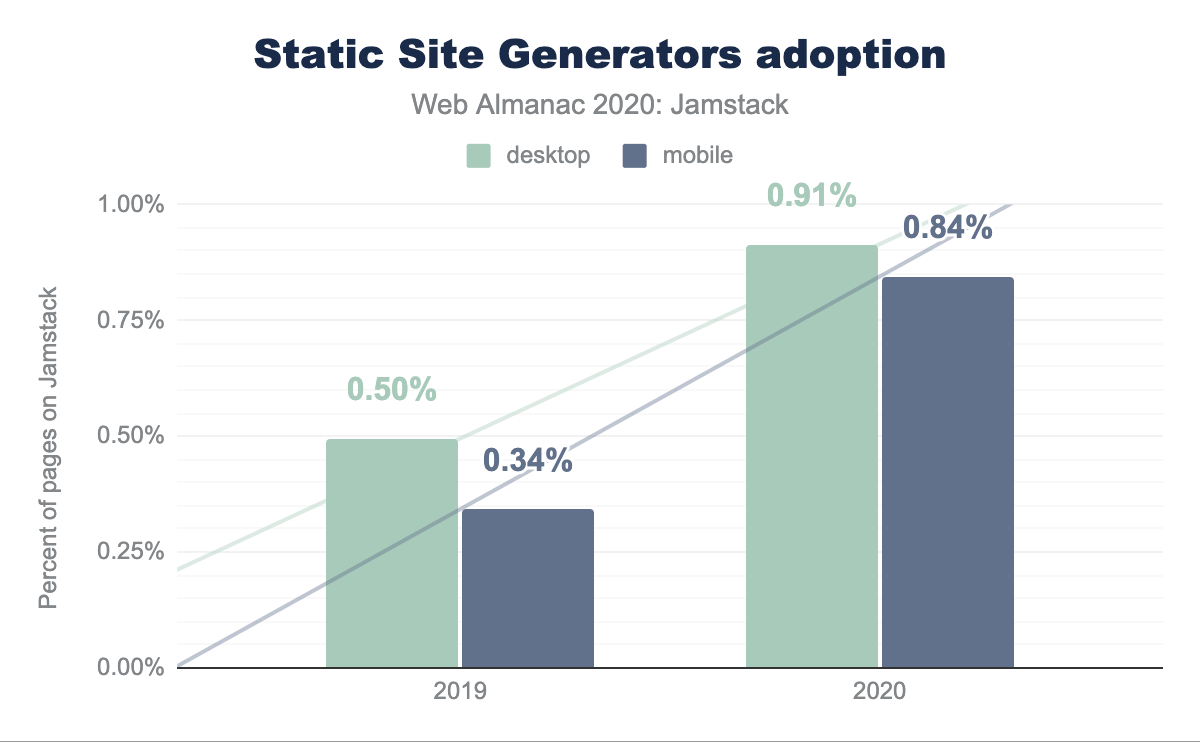
Approximately 0.9% of web pages are powered by Jamstack and breaks down to 0.91% on desktop, up from 0.50% in 2019, and 0.84% on mobile, up from 0.34% in 2019.
| Year | Desktop | Mobile |
|---|---|---|
| 2019 | 0.50% | 0.34% |
| 2020 | 0.91% | 0.85% |
| % Change | 85% | 147% |
The increase in desktop web pages powered by a Jamstack framework is 85% from last year. On mobile, this increase is almost two and a half times, at 147%. This is a significant growth from 2019, especially for mobile pages. We believe this is a sign of the steady growth of the Jamstack community.
Jamstack frameworks
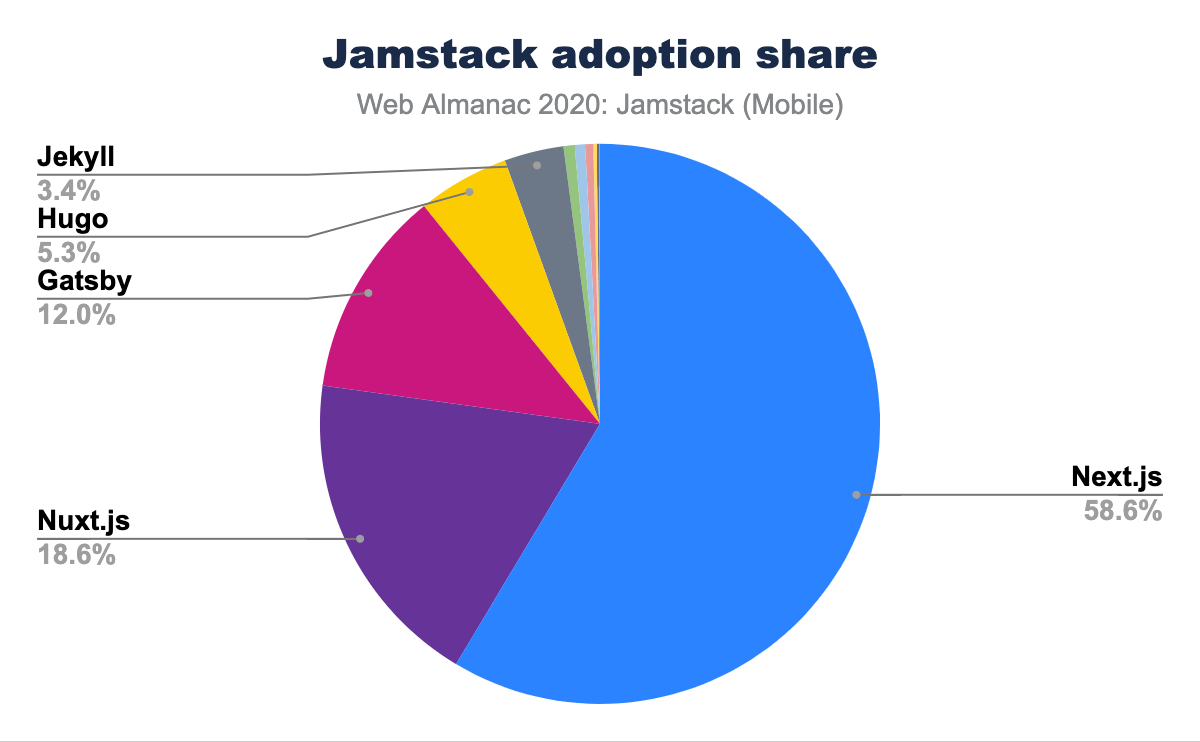
Our analysis counted 14 separate Jamstack frameworks. Only six frameworks had more than 1% share: Next.js, Nuxt.js Gatsby, Hugo, Jekyll are the top contenders for the Jamstack market share.
In 2020, most of the Jamstack market share seems distributed between the top five frameworks. Interestingly, Next.js has 58.65% usage share. This is over three times the share of the next most popular Jamstack framework, Nuxt.js at 18.6%!
Framework adoption changes
Looking at the year on year growth, we see that Next.js has increased its lead over its competitors in the last year:
| Jamstack | 2019 | 2020 | % change |
|---|---|---|---|
| Next.js | 47.89% | 58.59% | 22% |
| Nuxt.js | 20.30% | 18.59% | -8% |
| Gatsby | 12.45% | 11.99% | -4% |
| Hugo | 9.50% | 5.30% | -44% |
| Jekyll | 6.22% | 3.43% | -45% |
| Hexo | 1.16% | 0.64% | -45% |
| Docusaurus | 1.26% | 0.60% | -52% |
| Gridsome | 0.19% | 0.46% | 140% |
| Octopress | 0.61% | 0.20% | -68% |
| Pelican | 0.31% | 0.11% | -64% |
| VuePress | 0.05% | ||
| Phenomic | 0.10% | 0.02% | -77% |
| Saber | 0.01% | ||
| Cecil | 0.01% | -100% |
And concentrating on the top 5 Jamstacks further shows Next.js’s lead:
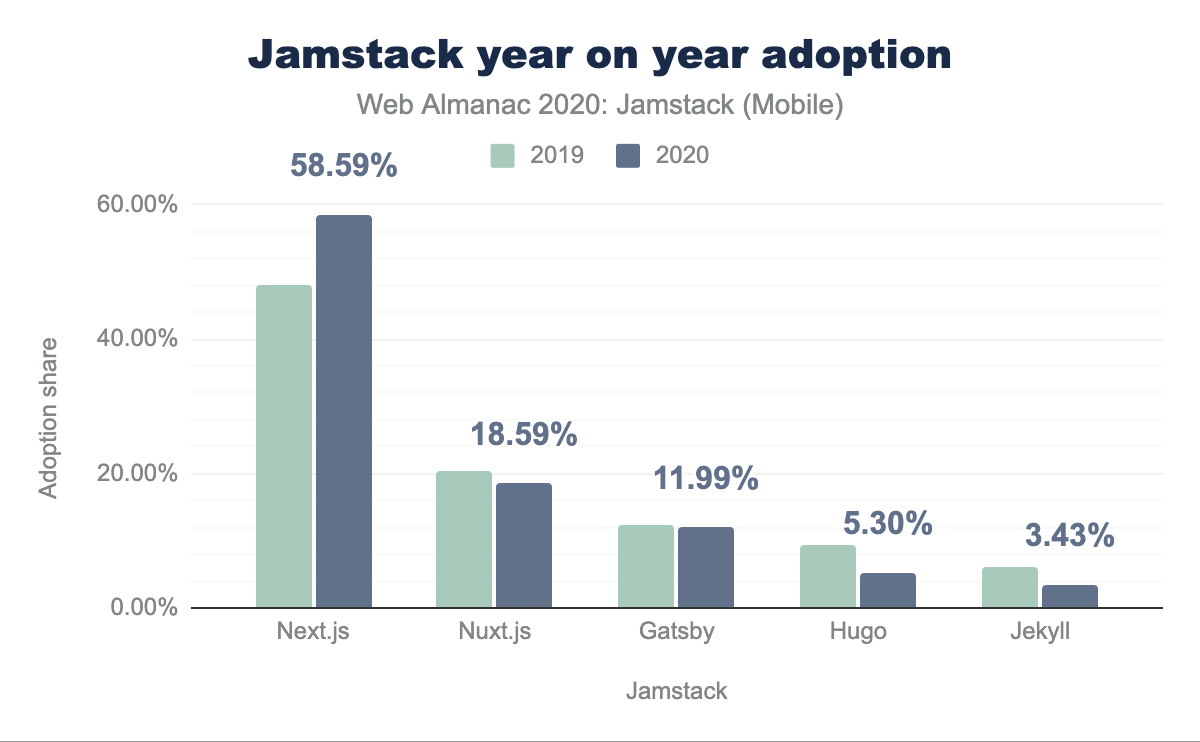
It’s worth noting here the fact that Next.js and Nuxt.js websites include a mix of both Static Site Generated (SSG) pages and Server-Side Rendered (SSR) pages. This is due to the lack of our ability to measure them separately. This means that the analysis may include sites that are mostly or partially server-rendered, meaning they do not fall under the traditional definition of a Jamstack site. Nonetheless, it appears that this hybrid nature of Next.js gives it a competitive advantage over other frameworks hence making it more popular.
Environmental impact
This year we have sought to better understand the impact of Jamstack sites on the environment. The information and communications technology (ICT) industry accounts for 2% of global carbon emissions, and data centers specifically account for 0.3% of global carbon emissions. This puts the ICT industry’s carbon footprint equivalent to the aviation industry’s emissions from fuel.
Jamstack is often credited for being mindful of performance. In the next section, we look into the carbon emissions of Jamstack websites.
Page weight
Our research looked at the average Jamstack page weight in KB and mapped this to CO2 emissions using logic from the Carbon API. This generated the following results, split by desktop and mobile:
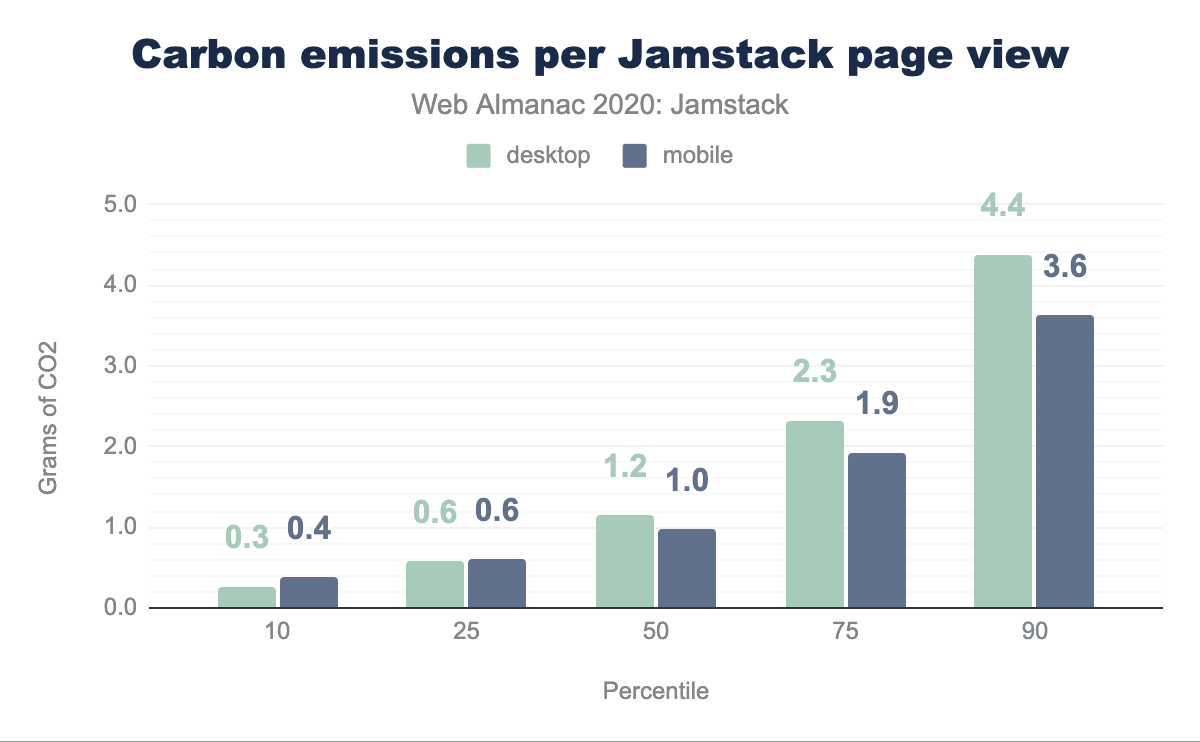
We found that the median Jamstack page load resulted in the transfer of 1.82 MB of various assets on desktop, and 1.54 MB on mobile, and thus the emission of 1.2 grams and 1.0 grams of CO2 respectively. The most efficient percentile of Jamstack web pages result in the generation of at least one third less CO2 than the median, whilst the least efficient percentile of Jamstack web pages goes the other way, generating around four times more.
Page weights are important here. The average desktop Jamstack web page loads 1.5 MB of video, image, script, font, CSS, and audio data. 10% of pages, however, load over 4 MB of this data. On mobile devices, the average web page loads 0.28 MB fewer than on desktop, a fact consistent across all percentiles.
Image formats
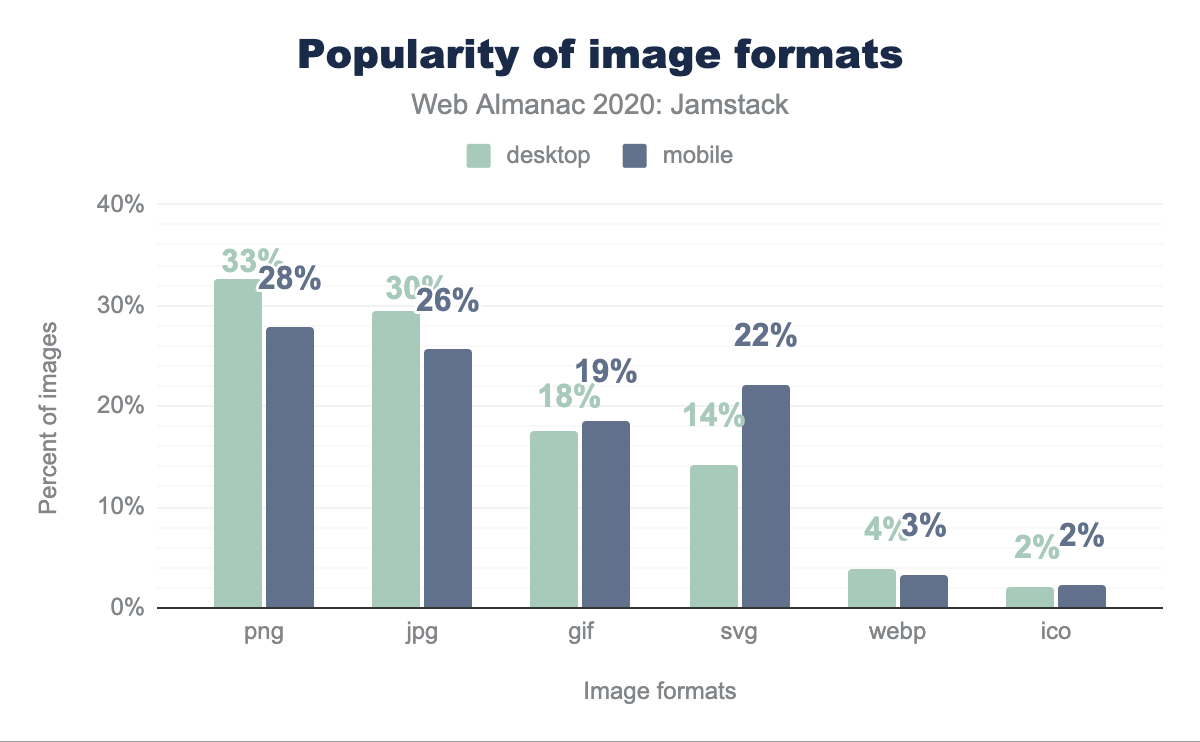
Popular image formats are PNG, JPG, GIF, SVG, WebP, and ICO. Of these, WebP is the most efficient in most situations, with WebP lossless images 26% smaller than equivalent PNGs and 25-34% smaller than comparable JPGs. We see, however, that WebP is the second least popular image format across all Jamstack pages, where PNG is the most popular both for mobile and desktop. Only slightly less popular is JPG whereas GIF is almost 20% of all the images used on Jamstack sites. An interesting discovery is SVG which is almost twice as popular on mobile sites as desktop sites.
Third-party bytes
Jamstack sites, like most websites, often load third-party resources, such as external images, videos, scripts, or stylesheets:
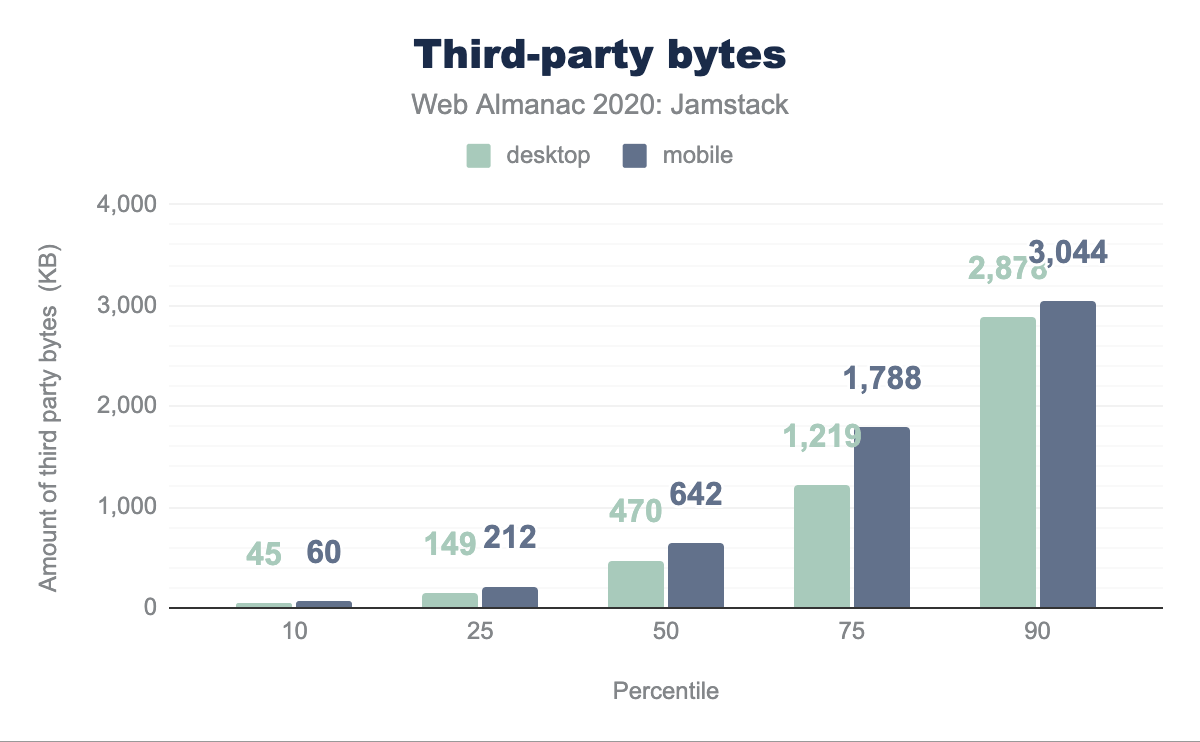
We find that the median desktop Jamstack page has 26 third-party requests with 470 KB of content, with the mobile equivalent generating 38 requests with 642 KB of content. Whereas 10% of the desktop sites have 114 requests with 2.88MB of content which is only superseded by 148 requests on mobile with 3MB of content.
User experience
Jamstack websites are often said to offer a good user experience. It’s what the entire concept of separating the frontend from the backend and hosting it on the CDN edge is all about. We aim to shed light on real-world user experience when using Jamstack websites using the recently launched Core Web Vitals.
The Core Web Vitals are three important factors which can shed light on our understanding of how users are experiencing Jamstack pages in the wild:
- Largest Contentful Paint (LCP)
- First Input Delay (FID)
- Cumulative Layout Shift (CLS)
These metrics aim to cover the core elements which are indicative of a great web user experience. Let’s we take a look at the real-world Core Web Vitals statistics of the top-five Jamstack frameworks.
Largest Contentful Paint
Largest Contentful Paint (LCP) measures the point when the page’s main content has likely loaded and thus the page is useful to the user. It does this by measuring the render time of the largest image or text block visible within the viewport.
This is different from First Contentful Paint (FCP), which measures from page load until content such as text or an image is first displayed. LCP is regarded as a good proxy for measuring when the main content of a page is loaded.
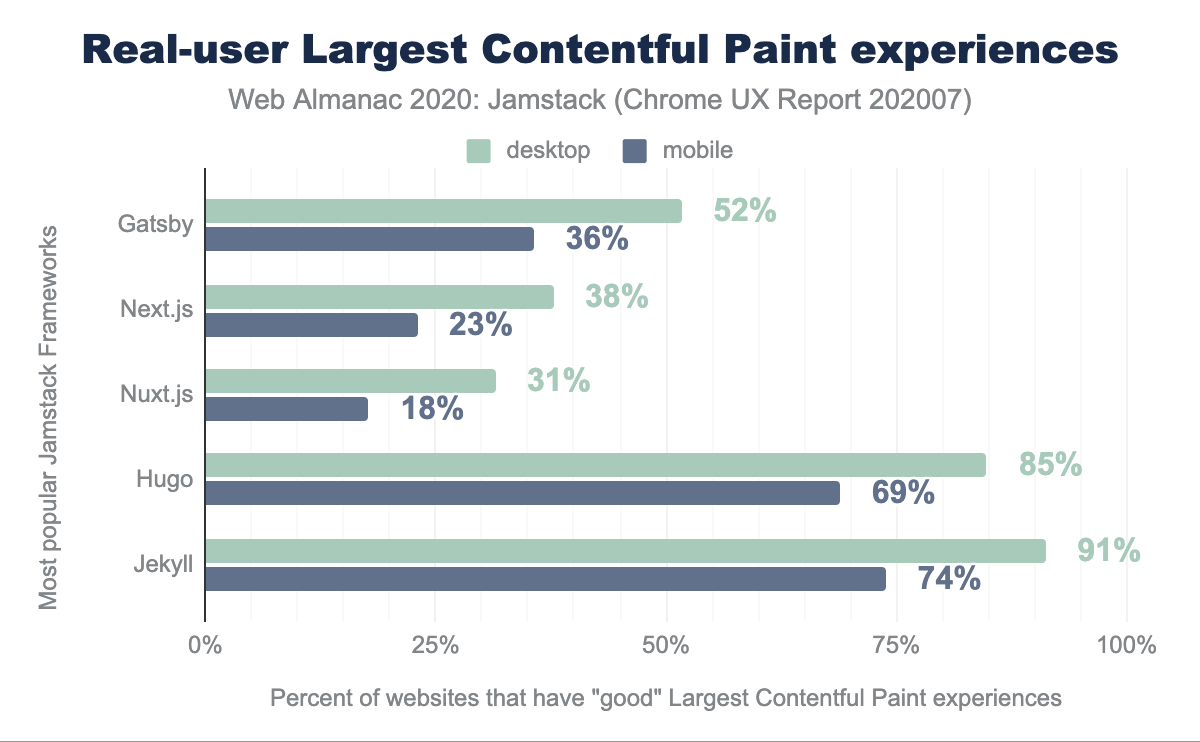
A “good” LCP is regarded as under 2.5 seconds. Jekyll and Hugo have impressive LCP scores all above 50% with Jekyll and Hugo on desktop at 91% and 85% on desktop respectively. Gatsby, Next.js and Nuxt.js sites lagged — scoring 52%, 38%, and 31% respectively on desktop, and 36%, 23%, and 18% on mobile.
This might be attributed to the fact that most of the sites built with Gatsby, Next.js and Nuxt.js have complex layouts and high page weights, in comparison with Hugo and Jekyll which are primarily used to produce static content sites with fewer or no dynamic parts. For what it’s worth, you don’t have to use React, VueJS or any other JavaScript framework with Hugo or Jekyll.
As we explored in the section above, high page weights can have a possible impact on the environment. However, this also affects LCP performance, which is either very good or generally bad depending on the Jamstack framework. This can have an impact on the real user experience as well.
First Input Delay
First Input Delay (FID) measures the time from when a user first interacts with your site (i.e. when they click a link, tap on a button, or use a custom, JavaScript-powered control) to the time when the browser is actually able to respond to that interaction.
A “fast” FID from a user’s perspective would provide immediate feedback from their actions on a site rather than a stalled experience. This delay is a pain point and could correlate with interference from other aspects of the site loading when the user tries to interact with the site.
FID is extremely fast for the average Jamstack website on desktop – most popular frameworks score 100% – and above 80% on mobile.
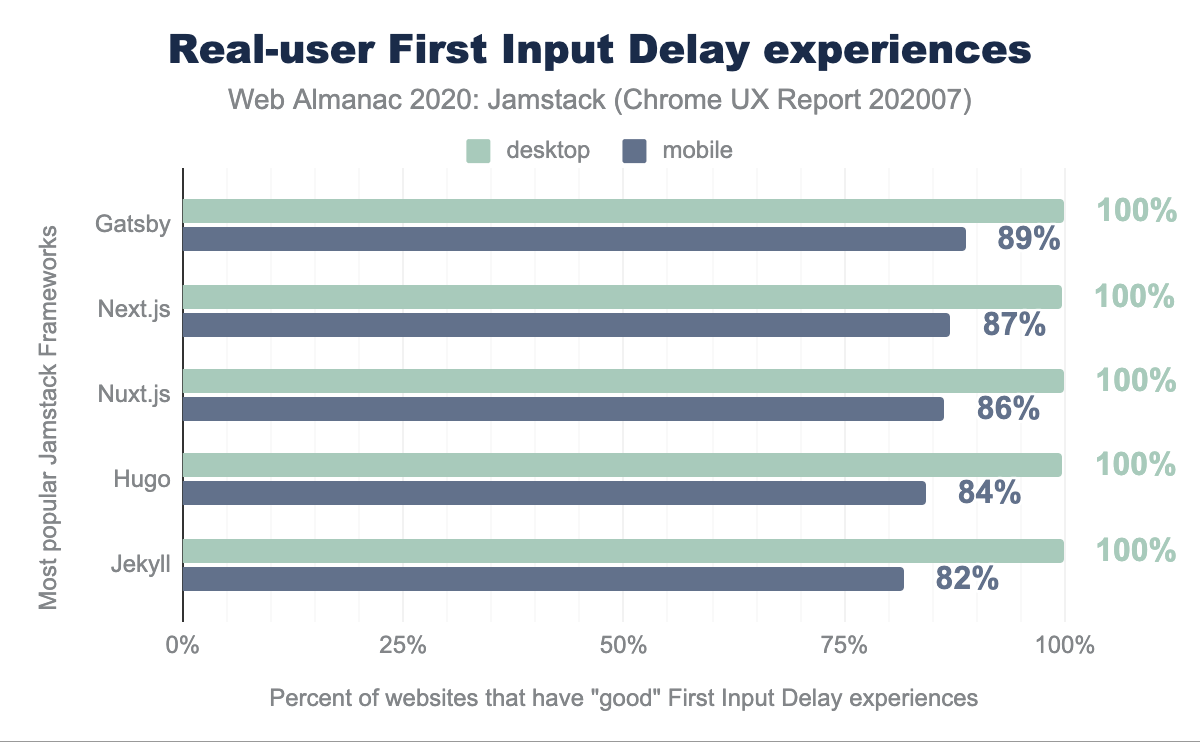
There is a small margin of difference between the resources shipped to desktop and mobile versions of a website. The FID scores are generally very good here, but it is interesting this does not translate to similar LCP scores. As suggested, the weight of individual pages on Jamstack sites in addition to mobile connection quality could play a role in the performance gaps that we see here.
Cumulative Layout Shift
Cumulative Layout Shift (CLS) measures the instability of content on a web page within the first 500ms of user input. CLS measures any layout changes which happen after user input. This is important on mobile in particular, where the user will tap where they want to take an action – such as a search bar – only for the location to move as additional images, ads, or similar load.
A score of 0.1 or below is good, over 0.25 is poor, and anything in between needs improvement.
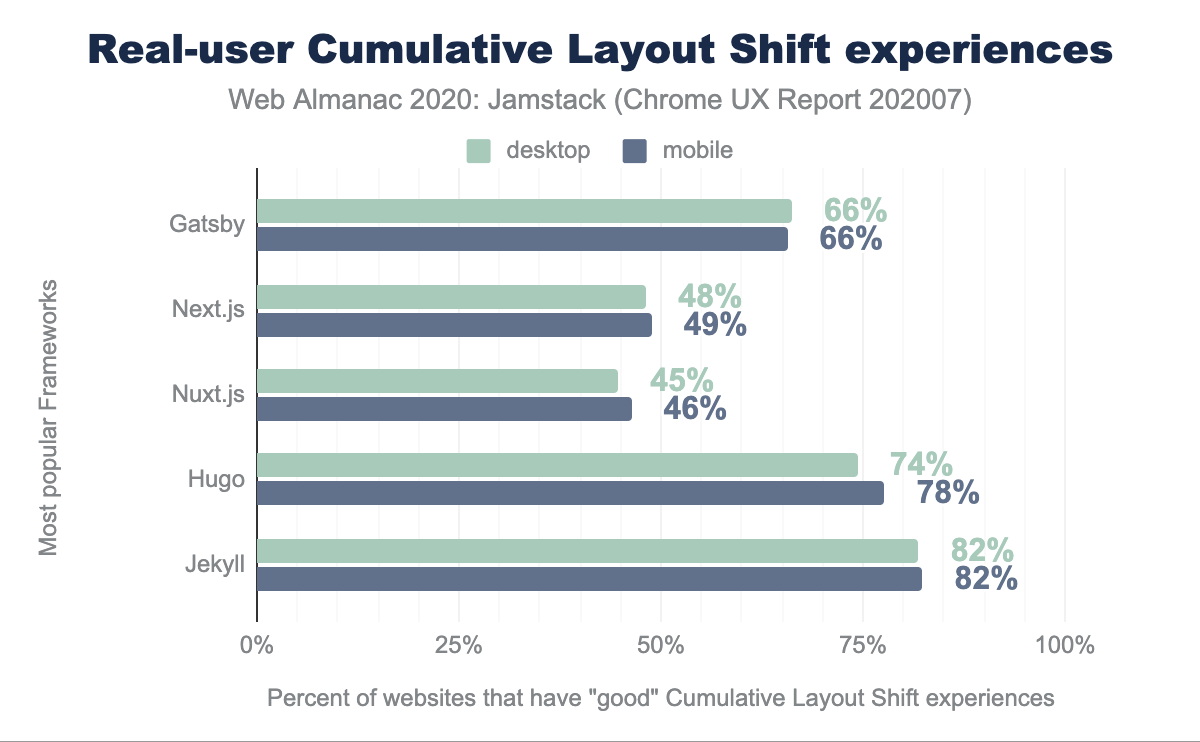
The top-five Jamstack frameworks do OK here. About 65% of web pages loaded by top-five Jamstack frameworks have a “good” CLS experience, with this figure rising to 82% on mobile. Across all the average desktop and mobile score is 65%. Next.js and Nuxt.js are both under 50% and have work to do here. Educating developers and documenting how to avoid bad CLS scores can go a long way.
Conclusion
Jamstack, both as a concept and a stack, has picked up importance in the last year. Stats suggest almost twice as many Jamstack sites exist now than in 2019. Developers enjoy a better development experience by separating the frontend from the backend (a headless CMS, serverless functions, or third-party services). But what about the real-user experience of browsing Jamstack sites?
We’ve reviewed the adoption of Jamstack, user experience of websites created by these Jamstack frameworks, and for the first time looked at the impact of Jamstack on the environment. We have answered many questions here but leave further questions unanswered.
There are frameworks like Eleventy which we weren’t able to measure or analyze since there is no pattern available to determine the usage of such frameworks, which has an impact on the data presented here. Next.js dominates usage and offers both Static Site Generation and Server-Side Rendering, separating the two in this data is nearly impossible since it also offers incremental Static Generation. Further research building on this chapter will be gratefully received.
Moreover, we have highlighted some areas which need attention from the Jamstack community. We hope there will be progress to share in the 2021 report. Different Jamstack frameworks can start to document how to improve real user experience by looking at Core Web Vitals.
Vercel, one of the CDNs meant to host Jamstack sites, has built an analytics offering called Real User Experience Score. While other performance measuring tools like Lighthouse estimate your user’s experience by running a simulation in a lab, Vercel’s Real Experience Score is calculated using real data points collected from the devices of the actual users of your application.
It is probably worth noting here that Vercel created and maintains Next.js, since Next.js had low LCP scores. This new offering could mean we can hope to see a marked improvement in those scores next year. This would be extremely helpful information for users and developers alike.
Jamstack frameworks are improving the developer experience of building sites. Let’s work towards continued progress for improving the real-user experience of browsing Jamstack sites.
