Ecommerce

Introduction
Ecommerce is no longer a special case on the web-it is the web. In 2025, buying journeys start in search results, social feeds, and live streams; they continue in voice assistants, messaging apps, and lean‑back surfaces like smart TVs; and increasingly, they can be completed by AI agents acting on a shopper’s behalf. An ecommerce website is still an online store that sells physical or digital products, but it now sits at the intersection of product pages, payments, performance, accessibility, and trust.
When building an online store, there are a few common platform models:
- Software-as-a-Service (SaaS) platforms (e.g., Shopify) minimize the technical knowledge required to run a store by controlling the codebase and abstracting hosting.
- Platform-as-a-Service (PaaS) solutions (e.g., Adobe Commerce / Magento) provide an optimized technology stack and hosting environment while still allowing full code access.
- Self-hosted platforms (e.g., WooCommerce, OpenCart) run on infrastructure managed by the merchant or their agency.
- Headless / API-first platforms (e.g., Commercetools, Medusa) provide the commerce backend as a service, while the merchant owns the frontend experience and hosting.
- Agentic commerce (agent-ready commerce) layers sit alongside (or on top of) the storefront: structured product data, inventory, policies, identity, and payment flows exposed through APIs and standards so assistants and AI agents can safely discover products and execute purchases-with clear user consent and guardrails.
Platforms may fall into more than one category. For example, some vendors offer SaaS, PaaS, and self-hosted options, and many headless builds still rely on SaaS backends under the hood. The important variables are who controls hosting, who controls the runtime and upgrade path, and how much freedom you have to change the frontend and backend.
Platform detection
We used a tool called Wappalyzer to detect technologies used by websites. It can detect ecommerce platforms, content management systems, JavaScript frameworks, analytics, and more.
For this analysis, we considered a site to be ecommerce if we detected either:
- Use of a known ecommerce platform, or
- Use of a technology that strongly implies an online store (for example, enhanced ecommerce analytics).
Limitations in recognizing ecommerce sites
Our methodology has limitations that affect accuracy.
- We can only recognize ecommerce sites when Wappalyzer detects an ecommerce platform or a strong ecommerce signal.
- Detecting a payment processor alone (for example, PayPal) is not sufficient to classify a site as ecommerce, because many non‑store sites also take payments.
- If the store is hosted in a subdirectory, it may be missed. We crawl the home page and one other page (the largest internal link) per site and per client (desktop and mobile).
- Headless implementations reduce platform detectability because the traditional fingerprints in HTML/JS often disappear.
- Apparent trends can be influenced by improvements or regressions in detection, not just industry shifts.
- Crawl geography matters: results may differ when sites redirect based on location.
- The underlying site set is drawn from Chrome’s field data ecosystem, which biases toward sites visited by Chrome users.
Overall adoption
In the 2025 dataset, we detected 19.9% of all analyzed desktop sites and 19.2% of all analyzed mobile sites where ecommerce sites.
That headline number is the first reminder that ecommerce is not just “a vertical”-it’s a major slice of what real users experience on the open web.
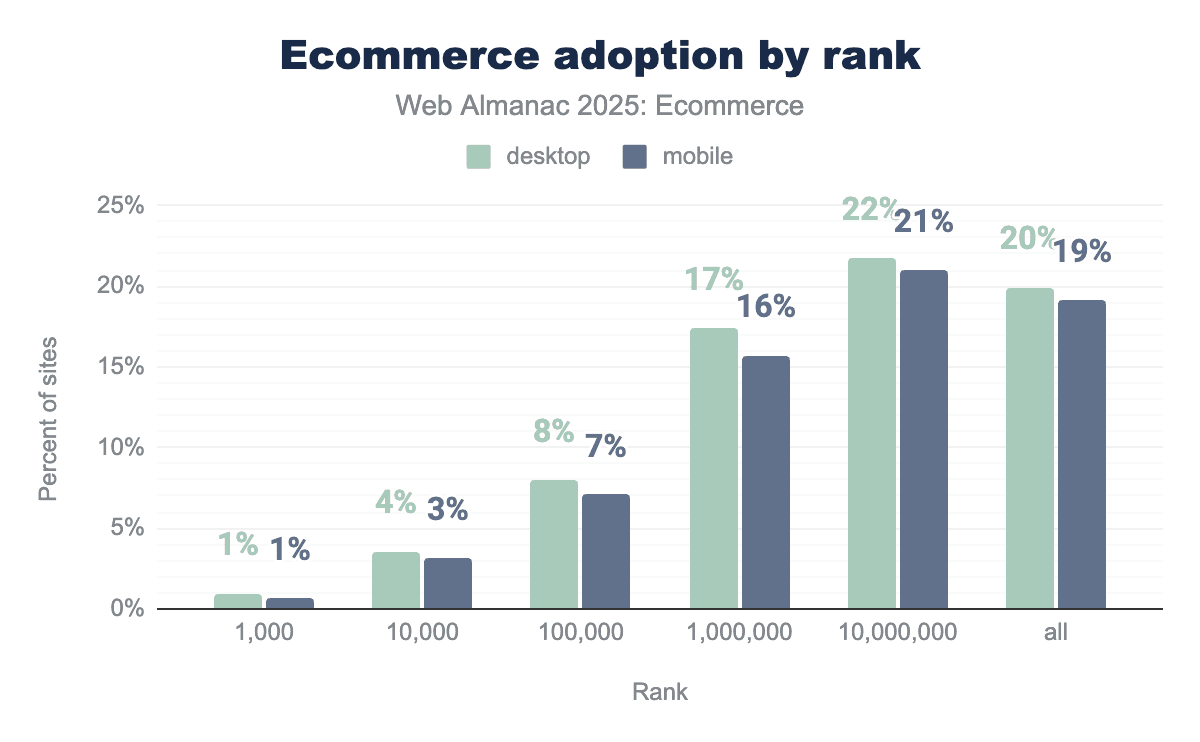
Adoption by rank
In general, the most popular sites are more likely to be professionally engineered, heavily optimized, and backed by larger budgets.
The pattern is consistent:
- Share of sites that are ecommerce increases as we include less‑popular sites.
- At the very top of the web (top 1,000), ecommerce is present but rare.
- This grows over each rank.
- By the time you reach the top 10 million, roughly one in five sites is an online store.
Adoption trend
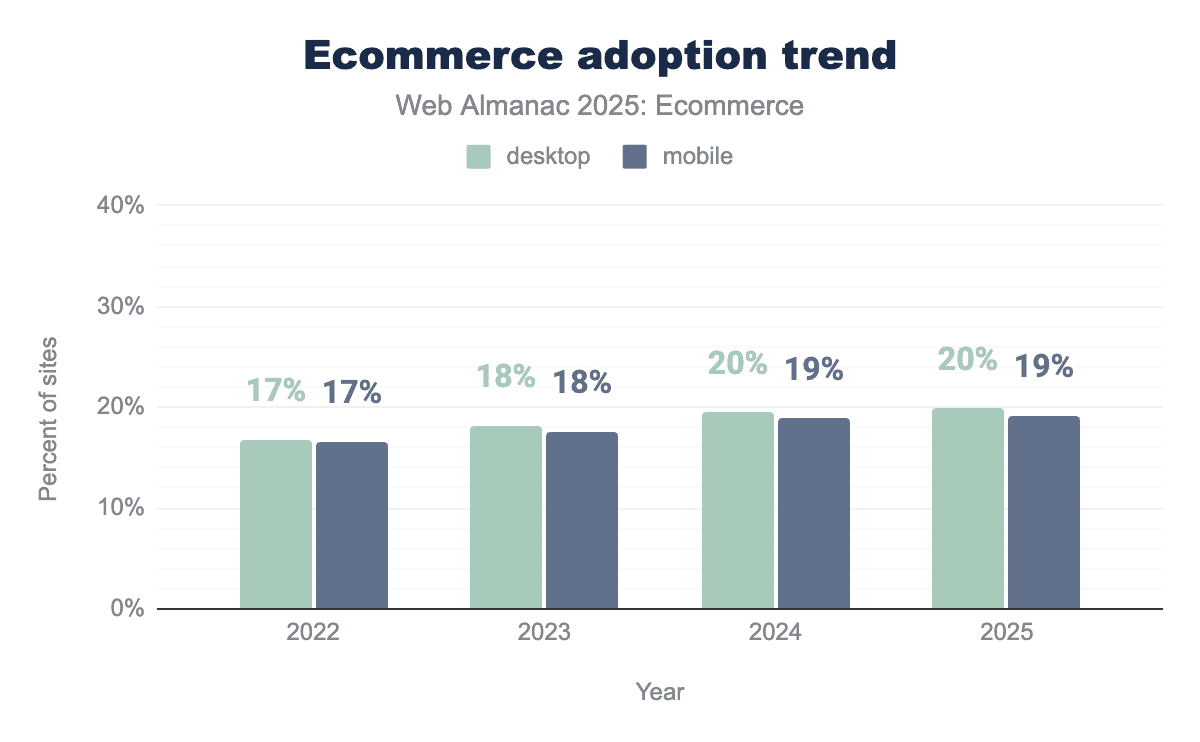
Looking at the trend over time we see a gradual increase year on year.
Platform market share
Across both desktop and mobile, the platform landscape remains top-heavy: a small set of systems account for the majority of detected stores, while a long tail of niche and regional platforms fills the rest.
The following tables show the share of detected ecommerce sites within ecommerce (platform market share), and also how often each platform appears across all sites in the dataset.
| Platform | % ecommerce sites | % all sites |
|---|---|---|
| WooCommerce | 35.4% | 7.1% |
| Shopify | 21.5% | 4.3% |
| Squarespace Commerce | 9.1% | 1.8% |
| Wix eCommerce | 7.8% | 1.6% |
| PrestaShop | 3.2% | 0.6% |
| 1C-Bitrix | 2.2% | 0.5% |
| Magento | 2.1% | 0.4% |
| OpenCart | 1.1% | 0.2% |
| Cafe24 | 1.0% | 0.2% |
| BigCommerce | 0.8% | 0.2% |
| Platform | % ecommerce sites | % all sites |
|---|---|---|
| WooCommerce | 44.4% | 7.0% |
| Shopify | 25.3% | 4.0% |
| Wix eCommerce | 11.1% | 1.8% |
| Squarespace Commerce | 9.9% | 1.6% |
| PrestaShop | 3.7% | 0.6% |
| 1C-Bitrix | 3.3% | 0.5% |
| Magento | 2.2% | 0.3% |
| OpenCart | 1.4% | 0.2% |
| Tiendanube | 1.0% | 0.2% |
| Square Online | 0.9% | 0.1% |
Trends since 2024
If you zoom out to the last few years, the story is less about disruption and more about slow consolidation
- WooCommerce remains the largest ecosystem, staying roughly flat (about 36% → 36% of ecommerce sites from 2024 to 2025).
- Shopify continues to gain share (about 20% → 21%).
- Wix eCommerce is the fastest climber in the top 5 (about 7% → 8%).
- PrestaShop continues to trend down in share (about 4% → 3%).
In other words: the default choices are getting more default, and smaller open‑source ecosystems are having to compete harder on developer experience, hosting simplicity, and performance out of the box.
Top platforms by tier
Different tiers have different top platforms.
| Position | Top 1,000 | Top 10,000 | Top 100,000 | Top 1,000,000 | Top 10,000,000 | All |
|---|---|---|---|---|---|---|
| 1 | Amazon Webstore | Amazon Webstore | Shopify | Shopify | WooCommerce | WooCommerce |
| 2 | Magento | Salesforce Commerce Cloud | Magento | WooCommerce | Shopify | Shopify |
| 3 | Pattern by Etsy | SAP Commerce Cloud | Salesforce Commerce Cloud | Magento | Squarespace Commerce | Squarespace Commerce |
| 4 | Magento | Amazon Webstore | PrestaShop | PrestaShop | Wix eCommerce | |
| 5 | Shopify | WooCommerce | 1C-Bitrix | Wix eCommerce | PrestaShop |
| Position | Top 1,000 | Top 10,000 | Top 100,000 | Top 1,000,000 | Top 10,000,000 | All |
|---|---|---|---|---|---|---|
| 1 | Magento | Amazon Webstore | Shopify | Shopify | WooCommerce | WooCommerce |
| 2 | Amazon Webstore | Salesforce Commerce Cloud | Magento | WooCommerce | Shopify | Shopify |
| 3 | Pattern by Etsy | SAP Commerce Cloud | Salesforce Commerce Clous | Magento | Squarespace Commerce | Wix eCommerce |
| 4 | Magento | Amazon Webstore | PrestaShop | PrestaShop | Squarespace Commerce | |
| 5 | Shopify | WooCommerce | 1C-Bitrix | Wix eCommerce | PrestaShop |
- In the very top ranks, enterprise and bespoke ecosystems show up more often.
- In the broader web, the long‑tail winners (especially WooCommerce) dominate by volume.
Top platforms by geography
Platform dominance changes by region because of language, local payment rails, agency ecosystems, and the historical footprint of vendors.
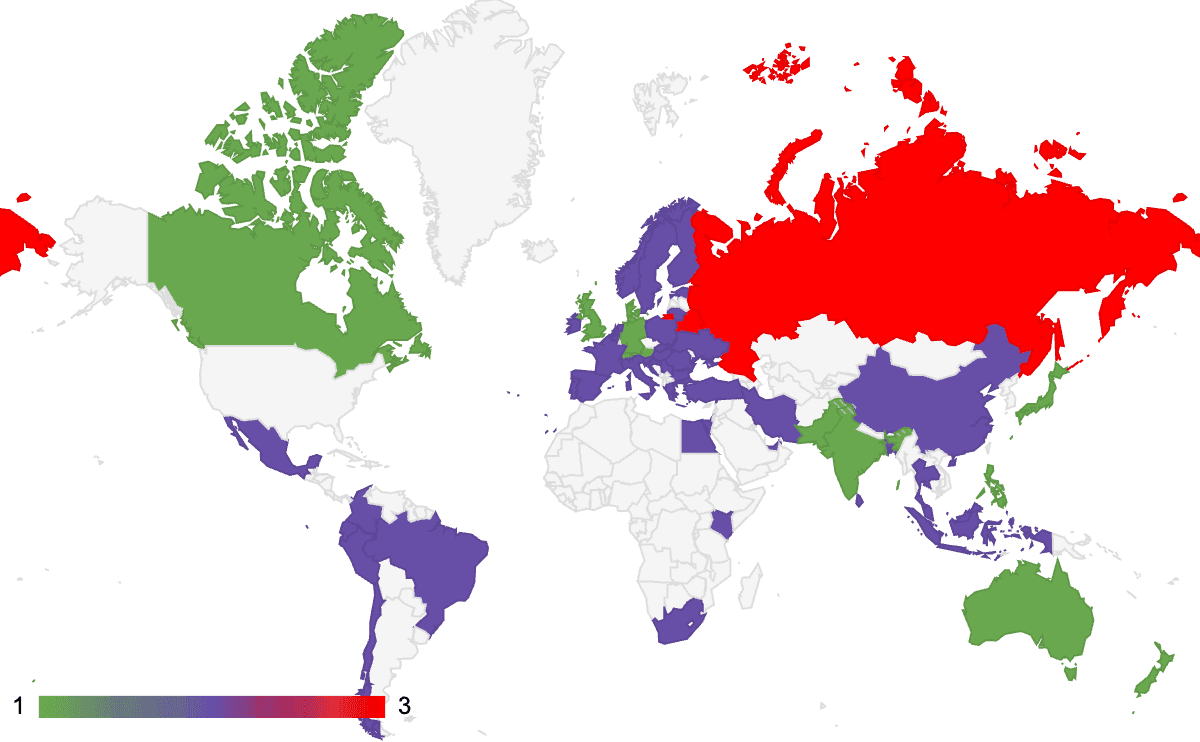
The three leading platforms take the top spot in most countries: WooCommerce (violet), Shopify (green), and 1C-Bitrix (red).
- On desktop, WooCommerce is the most common platform in 42 of 59 geographies in our country‑level view (excluding the ALL aggregate).
- On mobile, WooCommerce leads even more often: 71 of 89 (excluding the ALL aggregate).
There are also meaningful regional exceptions:
- 1C‑Bitrix leads in parts of Eastern Europe and Central Asia (e.g., Russian Federation, Belarus, Kazakhstan, Kyrgyzstan).
- Tiendanube stands out in Argentina.
- Shoptet appears as a leader in Czechia.
- Cafe24 leads in South Korea.
- Salla shows up strongly in Saudi Arabia.
Core Web Vitals in ecommerce
Ecommerce sites are unusually sensitive to performance because every extra second compounds: slower category pages reduce product views; slower product pages reduce add‑to‑carts; slower checkout flows reduce conversion.
We use Core Web Vitals (CWV) field metrics to summarize real‑user experience:
- LCP (Largest Contentful Paint): measures loading performance. It captures how quickly the main content becomes visible. In ecommerce, it often maps to hero imagery, product grids, and critical CSS/JS that blocks rendering.
- INP (Interaction to Next Paint): measures responsiveness. It captures the delay between a user action (tap/click) and the next visual update. It is sensitive to heavy JavaScript, third-party tags, and main-thread contention.
- CLS (Cumulative Layout Shift): measures visual stability. It captures how much content shifts as the page loads. It’s especially relevant to ecommerce because late-loading product images, personalization widgets, and promo banners can cause mis-clicks.
A site is considered “good” on CWV when it passes all three thresholds.
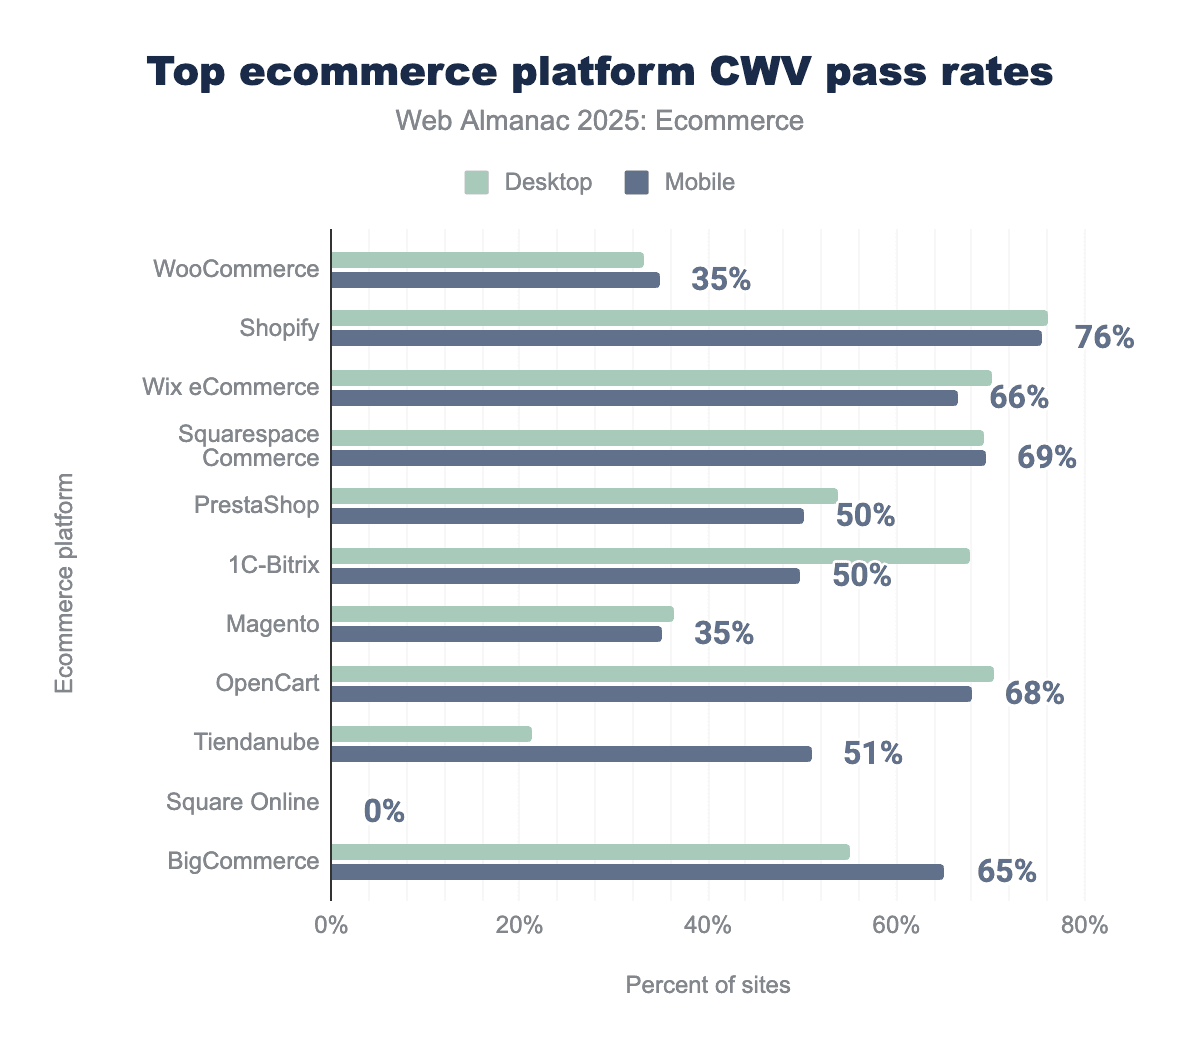
CWV by platform
| Platform | Origins | Good LCP | Good INP | Good CLS | Good CWV |
|---|---|---|---|---|---|
| WooCommerce | 394,462 | 45% | 99% | 68% | 33% |
| Shopify | 289,885 | 92% | 99% | 82% | 76% |
| Squarespace Commerce | 80,900 | 90% | 100% | 78% | 69% |
| Wix eCommerce | 55,706 | 77% | 99% | 91% | 70% |
| PrestaShop | 45,256 | 74% | 99% | 72% | 54% |
| Magento | 36,988 | 59% | 99% | 55% | 36% |
| 1C-Bitrix | 31,150 | 86% | 99% | 80% | 68% |
| OpenCart | 14,452 | 87% | 99% | 80% | 70% |
| Cafe24 | 13,661 | 98% | 100% | 46% | 45% |
| BigCommerce | 12,376 | 91% | 99% | 60% | 55% |
| Platform | Origins | Good LCP | Good INP | Good CLS | Good CWV |
|---|---|---|---|---|---|
| WooCommerce | 995,782 | 39% | 88% | 85% | 35% |
| Shopify | 567,932 | 86% | 90% | 92% | 76% |
| Wix eCommerce | 234,055 | 76% | 85% | 95% | 66% |
| Squarespace Commerce | 209,650 | 76% | 96% | 89% | 69% |
| PrestaShop | 87,486 | 65% | 89% | 81% | 50% |
| 1C-Bitrix | 76,080 | 71% | 71% | 86% | 50% |
| Magento | 50,983 | 52% | 87% | 64% | 35% |
| OpenCart | 32,914 | 80% | 93% | 88% | 68% |
| Tiendanube | 21,836 | 60% | 95% | 84% | 51% |
| Square Online | 18,812 | 0% | 39% | 0% | 0% |
A few patterns show up repeatedly:
- INP is generally strong on desktop across most major platforms, suggesting that modern JS stacks and browser improvements are helping responsiveness.
- LCP is the biggest differentiator-platforms that ship fast themes and tightly controlled app ecosystems tend to score better.
- WooCommerce has scale, but not automatic speed: its CWV pass rates lag behind SaaS-heavy ecosystems, which is consistent with its infinite customization nature.
Lighthouse
Lighthouse is the HTTP Archive’s lab-based audit. Unlike Core Web Vitals (field data), it runs in a controlled environment (simulated device, throttled network/CPU) and produces scores for Performance, Accessibility, SEO, and Best Practices:
- Performance: Lighthouse Performance is a lab score (0–100) summarizing load and responsiveness under a controlled test profile. It’s most useful for relative comparisons across platforms.
- Accessibility: Lighthouse Accessibility is based on automated checks (it cannot catch everything), but it’s a useful baseline signal for common issues like missing labels, low contrast, and incorrect semantics.
- SEO: The Lighthouse SEO score reflects technical SEO fundamentals (e.g., title/meta, basic crawlability signals). High medians are common because these checks are straightforward to pass.
- Best Practices: Best Practices is a grab bag of security and reliability checks (HTTPS, safe JS patterns, modern APIs). It often reflects platform defaults and theme quality.
Lighthouse is useful for comparisons across large sets of sites because it standardizes the test profile, but it won’t perfectly match what real users experience since field data reflects the real mix of devices, networks, geographies, and user behavior.
Median Lighthouse scores by platform
| Platform | % all sites | Performance (median) | Accessibility (median) | SEO (median) | Best Practices (median) |
|---|---|---|---|---|---|
| WooCommerce | 7.10% | 61 | 87 | 92 | 78 |
| Shopify | 4.32% | 71 | 90 | 92 | 74 |
| Squarespace Commerce | 1.84% | 65 | 94 | 92 | 96 |
| Wix eCommerce | 1.57% | 88 | 96 | 100 | 78 |
| PrestaShop | 0.64% | 59 | 78 | 92 | 81 |
| 1C-Bitrix | 0.47% | 58 | 75 | 92 | 59 |
| Magento | 0.41% | 60 | 78 | 92 | 74 |
| OpenCart | 0.23% | 63 | 79 | 91 | 78 |
| Cafe24 | 0.20% | 39 | 69 | 85 | 56 |
| BigCommerce | 0.15% | 72 | 81 | 92 | 74 |
| Platform | % all sites | Performance (median) | Accessibility (median) | SEO (median) | Best Practices (median) |
|---|---|---|---|---|---|
| WooCommerce | 7.03% | 38 | 87 | 92 | 79 |
| Shopify | 4.01% | 55 | 91 | 92 | 75 |
| Wix eCommerce | 1.75% | 64 | 95 | 100 | 79 |
| Squarespace Commerce | 1.56% | 30 | 94 | 92 | 96 |
| PrestaShop | 0.59% | 36 | 79 | 92 | 79 |
| 1C-Bitrix | 0.53% | 35 | 75 | 92 | 61 |
| Magento | 0.34% | 34 | 79 | 92 | 75 |
| OpenCart | 0.23% | 43 | 78 | 91 | 79 |
| Tiendanube | 0.15% | 50 | 92 | 92 | 75 |
| Square Online | 0.14% | 13 | 85 | 92 | 57 |
A few high-level patterns:
- SaaS storefronts tend to cluster higher on the Performance category (especially on desktop), consistent with tighter control over themes and defaults.
- Accessibility medians are generally strong across top platforms, but medians can hide long-tail variance.
- SEO and Best Practices scores are high for most platforms-where teams usually win or lose is performance and implementation discipline, not basic technical SEO.
Payment providers
Payments are where ecommerce becomes real. They also represent a major dependency surface area: third‑party scripts, redirects, fraud tooling, and compliance constraints.
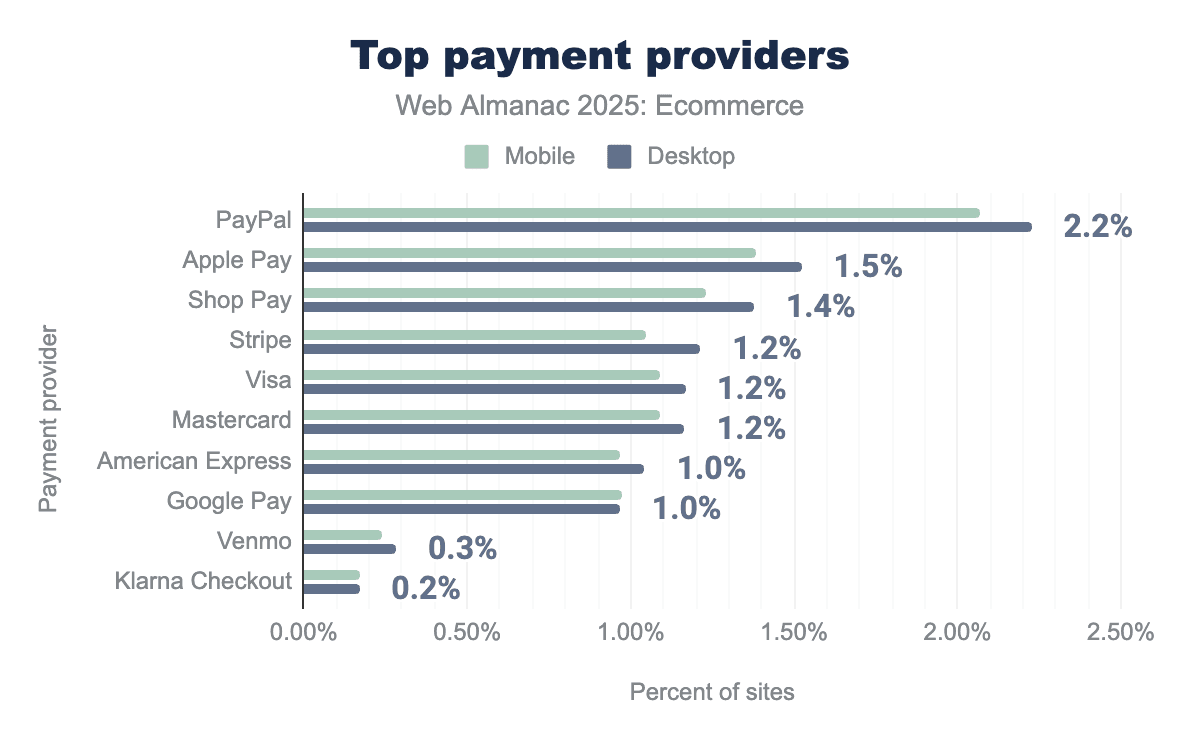
The top 10 payment technologies account for the bulk of payment detections on both devices-another reminder that payments consolidate quickly. However it’s worth noting that no single provider or two stands out as overall dominant.
What changed since 2022?
The most noticeable trend is that PayPal’s share of payment detections declines, while wallets and processor‑first ecosystems grow:
- PayPal falls from ~39% of payment detections in 2022 to ~30% in 2025 (desktop and mobile both show this pattern).
- Stripe and Google Pay gain share over the same period.
- Apple Pay and Shop Pay stay relatively stable at high levels.
This does not mean PayPal is dying. It means the payment layer is becoming more diversified-especially as native wallets, link-based checkout, and platform-native accelerators become standard.
Payment providers by geography
- On mobile, PayPal is the top payment provider in 70 of 83 geographies.
- On desktop, leadership is more split: Stripe leads in 31 geographies while PayPal leads in 22.
Notable examples:
- Apple Pay leads in New Zealand (both desktop and mobile).
- Braintree stands out in Taiwan.
- Several African and Middle Eastern markets show Stripe as the most common top provider in this dataset (e.g., Nigeria, Kenya, UAE).
Conclusion
Ecommerce in 2025 remains both concentrated and diverse. A handful of platforms account for most detected ecommerce sites-led by WooCommerce and Shopify-while a long tail of regional and niche systems continues to matter in specific markets. Website rank adds another layer: enterprise-oriented platforms show up disproportionately in higher-traffic tiers, while long-tail sites skew toward easier-to-adopt and lower-cost solutions.
Performance remains a differentiator, not a footnote. Field metrics (Core Web Vitals) and lab audits (Lighthouse) both show that tighter platform control can correlate with better median outcomes, but the gap is not destiny-self-hosted and heavily customized stacks can perform well when engineering discipline is strong. Payment technologies also consolidate quickly: a small set of providers dominates detections, while wallets and processor-first ecosystems keep gaining share.
The next chapter of ecommerce is not just which platform, but which channels: voice, live commerce, and agentic commerce are pushing stores to become faster, more accessible, and more machine-consumable. The winners will be the ones who treat catalog quality, performance, and trust as product features-because increasingly, the shopper may not be a human clicking around a page at all.
