Third Parties

Introduction
Ah third parties, the solution to so many problems on the web… and cause of so many others! Fundamentally, the web has always been about interconnectivity and sharing. Using third-party content on a website is a natural extension of that and was first set into motion with the introduction of the <img> element in HTML 2.0; we have been able to hyperlink external content straight into our documents ever since. This has only grown with the introduction of CSS, and JavaScript allowing part (or all!) of the page to be changed completely just by including a seemingly simple <link> or <script> element.
Third parties provide a never-ending collection of images, videos, fonts, tools, libraries, widgets, trackers, ads, and anything else you can imagine embedding into our web pages. This enables even the most non-technical to be able to create and publish content to the web. Without third parties, the web would likely be a very boring, text-based, academic medium instead of the rich, immersive, complex platform that is so integral to the lives of many of us today.
However, there is a dark side to using third-party content on the web. An innocuous inclusion of an image or a helpful library opens the floodgates to all sorts of performance, privacy, and security implications that many developers do not consider fully. Speak to any professionals in those industries and they will lament the use of third-party content making their lives more difficult. Scrutiny is surely only going to grow with performance getting extra attention through the Core Web Vitals initiative from Google, increased focus on privacy from governments and individuals, and the ever-increasing threat of exploitable vulnerabilities and malicious threats inherent to the web.
In this chapter we’re going to have a look at the state of third parties on the web: how much are we using them, what are we using them for, and has our usage changed over the last year, particularly given the three concerns listed above? These are questions I’m looking to answer here.
Definitions
We may have different ideas of what constitutes a “third party” or “using third-party content”, so we’ll start with a definition of what we consider a third party to be for this chapter:
“Third party”
We use the same definition of third party as we have in the 2019 and 2020 editions, though a slightly different interpretation of it will exclude one category this year, as we’ll discuss in the next section.
A third party is an entity outside the primary site-user relationship, i.e. the aspects of the site not directly within the control of the site owner but present with their approval. For example, the Google Analytics script is an example of a common third-party resource.
Third-party resources are:
- Hosted on a shared and public origin
- Widely used by a variety of sites
- Uninfluenced by an individual site owner
To match these goals as closely as possible, the formal definition used throughout this chapter of a third-party resource is one that originates from a domain whose resources can be found on at least 50 unique pages in the HTTP Archive dataset.
Note that using these definitions, third-party content served from a first-party domain is counted as first-party content. For example, self-hosting Google Fonts or bootstrap.css is counted as first-party content.
Similarly, first-party content served from a third-party domain is counted as third-party content—assuming it passes the “more than 50 pages criteria”, which it may well do based on domain, even if the resource itself is unique to that website. For example, first-party images served over a CDN on a third-party domain are considered third-party content.
Third-party categories
This year we will, again, be drawing heavily on the third-party-web repository from Patrick Hulce to help us identify and categorize third parties. This repository categorizes commonly used third-party URLs into the following categories:
- Ad - These scripts are part of advertising networks, either serving or measuring.
- Analytics - These scripts measure or track users and their actions. There’s a wide range in impact here depending on what’s being tracked.
- CDN - These are a mixture of publicly hosted open source libraries (e.g. jQuery) served over different public CDNs and private CDN usage.
- Content - These scripts are from content providers or publishing-specific affiliate tracking.
- Customer Success - These scripts are from customer support/marketing providers that offer chat and contact solutions. These scripts are generally heavier in weight.
- Hosting - These scripts are from web hosting platforms (WordPress, Wix, Squarespace, etc.).
- Marketing - These scripts are from marketing tools that add popups/newsletters/etc.
- Social - These scripts enable social features.
- Tag Manager - These scripts tend to load lots of other scripts and initiate many tasks.
- Utility - These scripts are developer utilities (API clients, site monitoring, fraud detection, etc.).
- Video - These scripts enable video player and streaming functionality.
- Other - These are miscellaneous scripts delivered via a shared origin with no precise category or attribution.
One change that we have made to our methodology this year is to remove the Hosting category from our analysis. If you happen to use WordPress.com for your blog, or Shopify for your ecommerce platform, then we’re going to ignore other requests for those domains by that site as not truly “third-party”, as they are in many ways part of hosting on those platforms. Similar to the note above, we do not consider CDNs in front of a page to be “third party”. In reality this made very little difference to the numbers, but we feel it’s a more accurate reflection of what we should consider “third party” by the above definition, and also aligns more closely with how the other chapters use this term.
Caveats
- All data presented here is based on a non-interactive, cold load. These values could start to look quite different after user interaction.
- The pages are tested from servers in the US with no cookies set, so third parties requested after opt-in are not included. This will especially affect pages hosted and predominantly served to countries in scope for the General Data Protection Regulation, or other similar legislation.
- Only the home pages are tested. Other pages may have different third-party requirements.
- Some of the lesser-used third-party domains are grouped into the unknown category. As part of this analysis, we submitted more categories for the top-used domains to improve the third-party-web dataset.
Learn more about our methodology.
Prevalence
So how much are third parties used? Well, the answer is a lot!
A staggering 94.4% of mobile sites and 94.1% of desktop sites use at least one third-party resource. Even with our newer restrictive definition of third parties, this represents a continued growth from when the Web Almanac started in 2019.
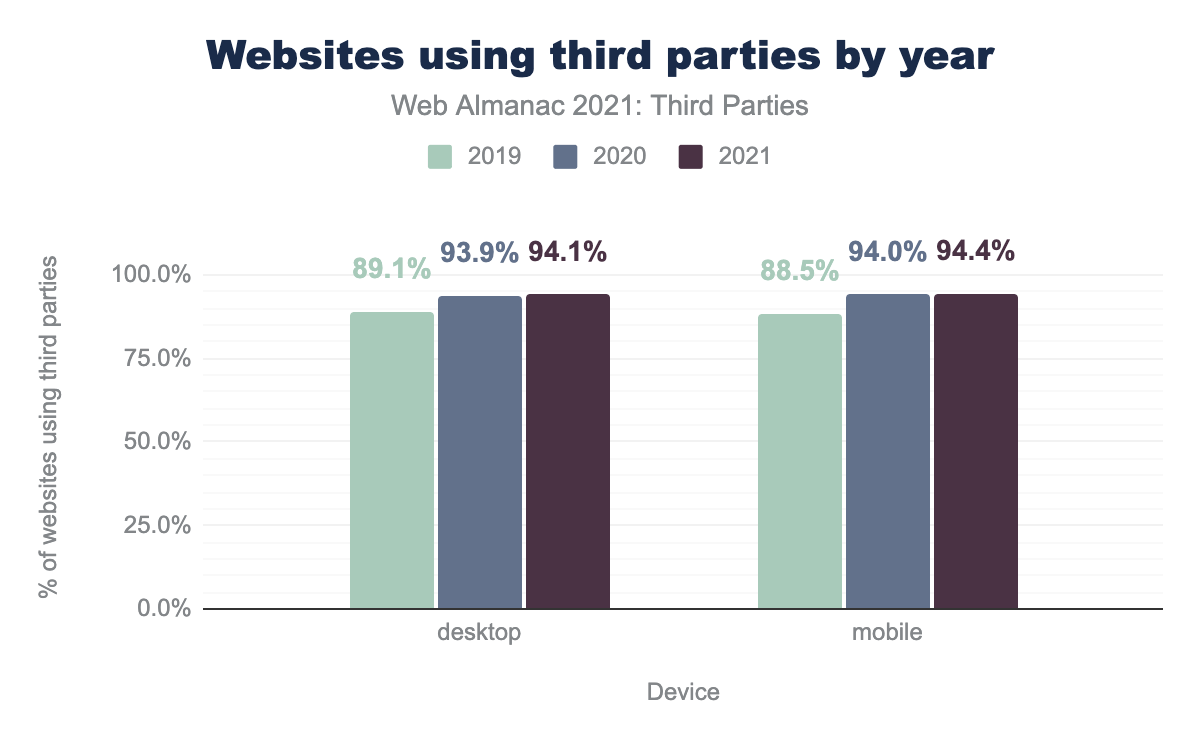
Rerunning the last three annual Web Almanac datasets with the new, stricter definition, we see in the chart above that our usage of third parties on our website has grown slightly on last year by 0.2% on desktop and 0.4% on mobile.
45.9% of requests on mobile and 45.1% of requests on desktop are third-party requests, which is similar to last year’s results.
It would appear that privacy-preserving regulations like GDPR and CCPA are not dampening our appetite for third-party usage. Though it should be remembered that our methodology is to test websites from US data centers and so may be served different content because of that.
So, we know nearly all sites use third parties, but how many do they use?
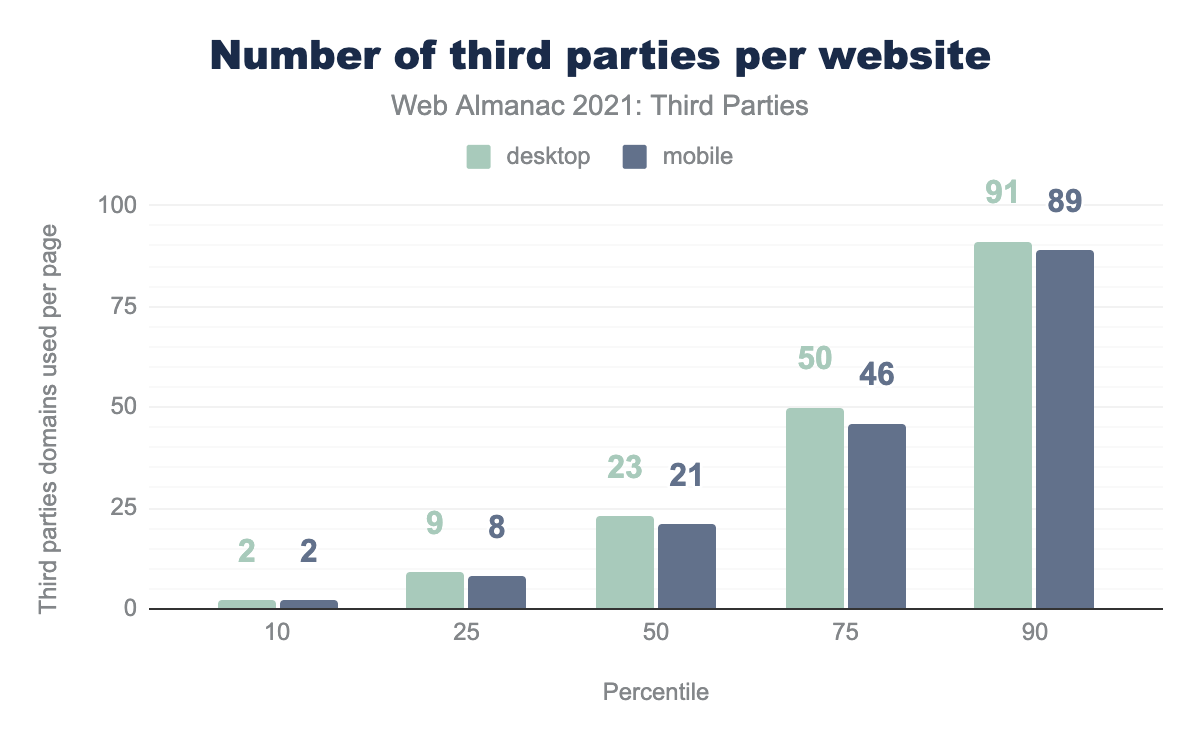
Looking at the spread, we see there is a large variance with websites only using two third parties–measured as the number of distinct third-party hostnames–at the 10th percentile, up to 89 or 91 at the 90th percentile.
Note that the 90th percentile is down a bit from last year’s analysis, where we had 104 and 106 third parties for desktop and mobile respectively, but this looks to be due to restricting our domains to assets used by 50 websites or more this year, which was not done for this statistic last year.
The median website uses 21 third parties on mobile and 23 on desktop, which still seems like quite a lot!
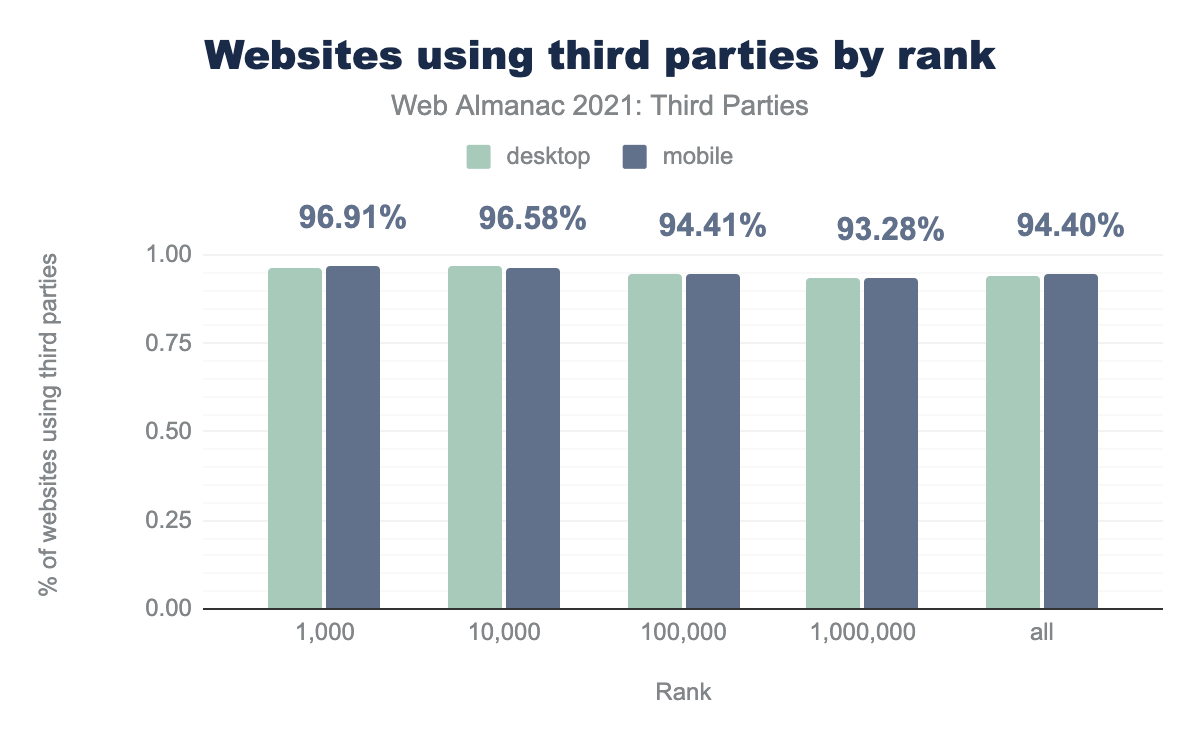
Third party prevalence by rank
This year we have access to the Chrome UX Report (CrUX) “rank” for each website. This is a popularity assignment for each site, which allows us to group our data into the top 1,000 most-used sites (based on page views), top 10,000 most-used sites, etc. Slicing the data by this popularity rank shows that there is a slight decrease in third-party usage for the less popular websites, but it never dips below 93.3%, again reiterating that pretty much all websites love to include at least one third party.
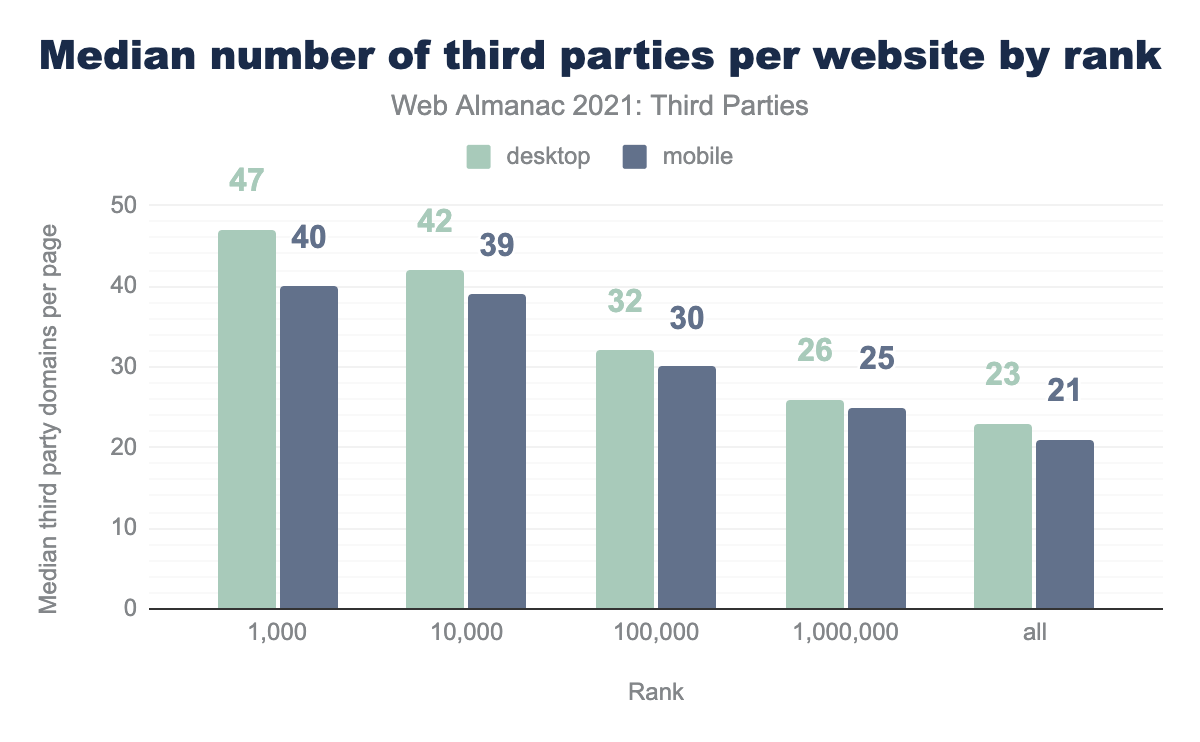
However, what does change is the number of third parties used by website:
Looking at the median (50th percentile) statistics, we see a marked decline as we go up the rankings, with the most popular websites using twice as many third parties as the whole dataset. We’ll see in a moment that that is driven almost entirely by ads. It is perhaps unsurprising that these are much more prevalent on more popular websites, with more eyeballs to monetize.
Third-party type
Our analysis shows we’re using third parties a lot, but what are we using them for? Looking at the categories of each third-party request, we see the following:
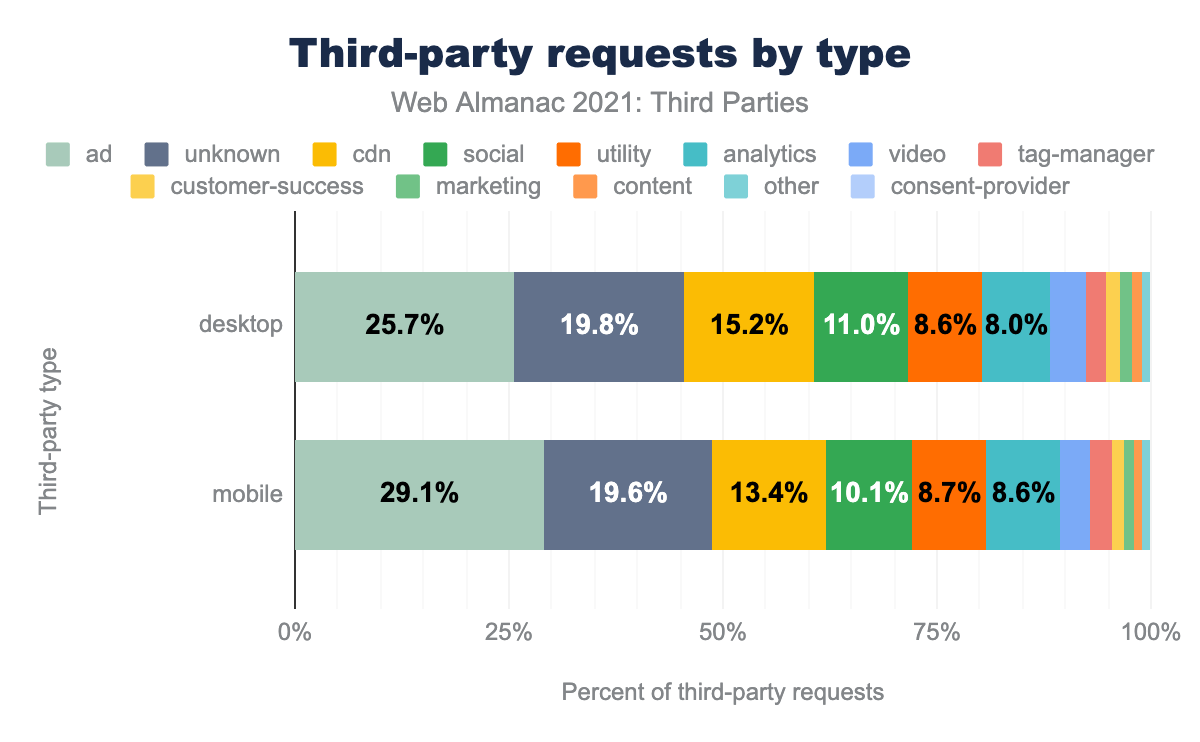
ad third-parties are 25.7% desktop third parties and 29.1% of mobile, unknown are 19.8% and 19.6% respectively, cdn 15.2% and 13.4%, social 11.0% and 10.1%, utility 8.6% and 8.7%, analytics 8.0% and 8.6%, video 4.0% and 3.5%, tag-manager 2.5% and 2.4%, customer-success 1.6% and 1.5%, marketing 1.4% and 1.2%, content 1.1% and 0.9%, other 0.9% and 0.8%, and finally consent-provider 0.2% and 0.2%.Ads are the most common third-party requests, followed by “unknown”—a collection of various uncategorized or lesser-used sites—then CDN, social, utility, and analytics. So, while some categories are more popular than others, what’s perhaps the bigger takeaway here is how varied third-party usage is. They really are used for all sorts of reasons, rather than one or two use cases dominating all the others.
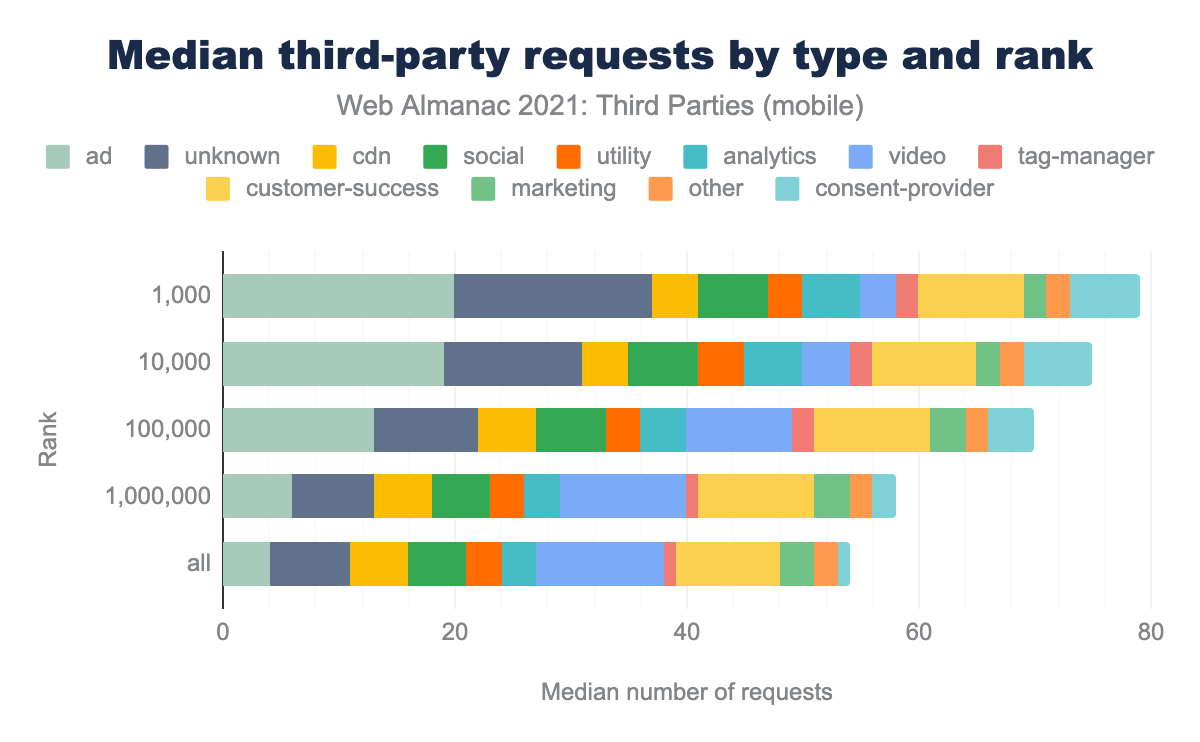
Third-party requests by type and rank
ad third parties, 17 unknown, 4 cdn, 6 social, 3 utility, 5 analytics, 3 video, 2 tag-manager, 9 customer-success, 2 marketing, 5 content, 2 other, and 6 consent-provider. For the top 10,000 websites the median values are 19, 12, 4, 6, 4, 5, 4, 2, 9, 2, 5, 2, and 6. For the top 100,000 it’s 13, 9, 5, 6, 3, 4, 9, 2, 10, 3, 5, 2, and 4. For the top million it’s 6, 7, 5, 5, 3, 3, 11, 1, 10, 3, 5, 2, and 2. For all sites it’s 4, 7, 5, 5, 3, 3, 11, 1, 9, 3, 5, 2, and 1.Splitting the requests by rank and category, we see the reason for the larger number of requests discussed previously: ads are much more heavily used on the more popular sites.
Note this chart shows the median number of requests for each category, by rank, but not every category is used on every page, explaining why the totals per rank are much higher than the median number of requests per rank from the previous chart.
Content types
Taking an alternative view on the data, let’s see what type of content we’re getting back from all those third-party requests.
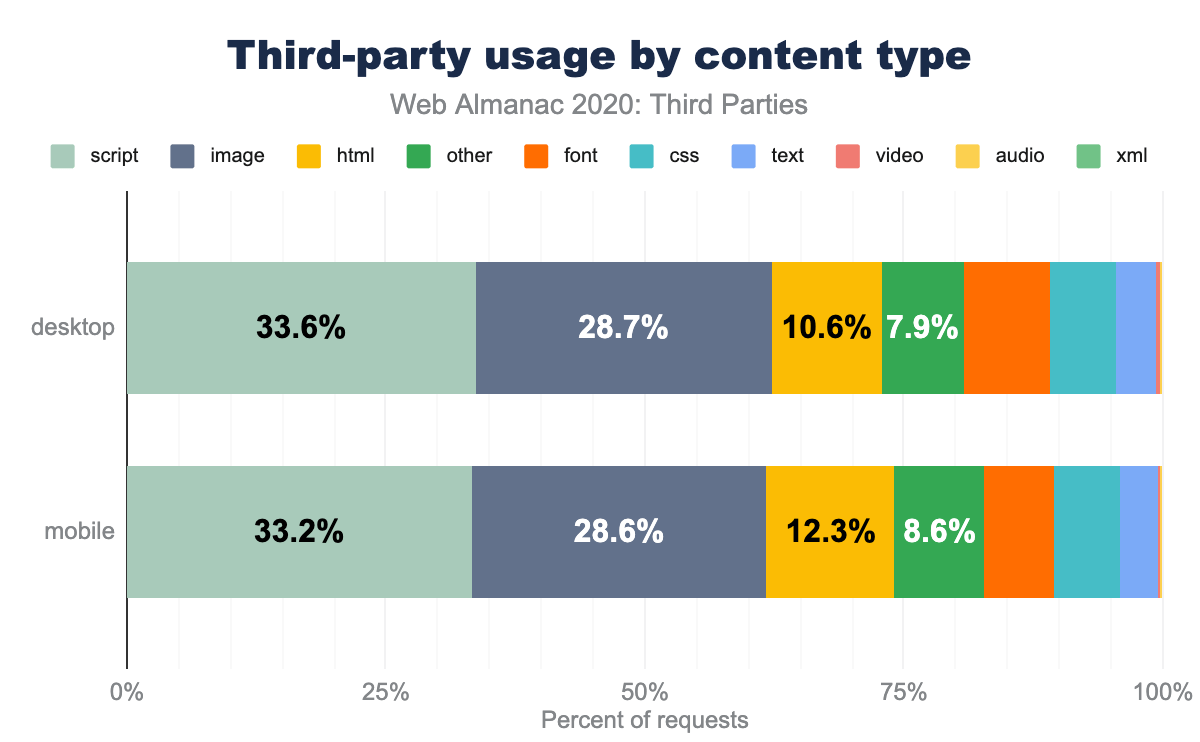
script resources make up 33.6% of third-party requests on desktop, image 28.7%, html 10.6%, other 7.9%, font 8.4%, css 6.4%, text 3.8%, video 0.3%, audio 0.2%, and finally xml 0.1%. On mobile script resources are 33.2% of third-party resources, image 28.6%, html 12.3%, other 8.6%, font 6.7%, css 6.3%, text 3.7%, video 0.2%, audio 0.2%, and finally xml 0.1%.Unsurprisingly, JavaScript, images, and HTML comprise the majority of third-party requests. JavaScript is used by most third parties to add functionality, whether that be in ads, trackers, or libraries. Similarly, the high usage of images is to be expected, as they will include the 1-pixel blank images so beloved of tracking solutions.
The high usage of HTML may seem surprising initially (surely documents would be the prevalent form of HTML and they would be first-party requests?), but our investigation showed them mostly to be iframes, which makes much more sense as they are often used to house ads, or other widgets (e.g. YouTube serves an HTML document in an iframe including the player, rather than just the video itself).
So based purely on the number of requests, third parties seem to be adding functionality more so than content—though that’s a little misleading since, as per the YouTube example, some third parties add functionality in order to enable the content.
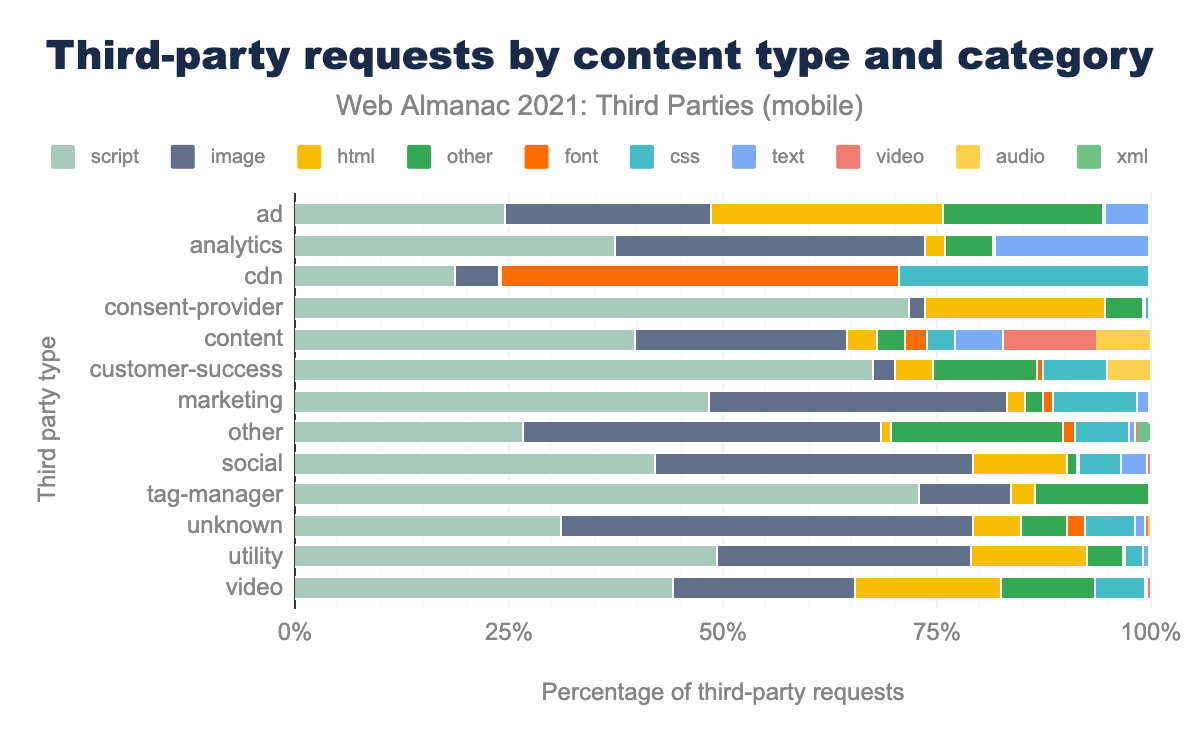
ad it’s mostly script bytes, with a small amount of image and html and little of anything else. For analytics it’s 98% scripts, for cdn it’s nearly all script or font, for consent-provider again it’s nearly all script. content type is a little script, some image, but mostly video and a little audio. customer-success is nearly all script, marketing is mostly script and image, other is mostly image with a bit of script, social is mostly script or image, tag-manager is 99.8% script, unknown is a little script and a lot of images, utility is mostly script with some image, and video is similar with only a small amount of actual video.Splitting the requested content types by the type of third party, we see the prevalence of those three main types (scripts, images, and HTML) across most types, though the worrying amount of JavaScript (even for video type!) is already apparent. The above chart is for mobile, but the desktop picture is very similar.
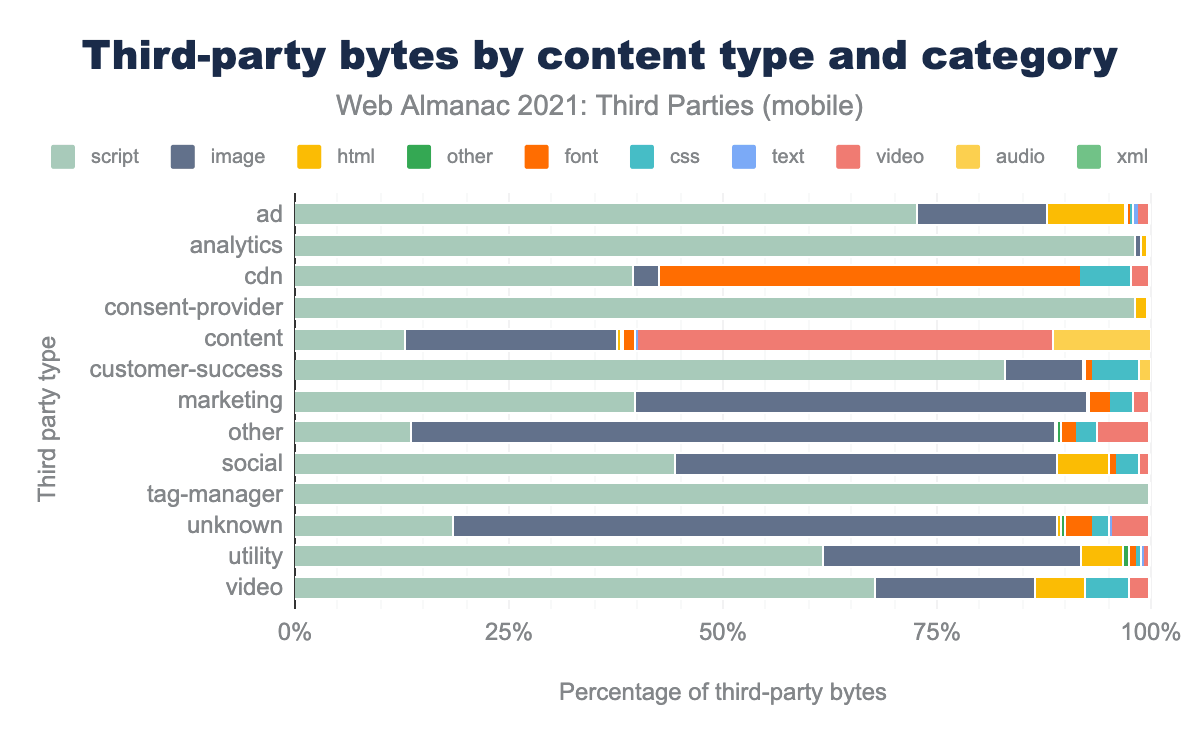
ad third-party requests are fairly evenly divided by script, image, html and other with a small amount of text. analytics are mostly script and images, with a small amount of html, other and text. For cdn requests it is a mixture of script, image, css but mostly fonts. For the next set (consent-providers, content, customer-success, marketing, other, social, tag-manager, unknown and utility) are nearly all scripts or images. video is similar with the amount of video content not even noticeable on the graph.When looking by bytes, rather than by requests, the amount of JavaScript is even more worrying. Again, we’ve shown mobile here, but there are no major differences for desktop.
To quote Addy Osmani (twice in the same sentence!) from his “Cost of JavaScript” post, “byte-for-byte, JavaScript is still the most expensive resource we send”, and “a 200 KB script and a 200 KB image have very different costs”. Some categories like Analytics, Consent Provider, and Tag Manager are pretty much all JavaScript, while others like Ad and Customer Success are not far behind. We’ll return to the performance impact of using third-party resources, which is often caused by costly use of JavaScript.
Third-party domains
Who are we loading all these third-party requests from? Most of these names won’t be surprising, but the prevalence of one name just reiterates the dominance that company has across a number of different categories:
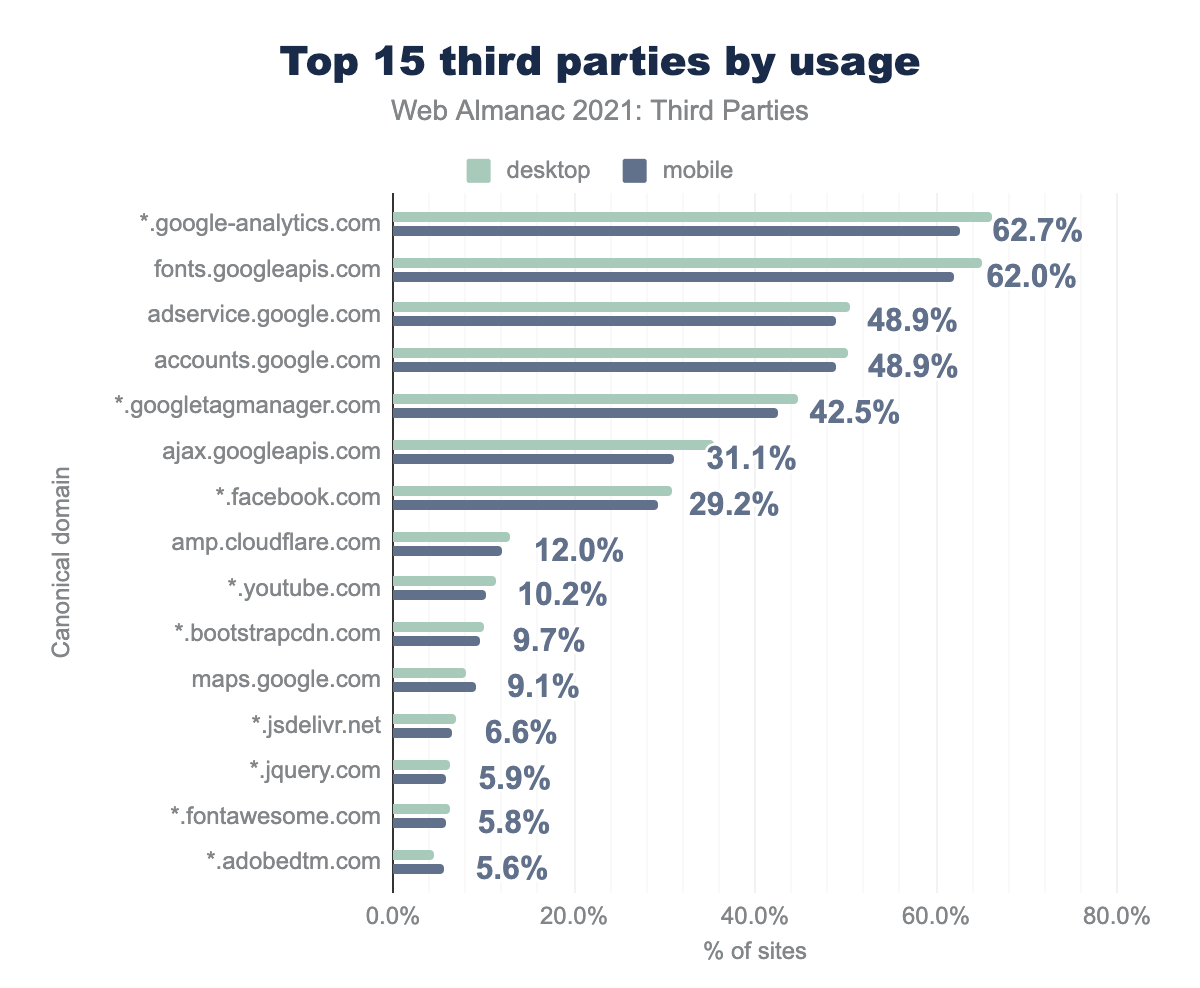
*.google-analytics.com is used on 66.2% of desktop pages and 62.7% of mobile, fonts.googleapis.com is 65.1% and 62.0% respectively, adservice.google.com is 50.5% and 48.9%, accounts.google.com is 50.3% and 48.9%, *.googletagmanager.com is 44.8% and 42.5%, ajax.googleapis.com is 35.5% and 31.1%, *.facebook.com is 30.8% and 29.2%, amp.cloudflare.com is 12.8% and 12.0%, *.youtube.com is 11.3% and 10.2%, *.bootstrapcdn.com is 10.1% and 9.7%, maps.google.com is 8.0% and 9.1%, *.jsdelivr.net is 7.1% and 6.6%, *.jquery.com is 6.3% and 5.9%, *.fontawesome.com is 6.3% and 5.8%, and finally *.adobedtm.com is 4.5% and 5.6%.Google takes 8 of the top 15 most-used third parties—including the top 6 spots!—and no else comes close. Google is a market leader in Analytics, Fonts, Ads, Accounts, Tag Managers, and Video to name but a few. A staggering 62.7% of mobile websites use Google Analytics, and almost as many use Google Fonts, with Ads, Accounts and Tag Manager usage not far behind in the 42%-49% range.
The first non-Google entity is Facebook, with comparatively low usage of 29.2%. This is followed by Cloudflare’s CDN fronting popular libraries and other resources. Despite being listed as amp.cloudflare.com, it also includes the much larger cdnjs.cloudflare.com–this has been updated to show the more commonly used domain for next year.
After this we’re back to Google with YouTube, and Maps two spots later. The remaining spots are filled with CDNs for other popular libraries and tools.
Performance impact of third parties
Using third parties can have a noticeable impact on performance. That’s not necessarily a consequence of them being a third party per se. The same functionality implemented by a site owner as a first-party resource can often be less performant, given the expertise the third party should have on the particular field.
So, performance isn’t necessarily impacted by the fact that the resources are third-party, it’s more of a matter of what those resources are doing. And most third-party usage depends on the third-party service, rather than just as a place to serve it from.
However, a third party’s business is in allowing their content or service to be hosted on many websites. Third parties have a duty to ensure that they minimize the negative impact of that dependency. This is an especially important duty given that site owners often have limited control over and influence on the performance impact of third parties other than to use them or not.
Using third-party domains versus self-hosting
There is a definite cost to connecting to another domain, even though most third parties will be using globally distributed, high-performance CDNs, and many web performance advocates (including this author!) recommend self-hosting where possible to avoid this penalty. This is particularly relevant now that all the major browsers have moved away from sharing caches between origins, so the claim that once one site has downloaded that resource, other sites visited can also benefit from it is no longer true. Though this was a questionable claim even in the past, given the number of versions of libraries, and limitations of the HTTP cache.
Saying that, rarely is life as definitive as we would like and, in some cases self-hosting may actually cost performance. This author has written before how the question on whether to self-host Google Fonts is not as clear cut as it might seem and requires a degree of expertise to ensure you are replicating all that Google Fonts does for you in the performance front. To avoid that hassle you can just use the hosted version, and ensure you’re reducing the performance impact as much as possible, as discussed by Harry Roberts in his The Fastest Google Fonts post.
Similarly, image CDNs can optimize media better than most first-parties and, more importantly, can do this automatically without the need for manual steps that will inevitably be skipped or done incorrectly on occasion.
Popular third parties embeds and their performance impact
To try to understand the performance impact of third parties, we will look at some of the most popular third-party embeds. Some of these have gotten a bad name in web performance circles, so let’s see if the bad reputation is really deserved. To do that, we’ll be making use of two Lighthouse audits: Eliminate render blocking resources and Reduce the impact of third-party code, based on some similar research by Houssein Djirdeh.
Popular third parties and their impact on render
To understand third parties’ impact on rendering, we’ve analyzed how sites resources perform on Lighthouse’s render-blocking resources audit, and identified which are third-parties by cross-referencing them with the third-party-web dataset.
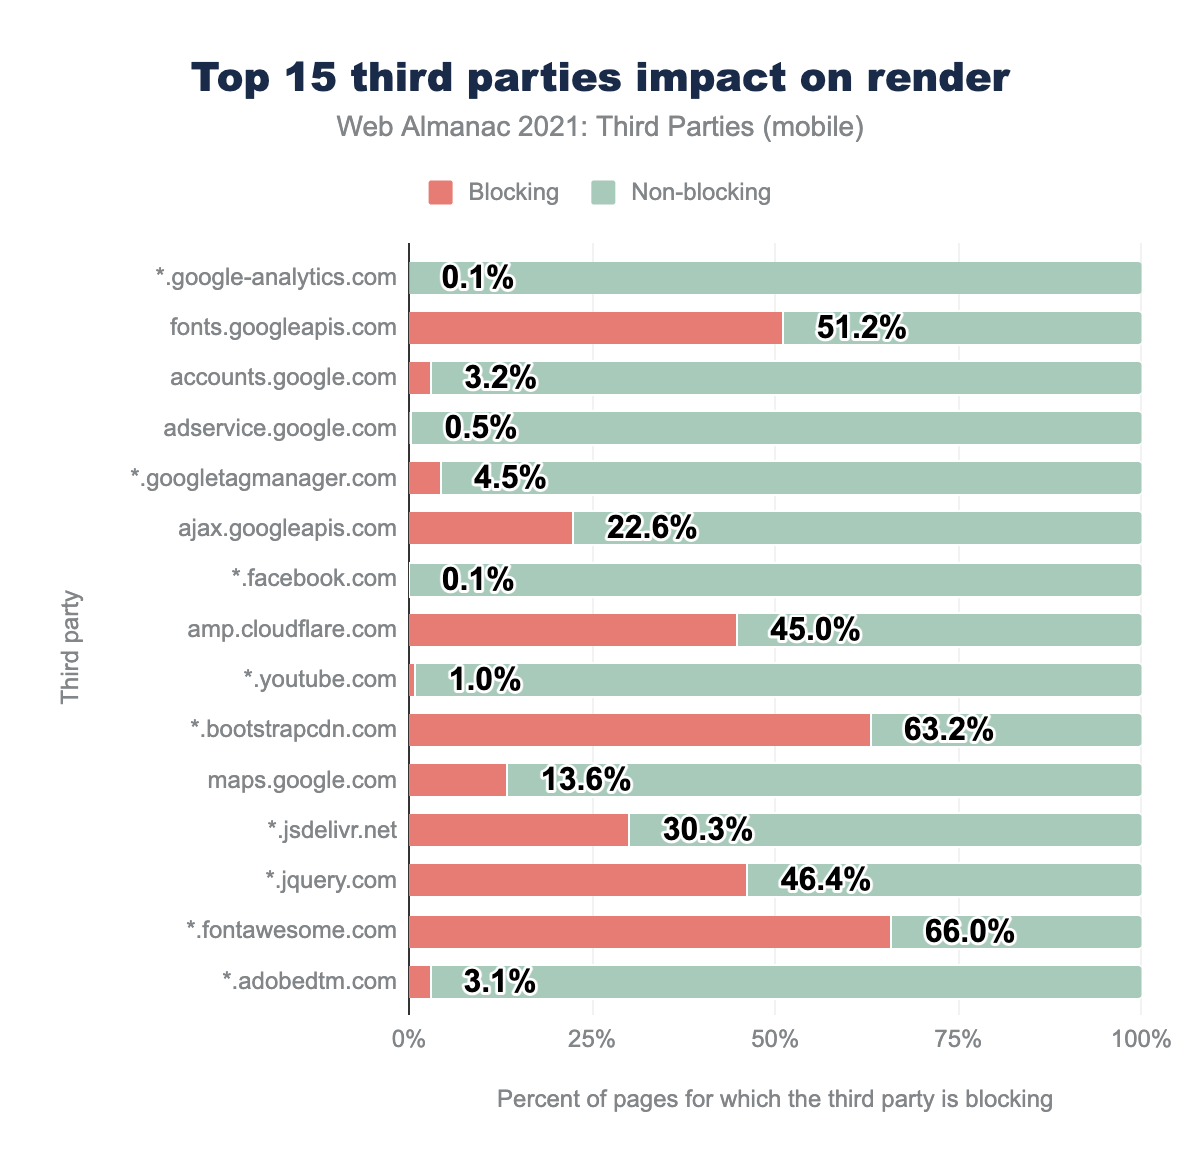
*.google-analytics.com is blocking render 0.1% of the time, fonts.googleapis.com is 51.3% accounts.google.com is 3.2% adservice.google.com is 0.5% *.googletagmanager.com is 4.5% ajax.googleapis.com is 22.7% *.facebook.com is 0.1% amp.cloudflare.com is 45.0% *.youtube.com is 1.0% *.bootstrapcdn.com is 63.1% maps.google.com is 13.6% *.jsdelivr.net is 30.3% *.jquery.com is 46.4% *.fontawesome.com is 66.0% *.adobedtm.com is 3.1%.The top 15 most popular third parties are shown above along with the percentage of resources they block on the initial render of the page.
On the whole this is a positive story; most do not block rendering, and those that do are for common libraries associated with layout (e.g. bootstrap) or fonts that perhaps should block initial render (this author doesn’t agree that using font-display: swap or optional is a good thing).
Often third-party embeds advise using async or defer to avoid blocking rendering, and it looks like this might be the case for many of them.
Popular third parties and their impact on main thread
Lighthouse has a Reduce the impact of third-party code audit that lists the main-thread times of all third-party resources. So how long do the most popular ones block the main thread for?
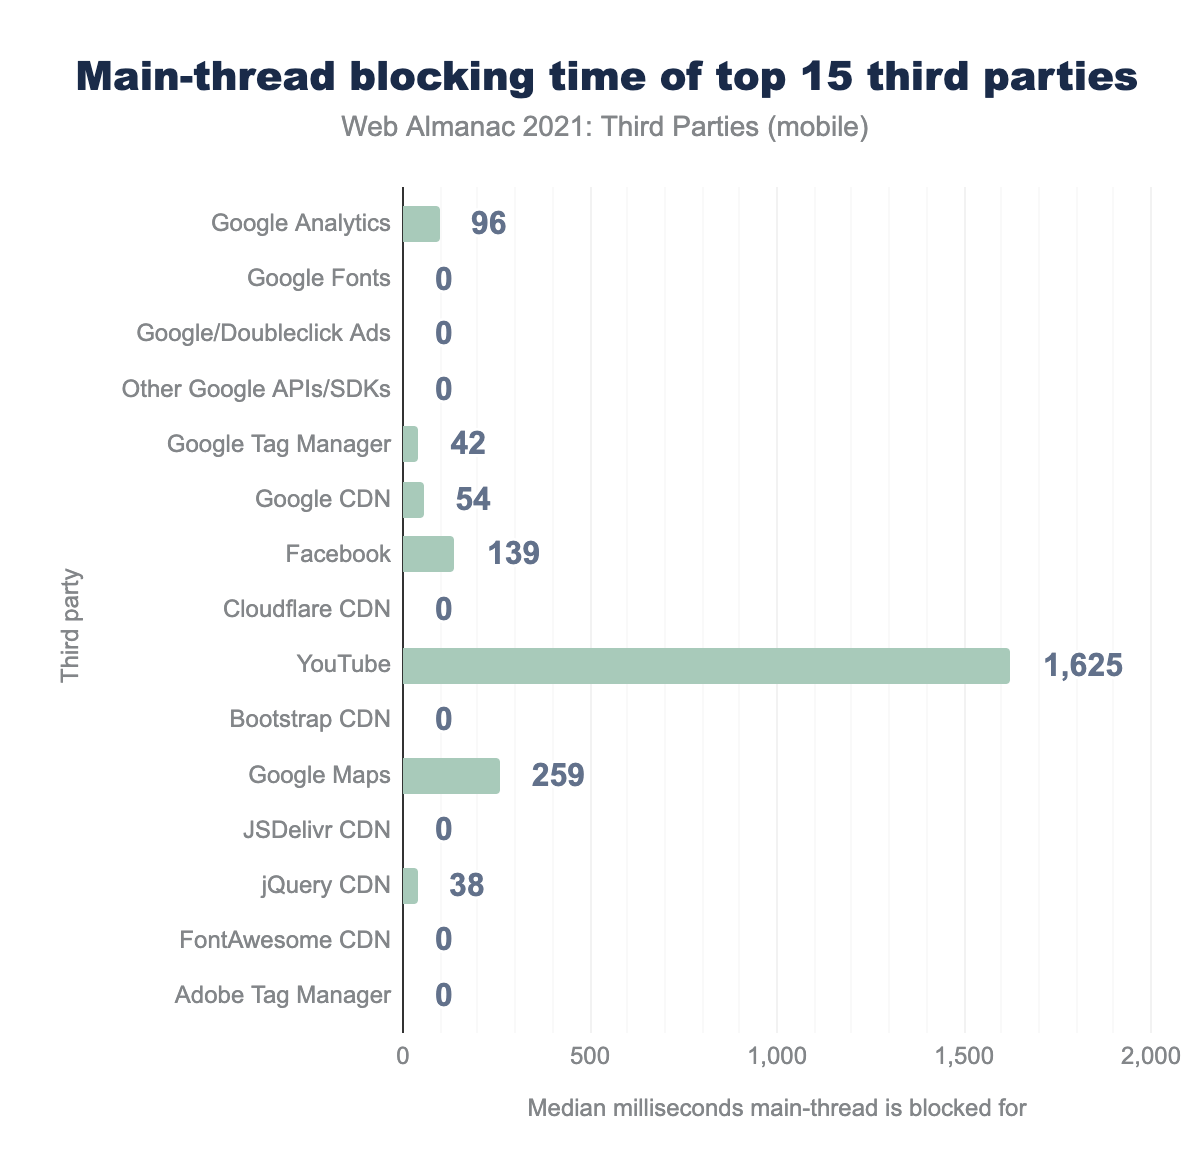
Here we see YouTube sticking out like a sore thumb so let’s delve into that a little more:
YouTube
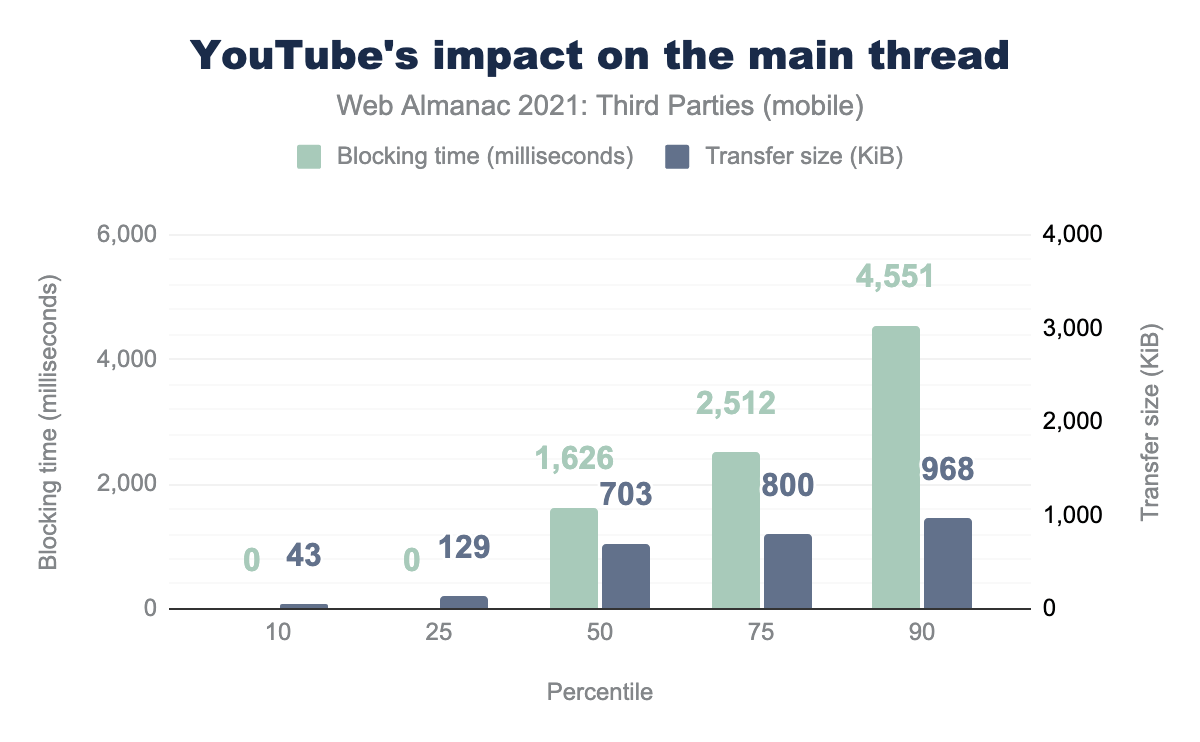
We can see a huge impact of 1.6 seconds of main-thread activity at the median (50th percentile), rising to a shocking 4.6 seconds of main-thread blocking at the 90th percentile (still meaning 10% of websites have a worse impact than even that!). It should be remembered however that these are throttled, lab-simulated timings, so many real users may not be experiencing this level of impact, but it is still a lot.
It’s also apparent that the impact increases with transfer size–perhaps not surprising as there is more to process. And remember that our crawl does not interact with these videos, so these are either auto-playing videos, or the YouTube player itself causing all this use.
Let’s dig a little deeper into some of the other third party embeds on our list.
Google Analytics
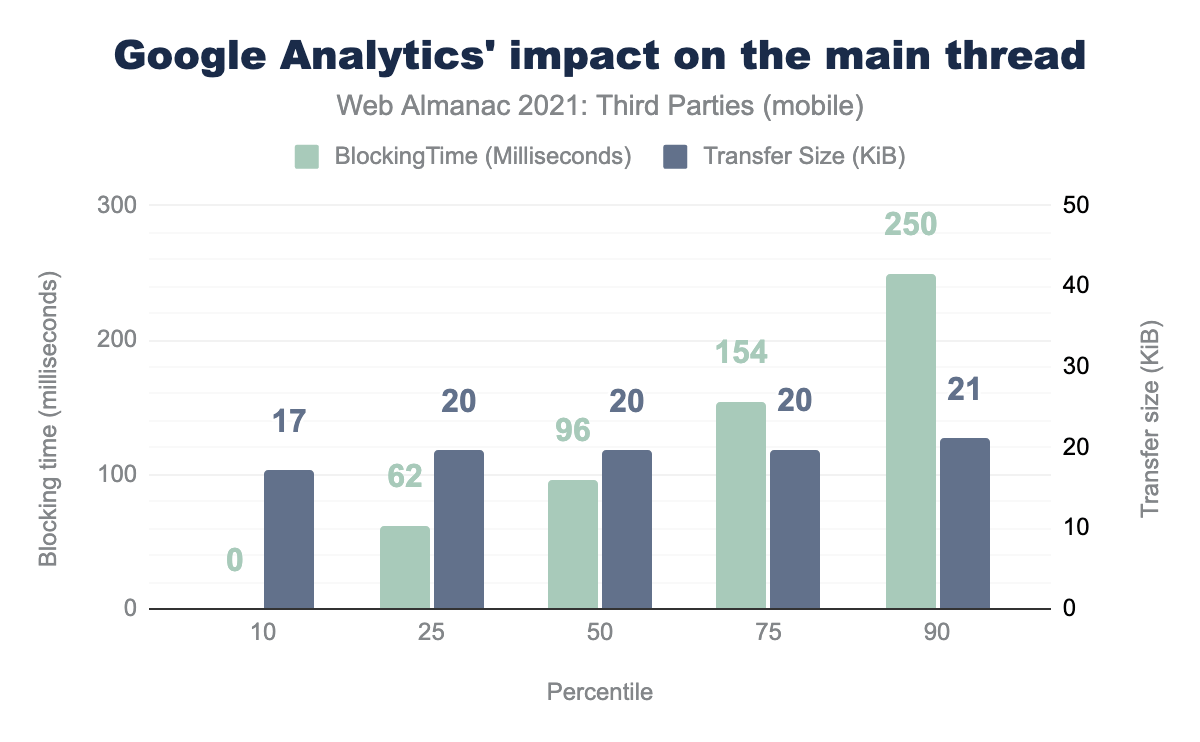
Google Analytics is pretty good, so obviously a lot of work has gone into optimizing this, given all that it tracks.
Google/Doubleclick Ads
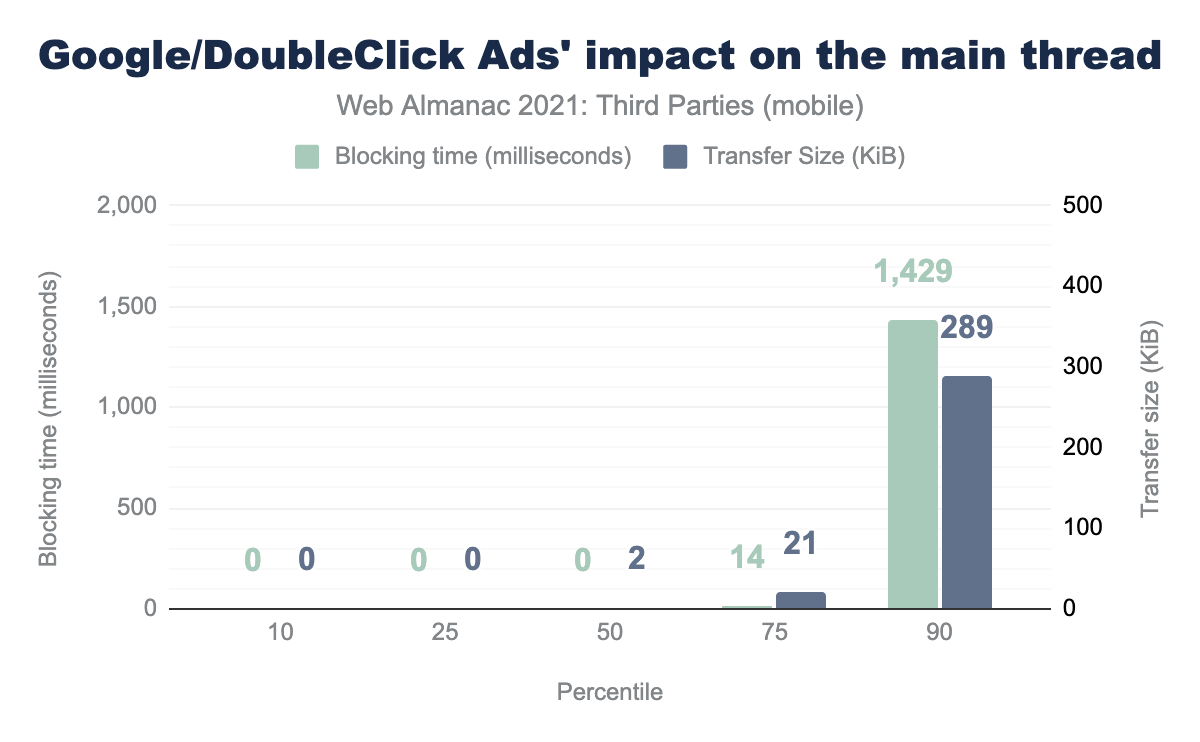
Google Ads was doing so well, until we hit the 90th percentile, when it got blown off the chart. Again, a reminder that this means 10% of websites have worse numbers than these.
Google Tag Manager
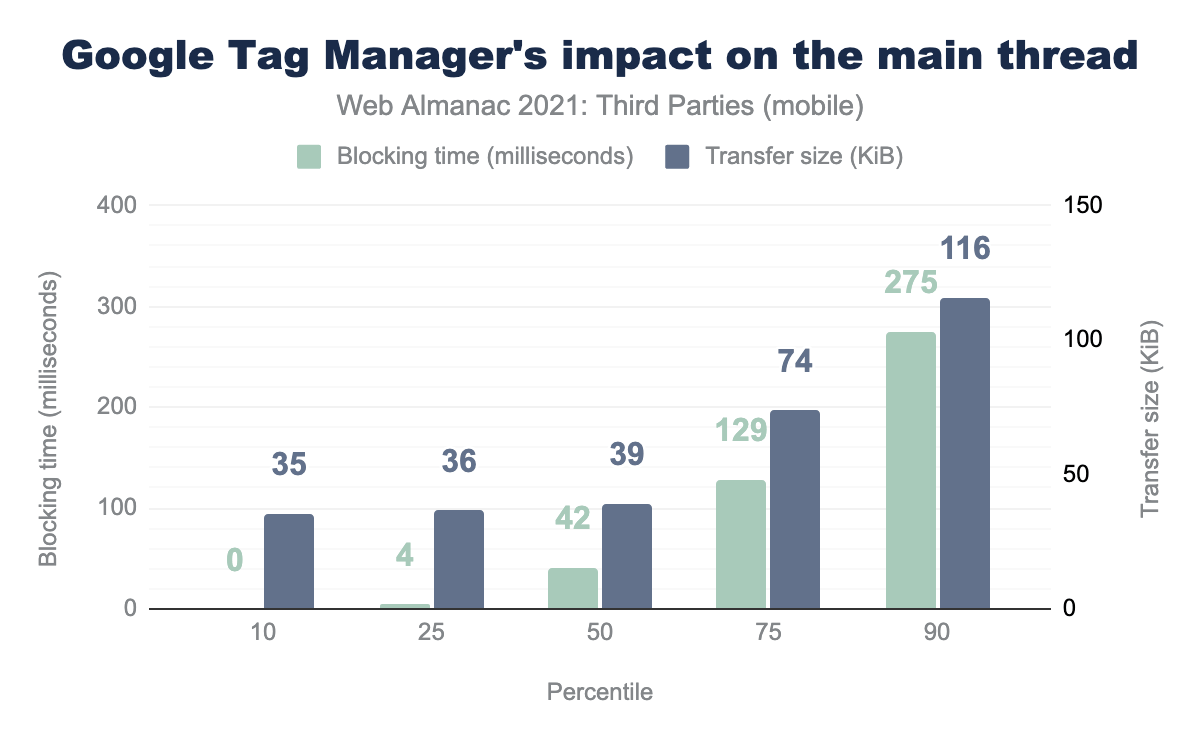
Google Tag Manager fares much better than expected to be honest. This author has seen some horrific GTM implementations, overloaded with old tags and triggers that are no longer used. But GTM seems to do well at not blocking the main thread for too long in our test page loads.
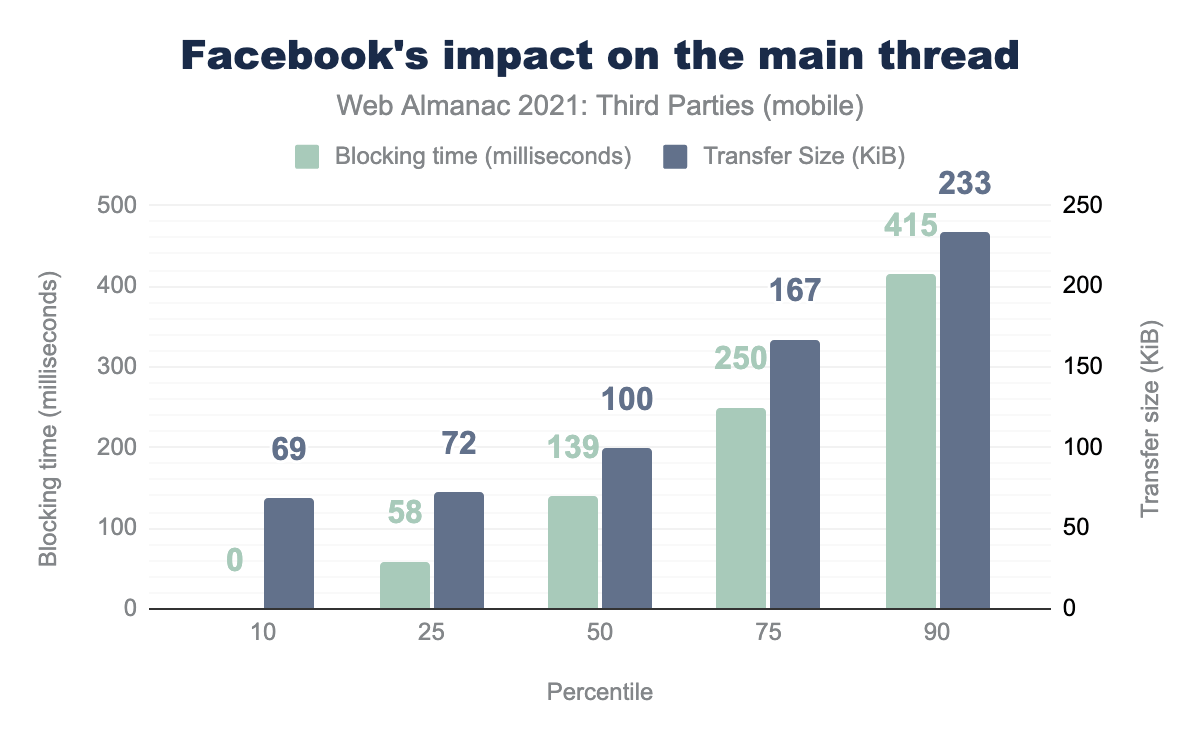
Facebook also isn’t as resource intensive as I thought it would be. Facebook embeds of posts seem to be less popular than Twitter embeds, so these will likely be Facebook retargeting trackers. These trackers should be working silently in the background and not impacting the main thread at all, so it’s apparent there is still more work for Facebook to do here. I’ve even had good success in not using the Facebook JavaScript API and using pixel tracking through Google Tag Manager without losing any functionality, and would encourage others to consider this option.
Google Maps
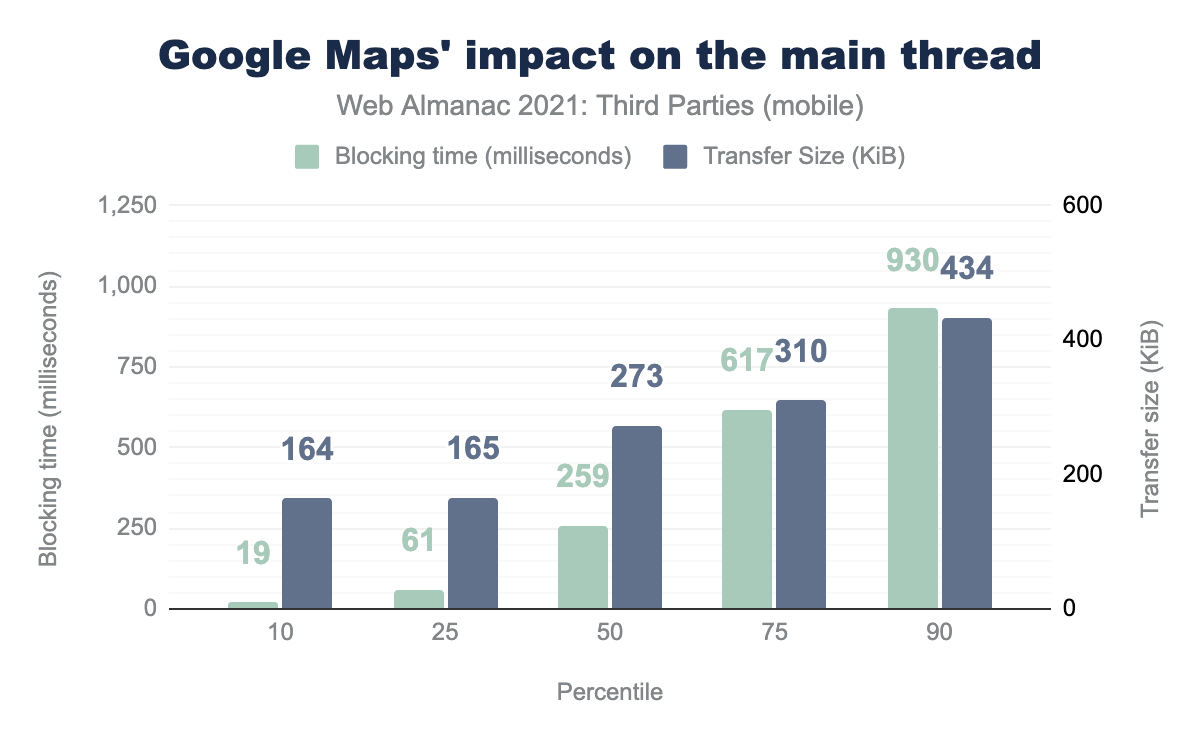
Google Maps definitely needs some improvement. Especially as it’s often present as a small extra piece on a page, rather than the main content. As a website owner, this highlights the importance of only including the Google Maps code on pages that require it.
And finally, let’s look at one further down the list: Twitter.
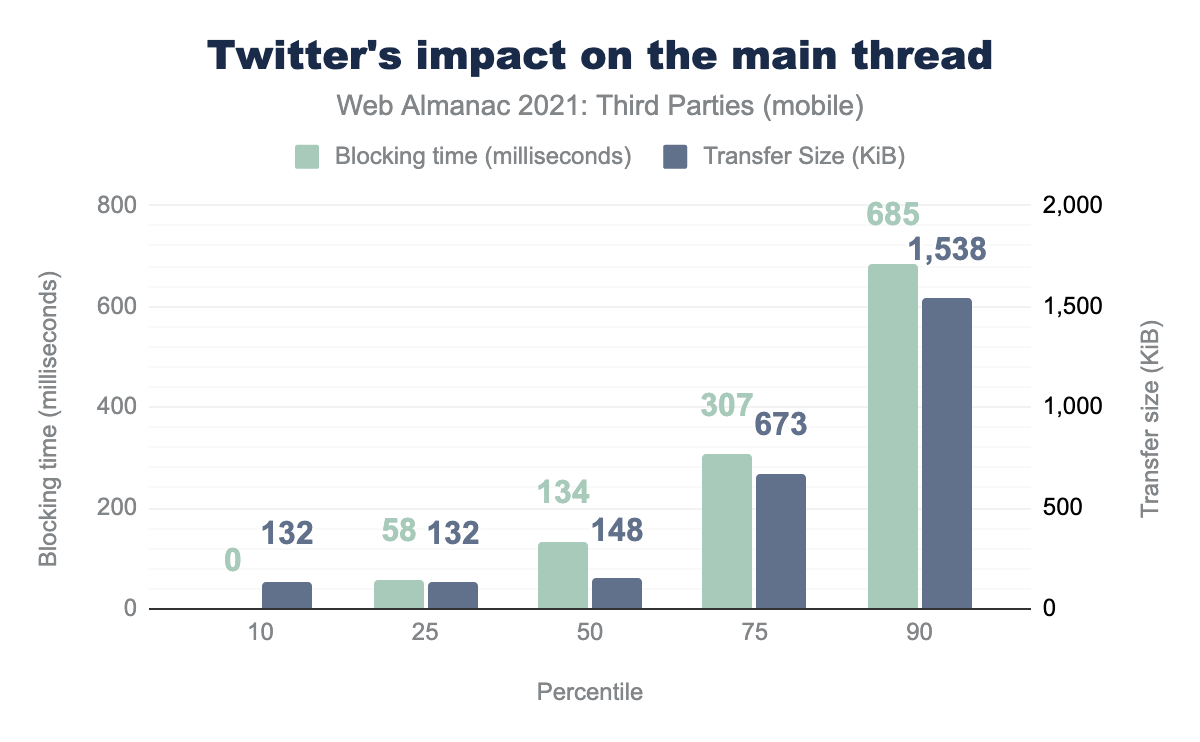
Twitter as a third-party can be used in one of two ways: as a retargeting advertising tracker, and as a way of embedding tweets. Embedding tweets in pages is more popular than other social networks. However it has been called out as having an undue impact on the page by many in the web performance community, including Matt Hobbs in his Using Puppeteer and Squoosh to fix the web performance of embedded tweets post. Our analysis backs that up—especially as those use cases will be diluted with the (presumably lighter) tracking use case in the above graph.
While some of the above examples fare better or worse, it must be remembered that it’s the cumulative effect of these that really impacts the performance of a website. It’s rare for websites to only use one of these, so add together Google Analytics, GTM loading Facebook and Twitter Tracking, on a page with a Map and an embedded Tweet, and it really starts to add up. Sometimes it’s unsurprising why your phone sometimes feels too hot to handle, or your PC fan starts going into overdrive just from surfing the web!
All this shows why Google recommends reducing the impact of embeds (mostly their own ironically!), through the use of document ordering, lazy-loading, facades, and other techniques. However, it’s really quite infuriating that some of these are not the default and that advanced techniques like these must fall on the responsibility of the website owner. The third parties highlighted here really do have the resources, and technical know-how to reduce the impact of using their products for everyone by default, but often choose not to. This performance section started by saying that using third parties wasn’t necessarily bad for performance, but these examples show there is certainly more that some of them can do in this area!
Hopefully highlighting some of these well-known examples will cause readers to investigate the impact of third-party embeds on their own sites and ask themselves if they really are all worth it. Perhaps if we make this subject more important to the third parties, they will prioritize performance.
Timing-Allow-Origin header prevalence
Last year we looked at the prevalence of the timing-allow-origin header, which allows the Resource Timing API to be used on third-party requests. Without this HTTP header, the information available to on-page performance monitoring tools for third-party requests is restricted for security and privacy reasons. However, for static requests, third parties that allow this header enable greater transparency into the loading performance of their resources.
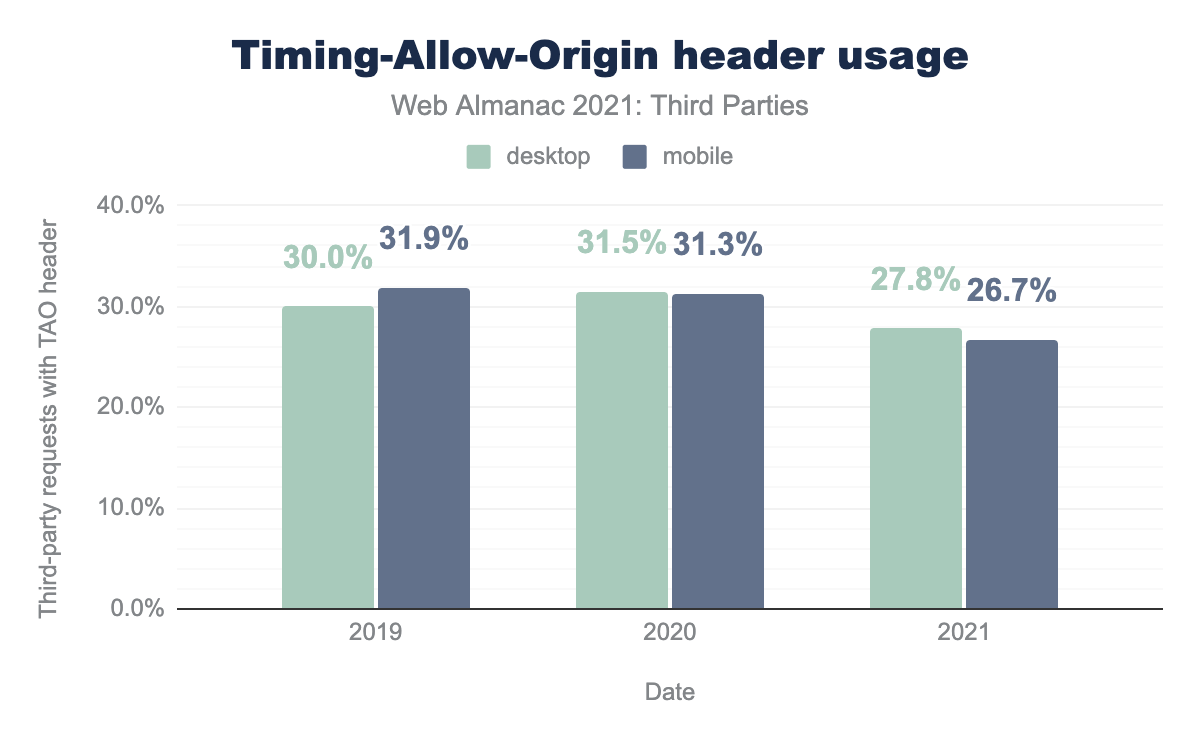
timing-allow-origin HTTP header on third-party requests over the last three years for desktop and mobile. In July 2019 this header was on 30.0% of desktop requests, and 31.9% of mobile requests. In August 2020 this increased to 31.5% and 31.3% respectively, but in July 2021 this decreased to 27.8% of desktop third-party requests and 26.7% of mobile third-party requests.Looking at the usage over the last three Web Almanac years, usage has dropped considerably this year. Digging deeper into the data showed a 33% drop in Facebook requests. Given that they supported this header and are widely used, this explains most of this drop. Interestingly, the number of pages with Facebook usage actually increased, but it looks like Facebook have changed their embed to make fewer requests in the last year and, given their prevalence, that’s made quite a dent on the usage of the timing-allow-origin header. Ignoring that, usage of this header has basically stayed stable, which is a bit disappointing given the focus on performance with the ranking impact of the Core Web Vitals.
Security and Privacy
Measuring the security and privacy impact of using third parties is more difficult. Undoubtedly, giving access to third parties increases risks on both security and privacy, and then giving access to run scripts—which we’ve shown to be the most prevalent type—effectively gives full access to the website. However, the entire intent of third-party resources is to allow them to be seamlessly used on the sites, meaning restricting this will limit the very functionality they are being used for.
Security
Sites themselves can reduce the risk of using third parties in a number of ways: restricting access to cookies with the HttpOnly attribute, so they cannot be accessed by JavaScript, and through appropriate use of SameSite attributes. These are explored more in the Security chapter so we will not delve further into them here.
Another security feature that can make third-party resources safer is the use of Subresource Integrity (SRI), which is enabled by adding a cryptographic hash of a resource to the <link> or <script> element loading the resource. This hash is then checked by the browser to ensure that the content downloaded is exactly what is expected. However, the varying nature of third-party resources could mean that this introduces more risks than it solves, with sites breaking when resources are intentionally updated by the third party. If content really is static, then it can be self-hosted, removing the need of SRI. So, while many people recommend SRI, this author remains unconvinced that it really offers the security benefits that proponents claim.
One of the best ways sites can reduce the security risk of any third-party content coming onto their site—from either third-party resource use, or even user-generated content—is with a robust Content Security Policy (CSP). This is an HTTP header sent with the original website that tells the browser exactly what resources can and cannot be loaded and by whom. It is a more advanced technique that few sites use, according to the Security chapter, and we’ll leave it to them to analyze CSP usage, but what is worth covering here is that one of the reasons for the lack of uptake may be third parties. In this author’s experience, very few third parties publish CSP information with the exact requirements that sites must add to their policy to use the third party without issue. Worse still is that others are incompatible with a secure CSP. Some third parties use inline script elements or change domains without notification, which breaks that functionality for sites using CSP until they update their policy. Google Ads is another example which, through the use of a different domain per country, makes it difficult to really lock down CSP.
It is difficult enough to set up CSP in the first place for the parts of the site in your control, without the added complexity of third parties making it even more difficult for things outside of your control! Third parties really should get better at supporting CSP to make it easier for sites to reduce the risk of using them.
Privacy
The privacy implications of using third parties is something we will again leave to the Privacy chapter dedicated to this topic, but what should already be apparent from the above analysis are the following two things that majorly impact the privacy of web users:
- The prevalence of third-party usage on the web at just shy of 95% of websites.
- The dominance of particular third parties, like Google and Facebook, who are not known for being on the side of privacy.
Of course, one of the major reasons for using third parties on your site is for tracking for advertisement purposes, which by its very nature is not going to be in the best privacy interests of your visitors. Alternatives to this pervasive tracking, which is basically only possible by the use of third parties, have been suggested such as Google’s Privacy Sandbox and FLoC initiative but have, so far, failed to gain sufficient traction across the wider ecosystem.
What is perhaps more concerning is the tracking that can occur without website users and owners being aware. There is the old adage that if you’re not paying for a product or service, then you are the product. Many third parties give away their product for “free”, which for most means they are monetizing it in some other way—usually at the expense of your visitors’ privacy!
Adoption of newer technologies like feature-policy and permission-policy can restrict the usage of certain functionalities of the browser, such as microphones and video cameras. These can reduce the privacy and security risks; though many of these will usually be secured behind a browser prompt to ensure they are not silently activated. Google is also working on a Privacy Budget proposal to limit the privacy impact of web browser, though others remain skeptical of their work in this space. All in all, adding privacy controls seems to be swimming against the tide given the intent of many third-party resources.
Conclusion
Third parties are integral to the web. In many ways they are the web; without the prevalence of third parties, websites would be harder to build and less feature rich. As mentioned at the beginning, interconnectedness is at the very heart of the web, and third parties are the natural extension of this. Our analysis has shown that third parties are more prevalent than ever—sites without them are very much the exception!
However, using third parties is not without risks and in this chapter, we have explored the performance impact of third parties and discussed the potential security and privacy risks of using them on your site.
There are consequences to needlessly loading up your website with every third-party tool, widget, tracker and whatever else you can think of. Site owners have a responsibility to look at the impact of all that third-party content and decide if the functionality is worth that potential impact.
It’s easy to get sucked into the negative however, so to finish off the chapter, let’s look back at the positives. There is a reason that third parties are so prevalent and they are (usually!) used out of choice. Sharing is what the web is about and so third parties are very much in the spirit of the web. It’s amazing what functionality we web developers have at our disposal and how easy it is to add them to our sites. Hopefully this chapter has opened your eyes to give a little more thought to making sure you fully understand the deal you’re making when you do that.
